
RashidHamada
@t_RashidHamada

What symbols does the trader recommend buying?
Purchase History
پیام های تریدر
Filter
RashidHamada
تحلیل هفتگی SUI/USD: آیا پرچم صعودی شکسته میشود؟ پیشبینی حرکت بزرگ بعدی
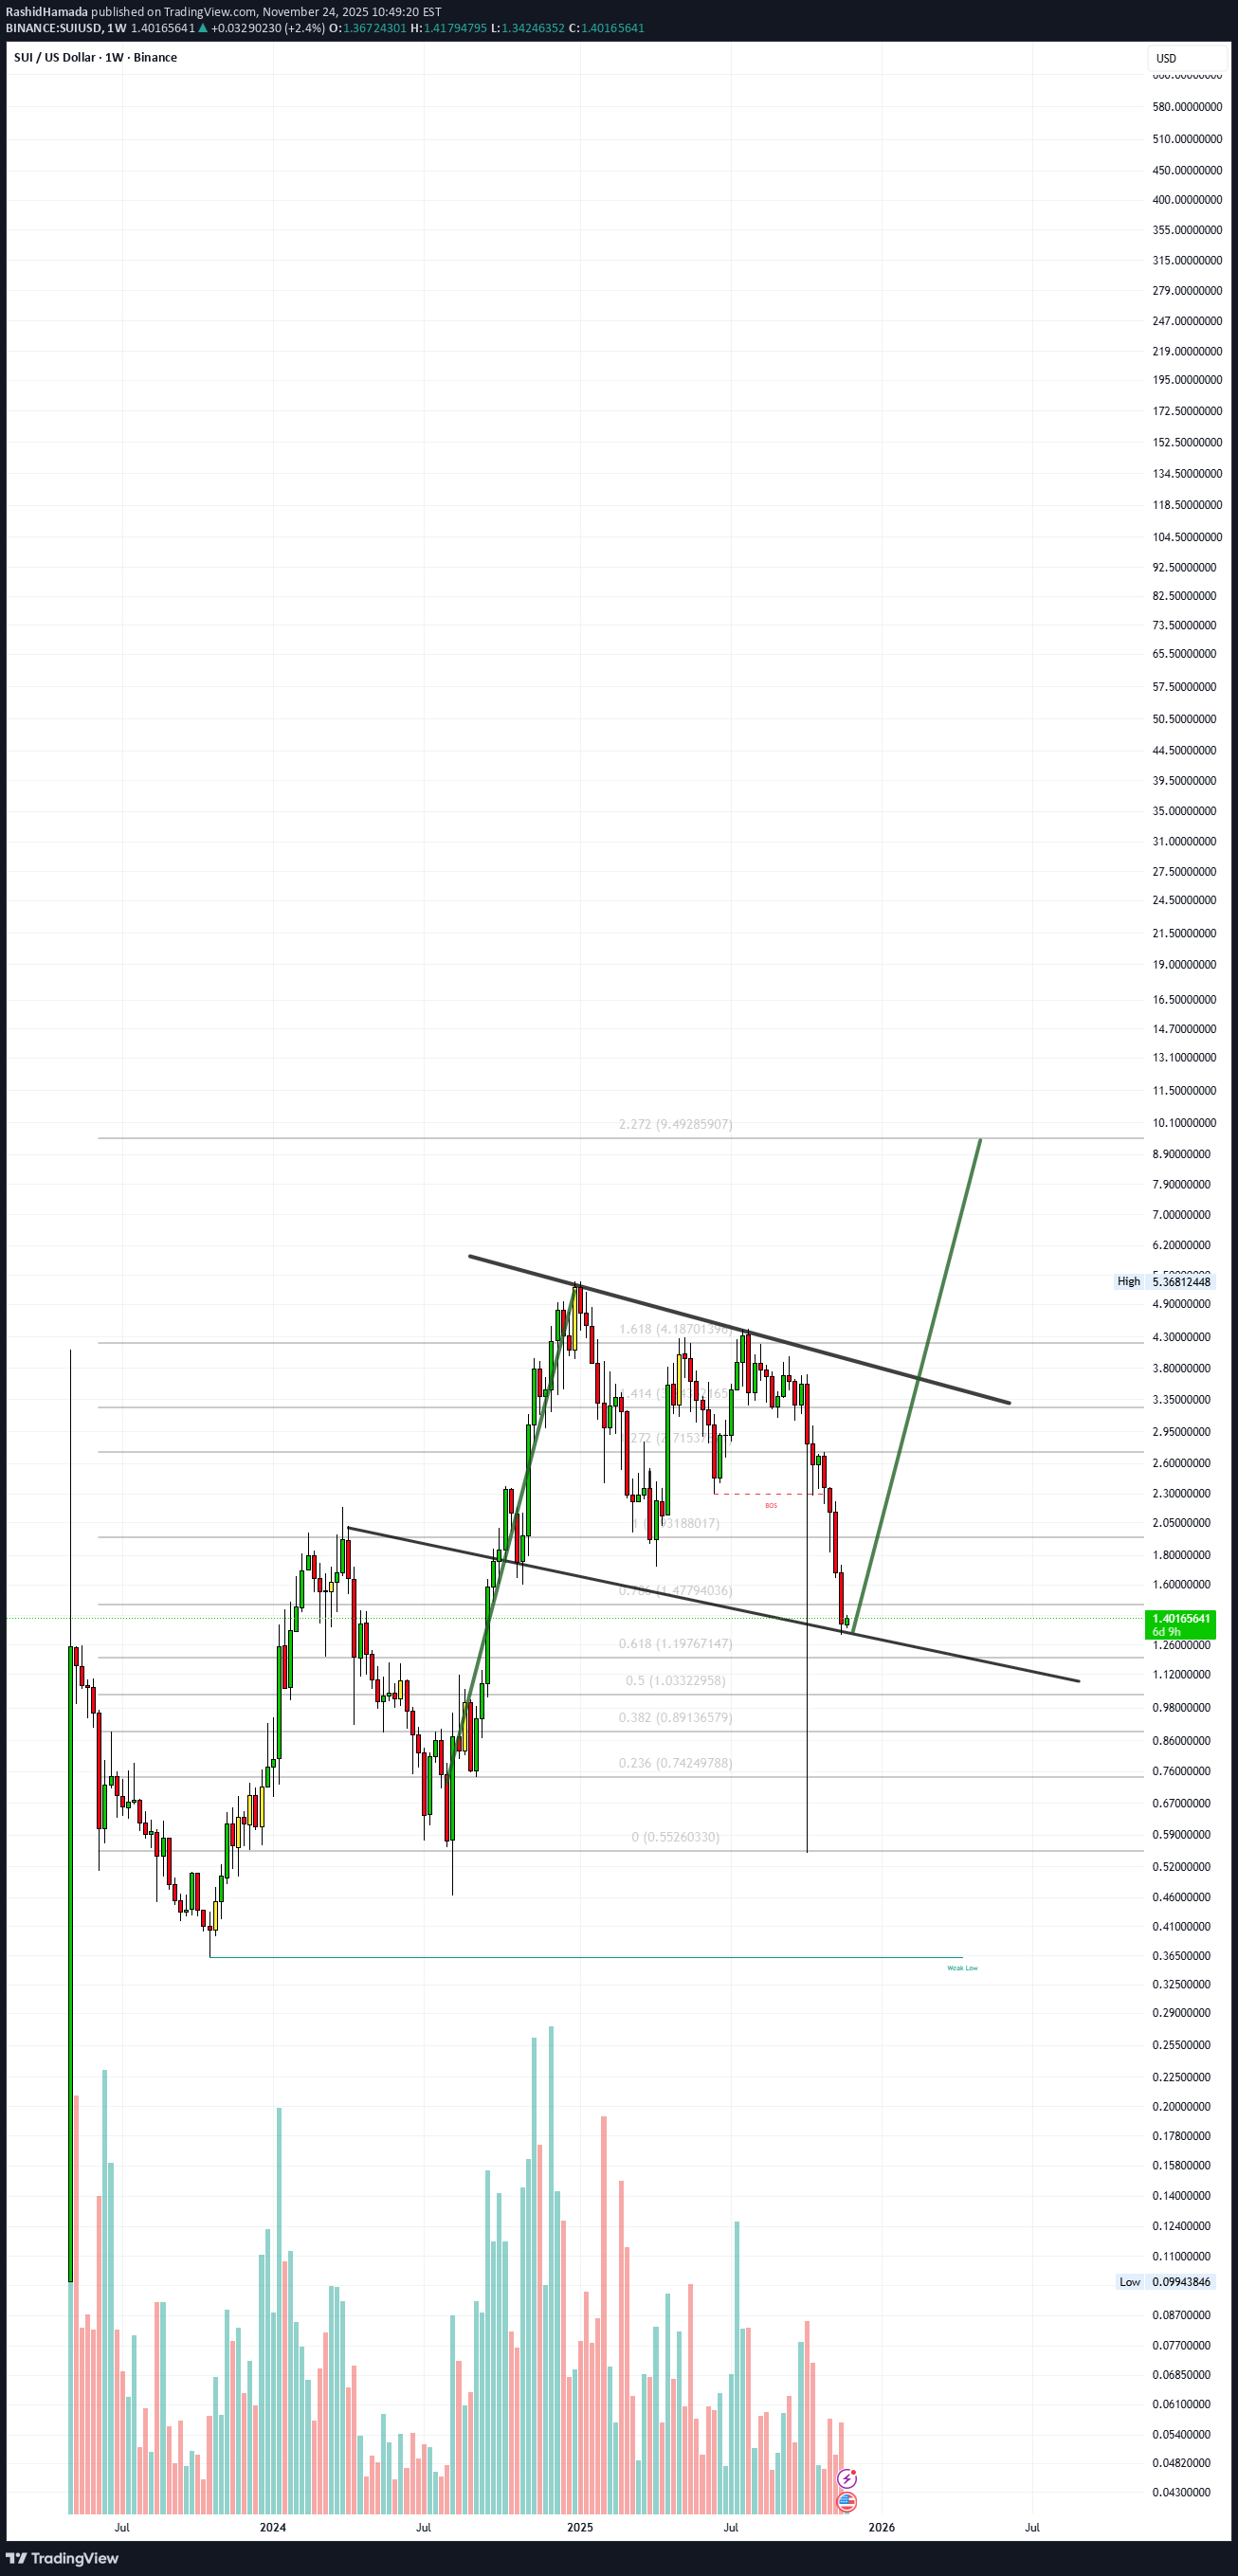
The price action on the weekly timeframe shows SUI moving within a well-defined bullish flag pattern, characterized by a strong impulsive move upward followed by a controlled, downward-sloping consolidation channel. 🔹 Pattern Structure The overall structure forms a bullish flag, which is typically a continuation pattern appearing after a strong upward rally. The price is currently trading near the lower boundary of the flag, an area that has historically acted as dynamic support throughout the consolidation phase. The repeated bounces from this region highlight ongoing demand and suggest the pattern remains valid. 🔹 Market Behavior The pullback within the flag appears orderly, with price respecting the upper and lower trendlines of the channel. Volume behavior also supports the flag structure: Momentum expanded during the impulsive rally, then contracted during consolidation—typical of a healthy continuation setup. 🔹 Potential Scenario If the lower boundary continues to hold: The chart suggests a potential upward breakout from the flag. This breakout would align with the larger trend and indicate a continuation of the previous bullish leg. A breakout from the flag’s upper trendline would confirm the move and open the way for a new expansion phase. 🔹 Summary SUI is consolidating within a bullish flag, maintaining its structure and showing signs of strength at support. As long as the lower channel boundary remains intact, the pattern favors a continuation of the broader uptrend.
RashidHamada
تحلیل هفتگی کاردانو (ADA): آیا پامپ تاریخی در راه است؟ (مثلث استراتژیک)
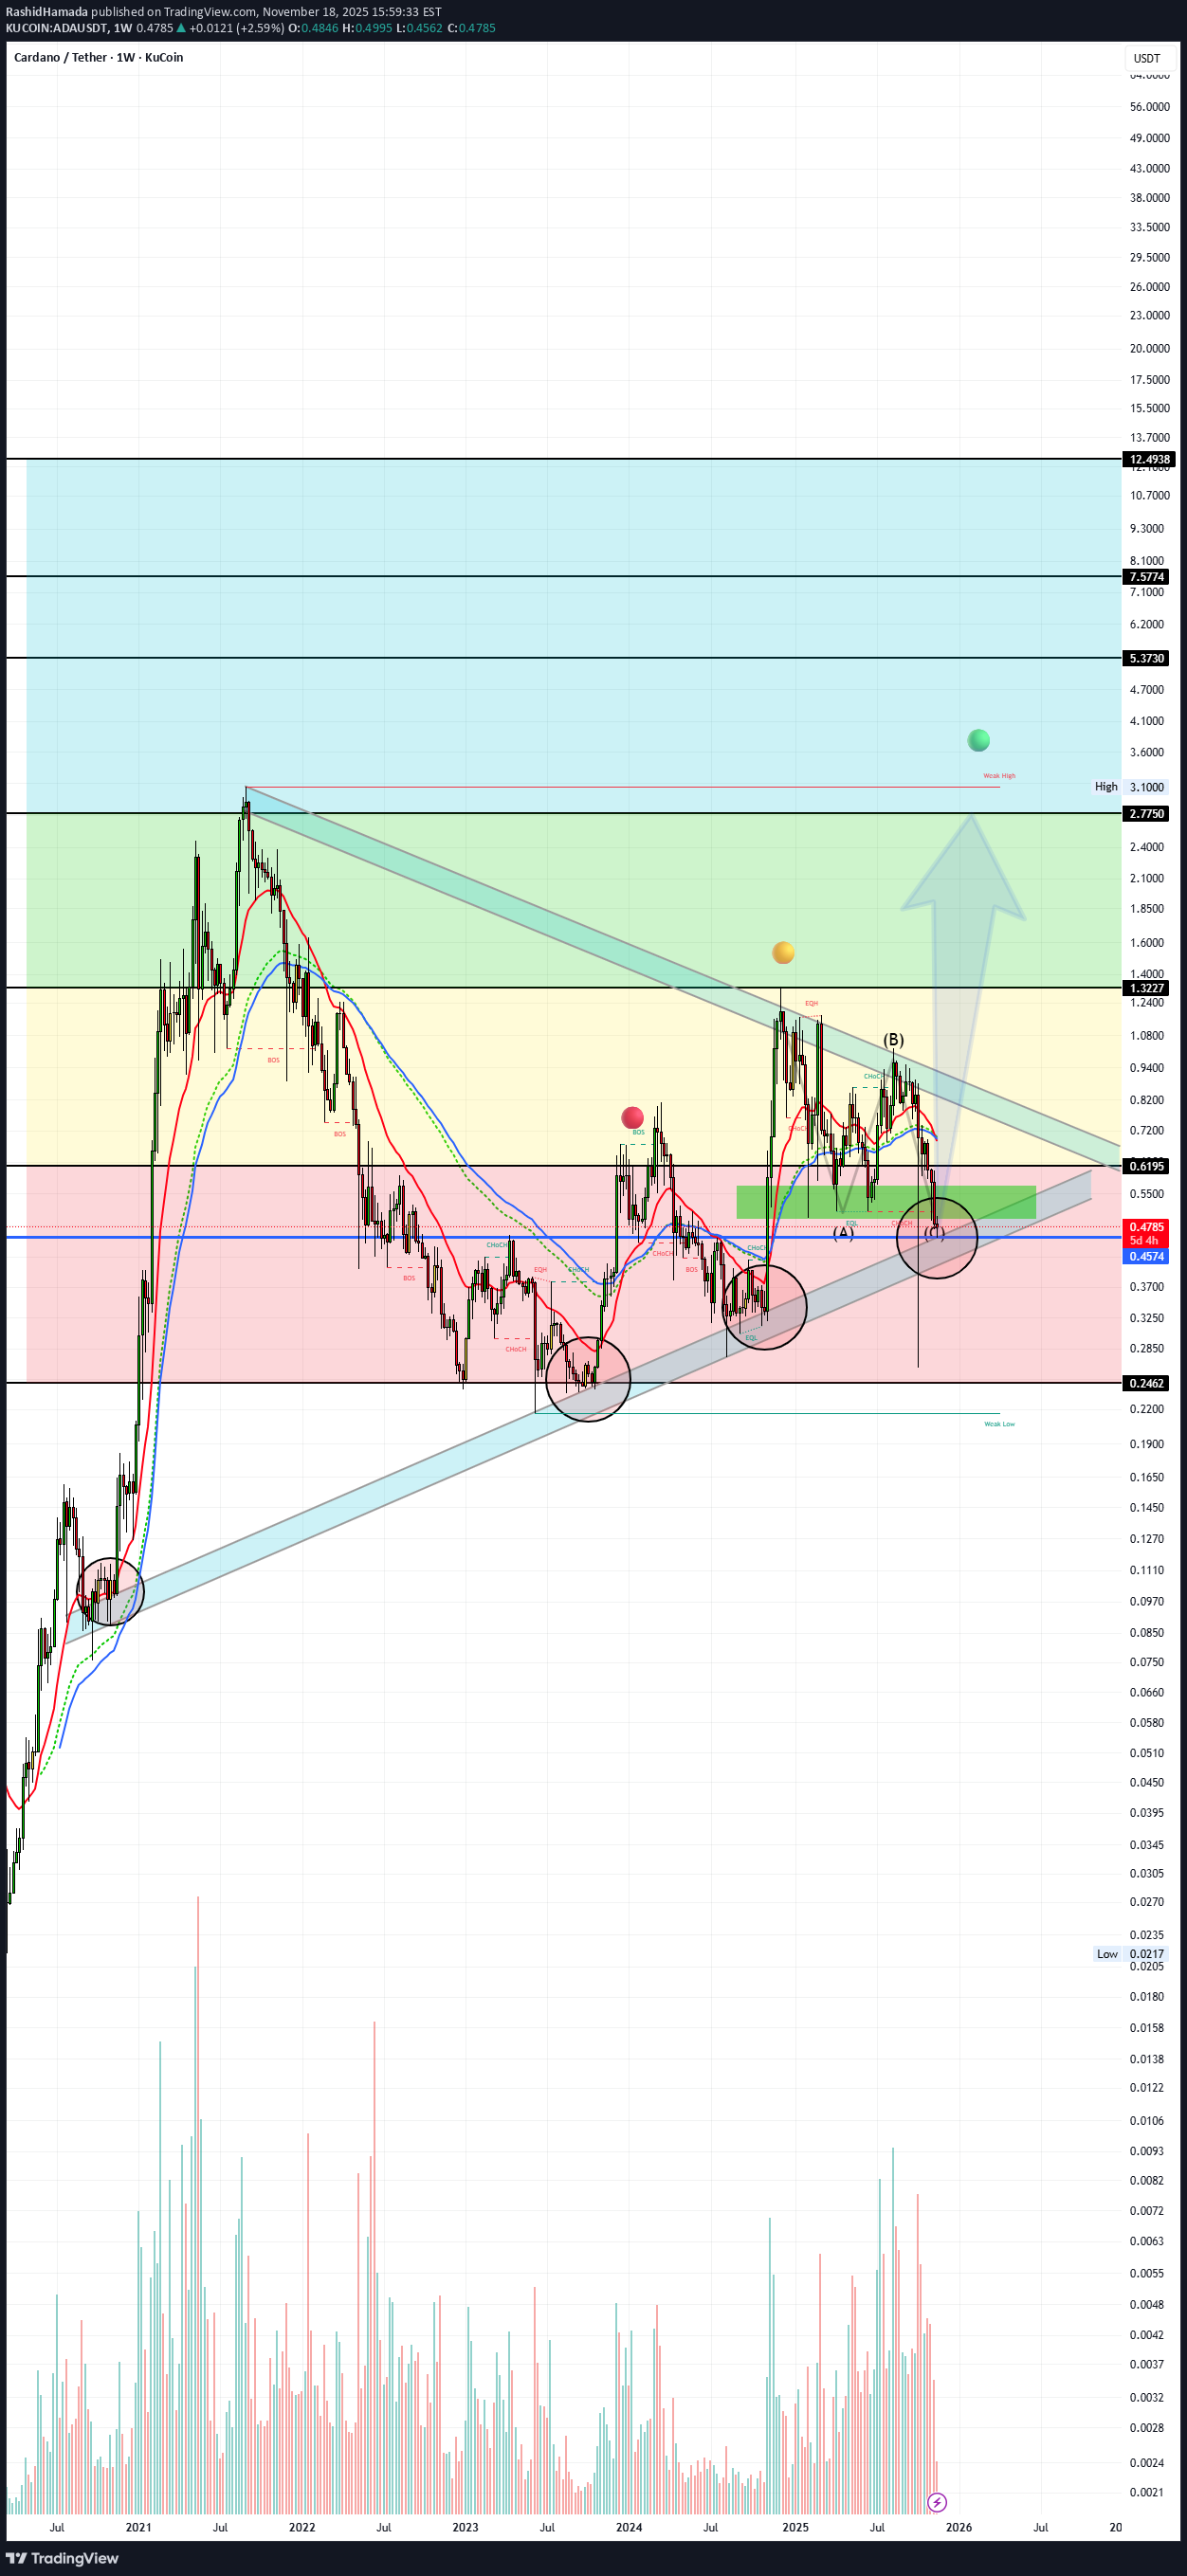
ADA has been moving inside a large Symmetrical Triangle since the 2021 peak — a long-term consolidation pattern that typically leads to a strong breakout once price compression reaches its end. When observing the major support line of the triangle, the price has shown a clear repetitive behavior: - First touch of support: Price bounced strongly and reached the red point. - Second touch of support: A similar reaction occurred, sending the price up to the yellow point. - Third touch (current position): ADA has returned to the same support level, placing it in the exact zone where previous major rallies began. So far, the full bullish reaction hasn’t happened yet. Based on the pattern structure and historical behavior, the next logical move is: 📌 A potential rally toward the green point — the previous ATH zone. With the triangle nearing its apex and the altcoin cycle approaching, the probability of a strong upward breakout increases significantly.
RashidHamada
Chainlink - 1W

Overview Chainlink (LINK) is experiencing an interesting price movement on the weekly timeframe, forming a Symmetric Triangle pattern. This pattern is a strong technical formation that often precedes significant price movements upon breaking one of its sides. This analysis focuses on the pattern, key resistance and support levels, and price expectations if the resistance is broken. Symmetric Triangle Pattern Pattern Formation: The Symmetric Triangle forms as price volatility gradually contracts, creating two converging trendlines (a descending resistance line and an ascending support line). On Chainlink’s weekly timeframe, this pattern is clearly visible, indicating a consolidation period before a major price move. Time Duration: The pattern has persisted for several weeks, enhancing its technical significance, as longer-term patterns are generally more reliable. Trading Volume: A gradual decrease in trading volume is observed as the price approaches the triangle’s apex, a typical behavior reflecting traders’ anticipation of an imminent breakout.
RashidHamada
Dogecoin (DOGE) - 1W

On the weekly timeframe, Dogecoin (DOGE) formed a Symmetric Triangle and broke out bullish in November 2024. The breakout level, now support, was retested in April 2025. If this support holds, DOGE is likely to rally to a new all-time high, driven by community hype and market momentum. Failure to hold support could invalidate the breakout, risking a decline. Monitor the support zone and manage risks due to DOGE’s volatility.
RashidHamada
Cardano (ADA) - 1D

ADA has recently broken out of a Falling Wedge pattern, which is a bullish technical pattern. After trading within this pattern for some time, ADA successfully surpassed the resistance level, indicating potential upward momentum. This breakout suggests that buyers are gaining control, and the price may continue to rise in the near term. targets to watch: - $0.6652 - $0.8413 - $1.1337we have reached the first target.we have reached the second target.
RashidHamada
XRP | Head and Shoulders Pattern.

Head: $3.4. Left Shoulder: $2.9. Right Shoulder: $3.0. The Neckline: $2.00. Components of the Pattern: Left Shoulder: Represents the first peak at $2.9, where the price rose and then retreated to the neckline at around $2.00. Head: The highest peak at $3.4, the topmost point of the pattern, followed by a retreat to the neckline at $2.00. Right Shoulder: The second peak at $3.0, lower than the head, followed by a retreat to the neckline at $2.00. Neckline: Remains at approximately $2.00, a horizontal support level connecting the lows after the left shoulder and the head and the right Shoulder. Implications of the Pattern: The pattern remains a bearish reversal pattern, indicating a weakening of bullish momentum after reaching the head at $3.4. If the price breaks below the neckline ($2.00) with increased volume, this confirms the pattern’s completion and signals a significant decline. Current Situation (March 2025): The current price ($2.2) is very close to the neckline ($2.00), making a breakout likely in the coming days. The potential crossover of the moving averages (blue and red lines) supports the possibility of a trend change. NOTE: If the price bounces off the neckline ($2.00) with increased volume, this invalidates the pattern. In this case, the price might attempt to retest resistance at $3.0 (right shoulder peak) or even $3.4 (head peak). Conclusion: The Head and Shoulders pattern: indicates a strong potential for a bearish reversal, if the price breaks below the neckline ($2.00). Confirmation of the breakout with increased volume is essential, while considering fundamental news that might influence the market.
RashidHamada
BTC - 1M

this is BTCUSDT on 1M time frame I will not be surprised if i see BTCUSDT go back to 60k areas to retest the support. Not financial advice.BTC - 1D Still bullish nothing to worry about and maybe this is the end of the correction losing this bull flag will lead us to that areas i mentioned before.
RashidHamada
ADA - 1M

i will make it easy and simple Tell now ADAUSD is making the same move as the last cycle If it hold the support i think we will see a massive upside move in the coming months. Not financial advice.
RashidHamada

RashidHamada
ADA on 4H time frame

............................................ an idea for ADAUSD on 4H time frame if we break the resistance with targets hasta la vista.
Disclaimer
Any content and materials included in Sahmeto's website and official communication channels are a compilation of personal opinions and analyses and are not binding. They do not constitute any recommendation for buying, selling, entering or exiting the stock market and cryptocurrency market. Also, all news and analyses included in the website and channels are merely republished information from official and unofficial domestic and foreign sources, and it is obvious that users of the said content are responsible for following up and ensuring the authenticity and accuracy of the materials. Therefore, while disclaiming responsibility, it is declared that the responsibility for any decision-making, action, and potential profit and loss in the capital market and cryptocurrency market lies with the trader.