
RTED_Investing
@t_RTED_Investing

What symbols does the trader recommend buying?
Purchase History
پیام های تریدر
Filter
RTED_Investing
سقوط سولانا (SOL) به کجا میرسد؟ زیر ۱۵۵ منتظر چه اتفاقی هستیم؟

SOL/USDT is approaching the 150–155 resistance cluster, where key technical levels—including the descending trendline, horizontal supply, and local upward trendline—converge. Despite a sharp rebound, the overall trend remains bearish, with lower highs dominating the structure. Recent price action appears corrective, not impulsive, suggesting this move may be a retracement rather than a true reversal. If price gets rejected from this confluence zone, the bearish continuation toward 133 becomes the base case. Deeper downside could follow toward the mid-channel support unless bulls reclaim ground decisively. ➡️ Primary scenario: Rejection from 150–155 → drop toward 133 ❗️ Risk scenario: Break and close above 155 would flip bias short-term bullish.
RTED_Investing
لینک (LINK) زیر 14 دلار گیر افتاده است: آیا سقوط به 11.75 قطعی است؟

LINK/USDT respected prior analysis, advancing into the 14.00 resistance zone, where the descending trendline and former structure highs intersect. Price is forming a corrective pullback after a recent lower low, while momentum fades. The broader downward channel remains intact, reinforcing the bearish outlook. As long as sellers defend 14.00, the pair is likely to extend toward the 11.75 liquidity pocket, aligning with the established trend of rejections and lower lows. ➡️ Primary view: Rejection from 14.00 → move toward 11.75 ❗️ Risk: Breakout above the channel would invalidate bearish structure.
RTED_Investing
سولانا (SOL) از کف حمایتی جهش کرد: آیا رالی نجات آغاز میشود؟

SOL/USDT bounced strongly from the 128–130 support zone, reacting off the lower boundary of its downward channel. While the broader trend remains bearish, this move signals early signs of accumulation. Holding above 130 could open a corrective rally toward 155, as oversold conditions unwind and short-term momentum favors a relief push. ❗️Risks: – Losing 128–130 support reopens downside toward 120–115 – Volatility in BTC may cap gains – Failure to reclaim the channel midpoint may stall the recovery
RTED_Investing
حمایت 92 هزار دلاری بیت کوین: آیا واگرایی صعودی آغاز رالی جدید است؟

BTC/USDT is testing the 92,000 key support, a level that previously triggered a major reaction. A bullish divergence is forming as price compresses at the bottom of a downward channel, hinting at a potential corrective rebound. If buyers defend the zone, a move toward 100,500 resistance is likely. While overall momentum remains bearish, the divergence supports a short-term bullish swing before the broader trend resumes. ❗️ Risks: – Break below 92,000 opens deeper downside. – Macro trend continuation may invalidate divergence. – Failure at mid-range resistance could cap the rally early.
RTED_Investing
سولانا (SOL) در آستانه انفجار؛ آیا قیمت از مرز ۱۵۰ دلار عبور میکند؟

SOL/USDT is testing the lower boundary of structure after repeated failures to break the descending trendline. Price is compressing just above the $150 psychological support, suggesting possible accumulation at this level. A break above $160 and the trendline could trigger a recovery toward $175 resistance. Momentum favors a bullish bias as long as $150 holds. ❗️ Risks: – Rejection at $160 may lead to a retest of $147. – BTC weakness could stall upside. – Stronger USD or risk-off flows may delay breakout.
RTED_Investing
طلا (XAU/USD): طلا دوباره اوج میگیرد! آیا مسیر 4285 باز است؟

XAU/USD is reclaiming ground above the broken range, retesting the 4,150 zone while maintaining bullish momentum from the recent breakout. Price is forming higher lows along the upward trendline, beneath the descending resistance line. A sustained move above 4,150 keeps the path open toward 4,285, as long as buyers defend the retest. Momentum remains bullish, with potential for further extension into the upper resistance zone. ❗️ Risks: – H4 close below 4,150 weakens the setup. – Strong USD data may trigger a pullback. – Rejection from the descending trendline could stall momentum.
RTED_Investing
طلا (XAU/USD) در آستانه 4,155: آیا صعود ادامه مییابد یا اصلاح در راه است؟

XAU/USD extended its rally after breaking out of the range zone, now testing a confluence area near 4,155 within resistance. The structure forms a steep upward channel, with signs of short-term exhaustion near the upper boundary. If price fails to hold above 4,150, a pullback toward 4,065–4,000 may follow. While the broader trend remains bullish, momentum appears stretched, hinting at a pause before continuation. ❗️ Risks: – Break above 4,150 could extend gains to 4,220. – Soft U.S. inflation may weaken USD and lift gold. – Geopolitical tension could boost safe-haven flows, limiting downside.
RTED_Investing
بیت کوین زیر ۱۰۹ هزار گیر کرد: آیا سقوط به ۱۰۲ هزار قطعی است؟

BTC/USDT fulfilled the prior move and is now struggling below the 109,000 resistance after rebounding from 99,000. Price remains in a descending channel, approaching a key confluence zone near 109,200 where upward and downward trendlines intersect. If this level holds, a decline toward 102,250 support remains likely. The bearish bias stays intact as long as the lower high structure persists. ❗️ Risks: – Break above 109,800 may trigger short covering. – Dovish Fed or soft inflation data could lift sentiment. – ETF inflows may drive renewed spot demand.
RTED_Investing
طلا زیر سقف ۴۱۰۰: آیا سقوط به ۳۹۰۰ در راه است؟
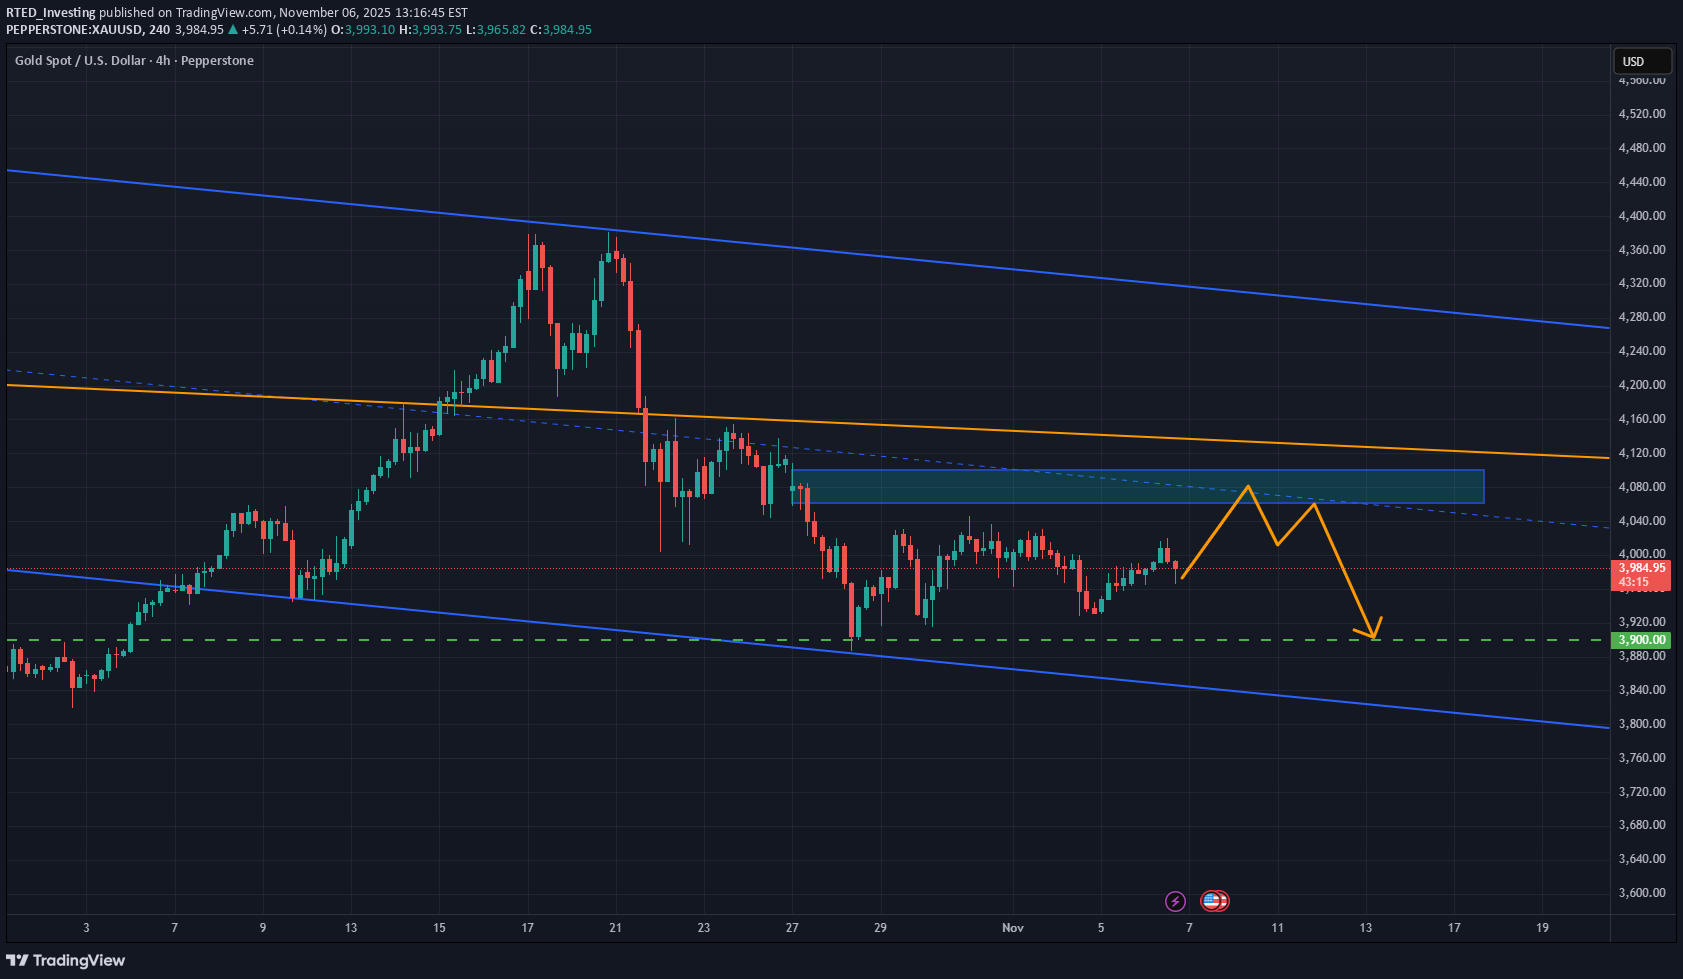
XAU/USD rebounded from the channel base but remains below the downward trendline and the 4,080–4,100 supply zone. Price is forming lower highs inside a falling channel, with choppy consolidation mid-range. A sustained move below 4,080 could trigger downside toward 3,900, with 3,827 as an extended target if momentum accelerates. To shift bias, bulls must reclaim and hold 4,100–4,135, which would reopen upside toward 4,200+. ❗️ Risks: – Break above 4,100–4,135 could squeeze shorts and flip bias bullish. – Soft U.S. data or risk-off flows may trigger gold strength. – Event-driven volatility could disrupt intraday structure and positioning.
RTED_Investing
افت شدید قیمت XRP؟ چرا زیر ۲.۵۰ دلار گیر کرده و منتظر سقوط به ۲.۰۰ دلار است؟
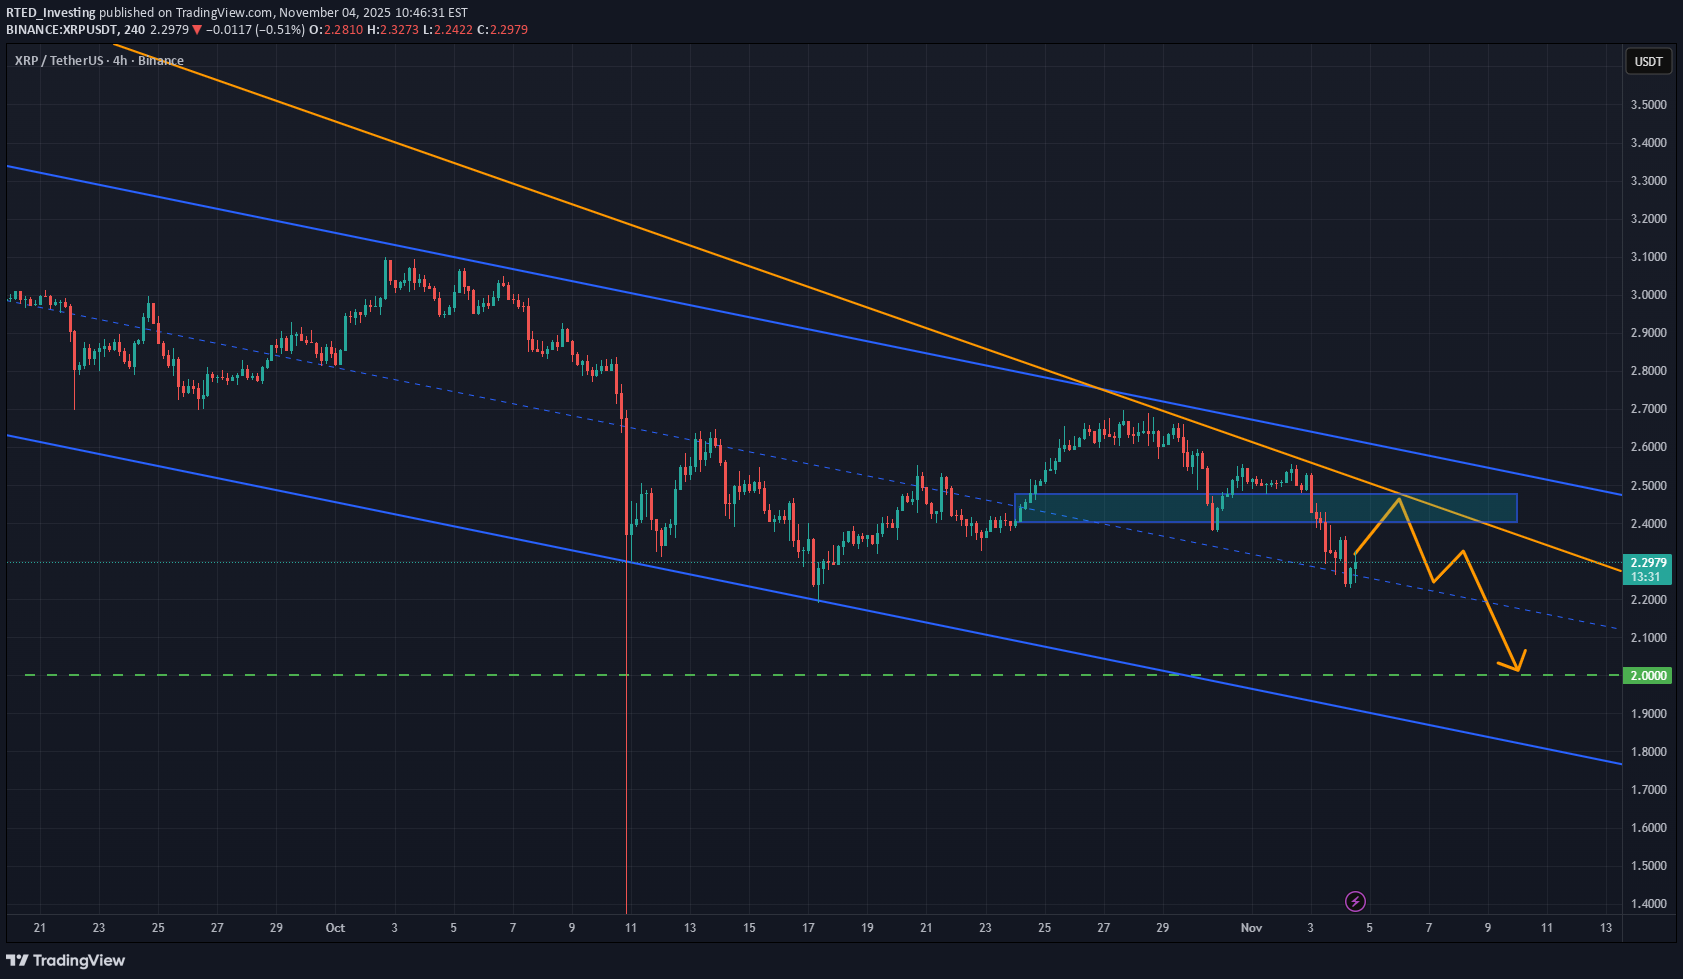
XRP/USDT continues to trade below the descending trendline inside a clear downward channel, maintaining a bearish structure. The recent rejection at the $2.44 zone signals ongoing weakness, with price unable to break higher. As long as it stays below the $2.50 resistance, a move back toward $2.00 support remains likely. Momentum favors a gradual drift lower, keeping short-term bearish pressure in place. ⚠️ Risks: – A Bitcoin rally could lift altcoins and disrupt the setup. – Regulatory news around XRP may increase volatility. – U.S. macro shifts could impact USD strength and XRP flow.
Disclaimer
Any content and materials included in Sahmeto's website and official communication channels are a compilation of personal opinions and analyses and are not binding. They do not constitute any recommendation for buying, selling, entering or exiting the stock market and cryptocurrency market. Also, all news and analyses included in the website and channels are merely republished information from official and unofficial domestic and foreign sources, and it is obvious that users of the said content are responsible for following up and ensuring the authenticity and accuracy of the materials. Therefore, while disclaiming responsibility, it is declared that the responsibility for any decision-making, action, and potential profit and loss in the capital market and cryptocurrency market lies with the trader.