
Quant_Trading_Pro
@t_Quant_Trading_Pro

What symbols does the trader recommend buying?
Purchase History
پیام های تریدر
Filter
Quant_Trading_Pro
ETH 4H – EMA Cross Rejects, But Can Rising Support Hold?
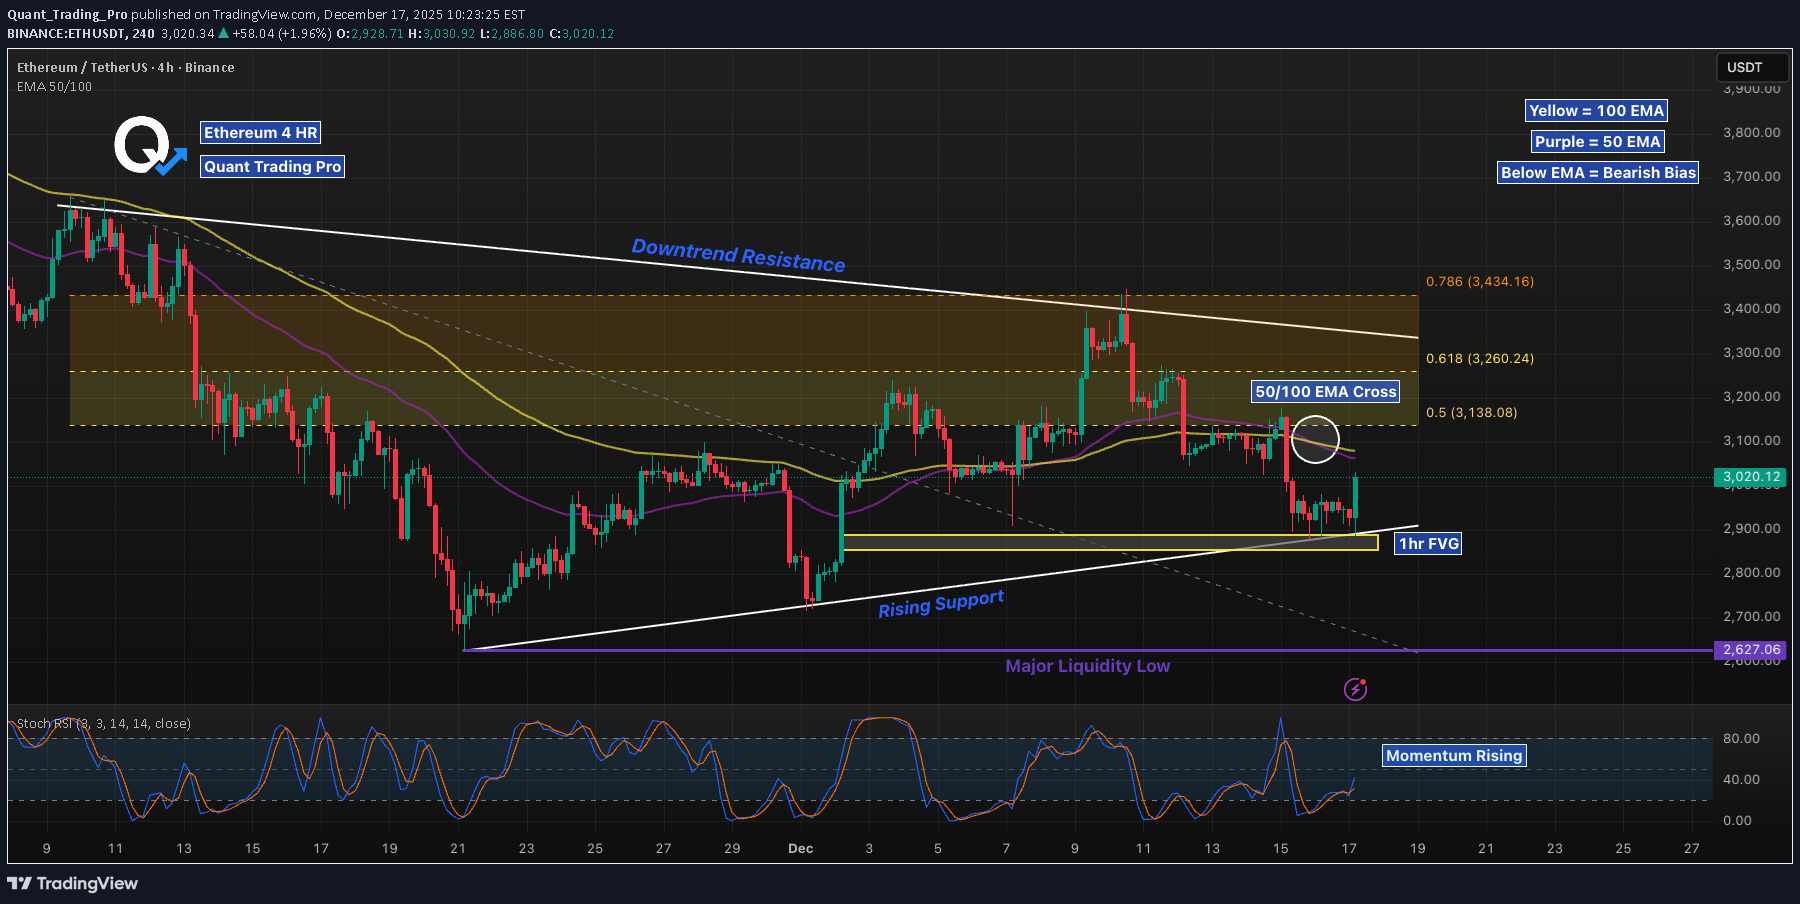
Ethereum continues to trade within a larger corrective structure, capped by long-standing downtrend resistance while respecting a rising support trendline from the lows. After briefly pushing into the HTF retracement zone, price failed to hold above the 0.5 level and rolled over following a confirmed 50 / 100 EMA bearish cross. Acceptance below the EMA cluster keeps short-term bias tilted bearish unless reclaimed. Price is now reacting into a 1-hour Fair Value Gap, which aligns closely with rising diagonal support — making this a critical decision area. Bull scenario: Holding rising support and defending the 1H FVG could allow ETH to rotate back toward the EMA cluster and mid-range, but this remains corrective unless price reclaims and holds above the EMAs. Bear scenario: Failure to hold rising support opens downside continuation toward the major liquidity low, where higher-timeframe demand would be expected to step in. Until ETH reclaims the EMA structure and mid-range levels, rallies remain reactive, not trend-confirming.
Quant_Trading_Pro
SOL 4H – Golden Pocket Rejection, Trend Pressure Still Down

SOL continues to trade within a clearly defined bearish structure, with both the daily and 4H trendlines acting as dynamic resistance. The recent push into the 0.618–0.65 Fibonacci golden pocket was rejected cleanly, aligning with prior horizontal resistance near the 144 level — reinforcing this zone as a high-probability supply area. Price remains capped below the 50 and 100 EMAs, which are now compressing and sloping downward, suggesting downside continuation unless structure is reclaimed. As long as SOL holds below the descending trendlines, rallies are best viewed as corrective rather than impulsive. On the downside, range support near 123–124 remains the key level to watch. A clean break below this zone would open the door for expansion lower, while any bullish scenario requires a reclaim and hold above the golden pocket and trend resistance — something price has failed to achieve so far. Momentum shows short-term relief attempts, but trend control remains firmly bearish until proven otherwise.
Quant_Trading_Pro
ETH 4H Trendline Retest Bounce, Bullish Structure Still Holding
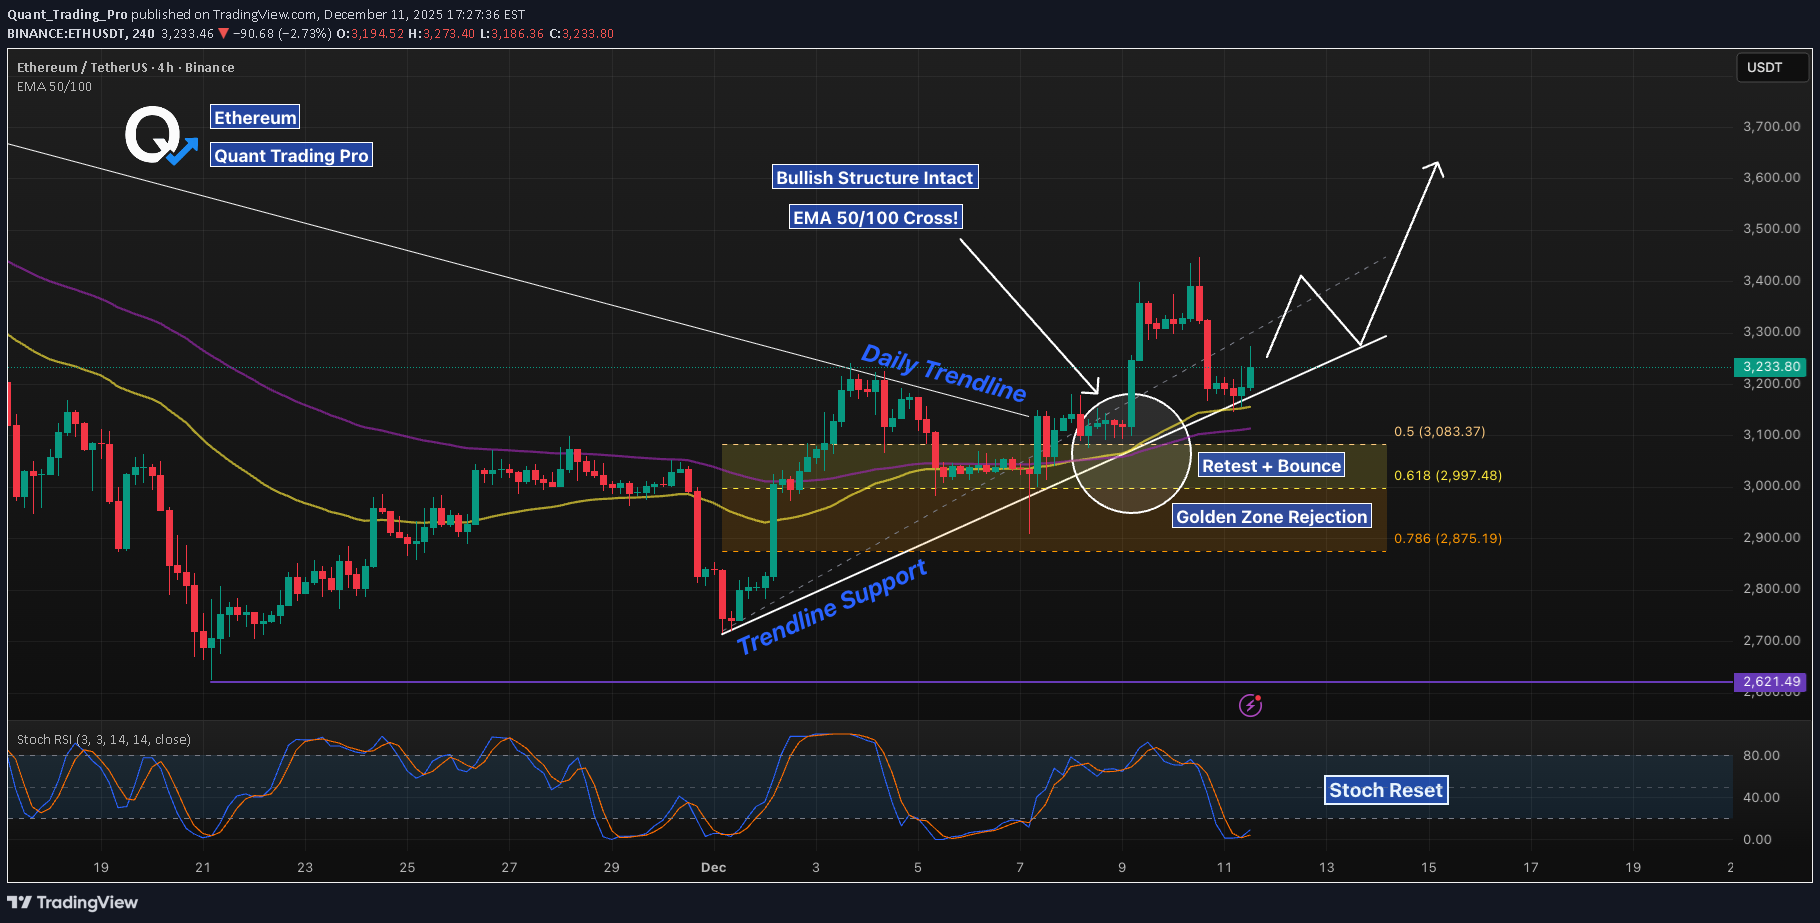
Ethereum continues to respect the ascending 4H trendline while holding above the 50/100 EMA cross. After tapping the 0.5–0.618 Fib retracement zone, price reacted cleanly and reclaimed structure, forming a textbook retest-and-bounce setup. The daily trendline break adds higher-timeframe confluence, and the Stoch RSI has fully reset, creating room for a potential continuation move. If bulls maintain the trendline and stay above the 50 EMA, the next objectives remain the prior swing high near $3,400 and the mid-channel diagonal above it. A breakdown of the trendline would open a revisit of the deeper Fib levels at $3,083 and $2,997. Structure remains bullish unless those levels fail.
Quant_Trading_Pro
ETH 4H – EMA Rejection at FVG Zone, Watching HTF Liquidity
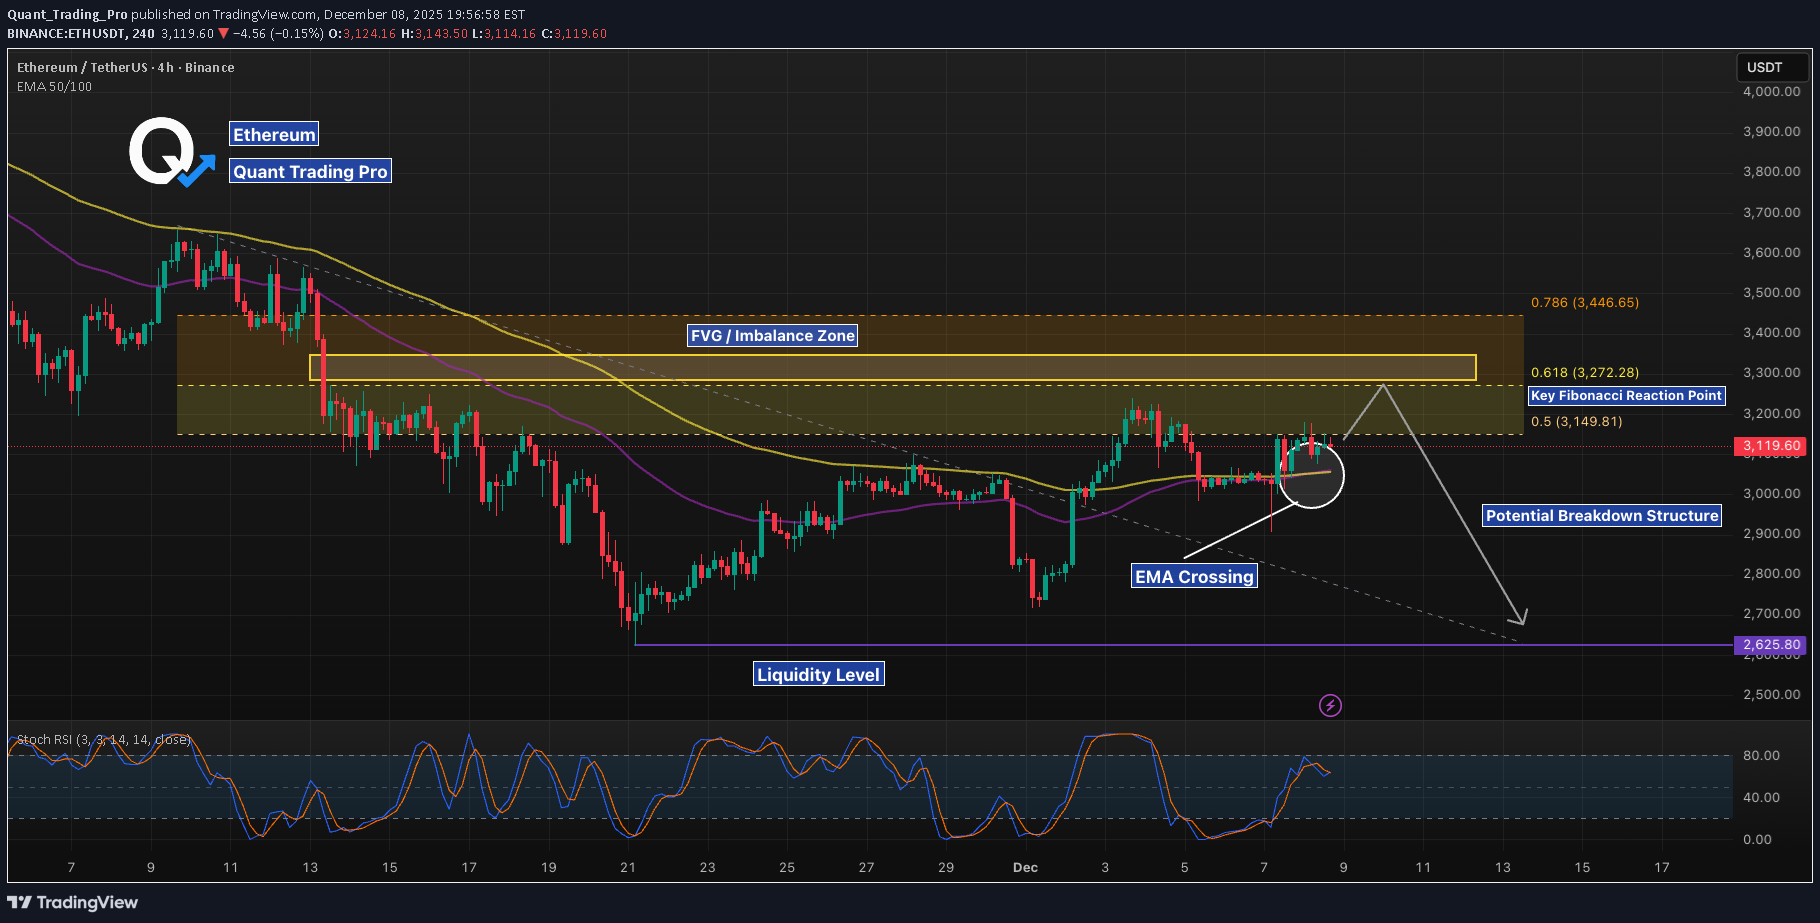
ETH is reacting precisely at the confluence of the 50/100 EMAs and the 0.5–0.618 retracement zone, where prior inefficiency from the last breakdown remains unmitigated. Price tapped into the upper portion of the FVG/imbalance region before showing signs of exhaustion, producing a clear rejection cluster around the EMA cross. This region carries strong structural significance: it’s the origin of the last major displacement down, and it has not been fully rebalanced. Market structure on the 4H remains neutral-to-bearish while price trades below both EMAs, and each touch into the imbalance zone has generated a reaction. Until ETH can reclaim and close above the 0.618, this zone remains a high-probability distribution area. The circled area illustrates a classic interaction: liquidity-driven push into resistance, loss of momentum, and a rejection back toward mid-structure. If price confirms a break of the rising intraday trendline, continuation toward the liquidity shelf at 2,625 becomes the next logical draw. This level acted as a major accumulation pivot earlier in the trend and represents meaningful resting liquidity. Stoch RSI is curling down from elevated levels, adding confluence to the idea of a short-term corrective phase unless ETH reclaims the EMAs decisively. At this stage, ETH sits between inefficiency above and liquidity below, forming a clean HTF decision zone. Reclaiming the imbalance would shift structure upward; losing the diagonal base would re-open the path to deeper liquidity.
Quant_Trading_Pro
SOLANA – Key Support Retest, Watching HTF Structure Closely
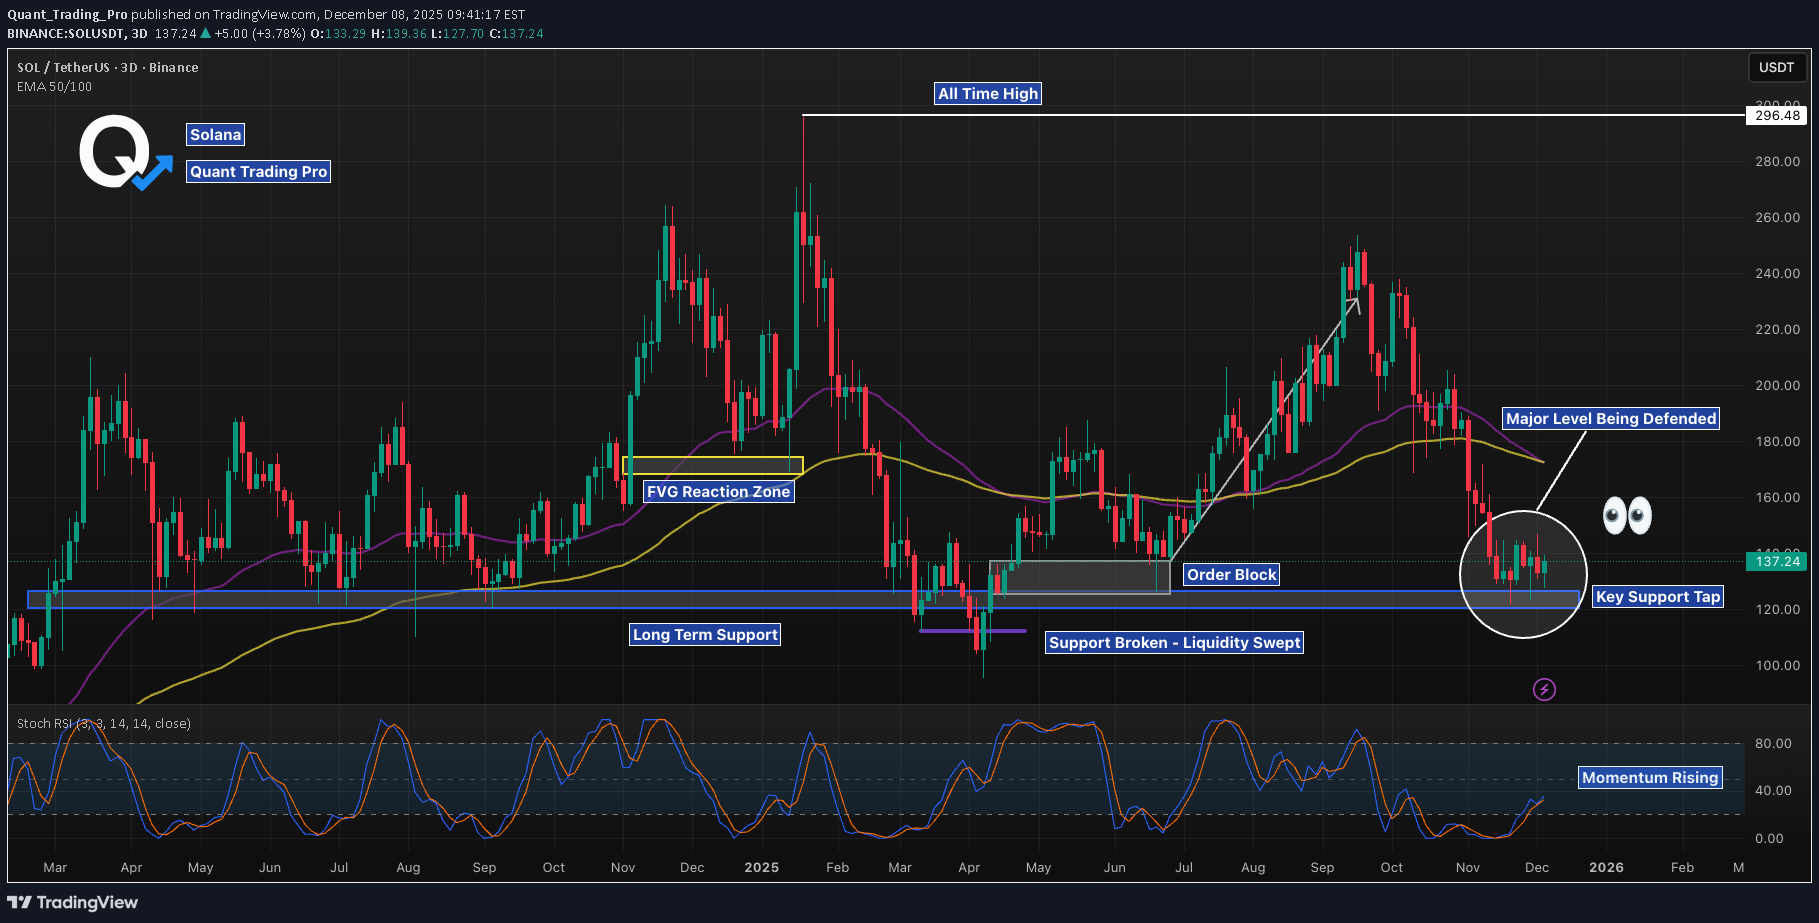
SOL is interacting with one of the most important HTF zones on the chart — the multi-year support level that has repeatedly defined trend transitions. This zone has served as structural support during expansion phases, a breakout base during the run toward all-time highs, and later as a liquidity pool during corrective cycles. Every major deviation from this line has led to a significant move in the opposite direction, making this retest highly meaningful. Earlier in the chart, support broke and produced a full liquidity sweep, clearing long-position stop clusters before price reclaimed the level and initiated a multi-month advance. The presence of an order block just above this zone adds additional structure: it acted as a redistribution area during the breakdown, and later as the origin of re-accumulation. The recent taps into this region suggest the market is again probing for resting liquidity and responsive buy orders. Price is now compressing between HTF support and declining 50/100 EMAs, creating a classic higher-timeframe squeeze. EMAs continue to slope downward, signaling a bearish macro trend, but candles remain supported at the long-term horizontal level. This type of compression typically resolves with a decisive expansion once liquidity is absorbed from one side. The FVG Reaction Zone earlier in the trend shows how SOL tends to return to inefficiencies before choosing direction. The current circled region may represent the same behavior on a larger scale — an attempt to rebalance price before either reclaiming the EMAs or continuing displacement lower. Momentum indicators add another layer: Stoch RSI is turning upward from deeply oversold territory, suggesting momentum exhaustion on the downside but not yet confirming a trend reversal. Historically on this timeframe, these rotations have preceded multi-week expansions when aligned with structural reclaim, but have also failed when EMAs continued to reject price. Overall, SOL is positioned at a pivotal HTF decision point: Hold support → potential base formation and EMA reclaim attempts Lose support → opens the door to a fresh liquidity sweep into prior structural lows Until a break in structure or EMA reclaim occurs, this remains a compression zone with elevated importance for trend continuation or reversal.
Quant_Trading_Pro
DOGE 30M – MACD Liquidity Tracker Trend Flip in Action
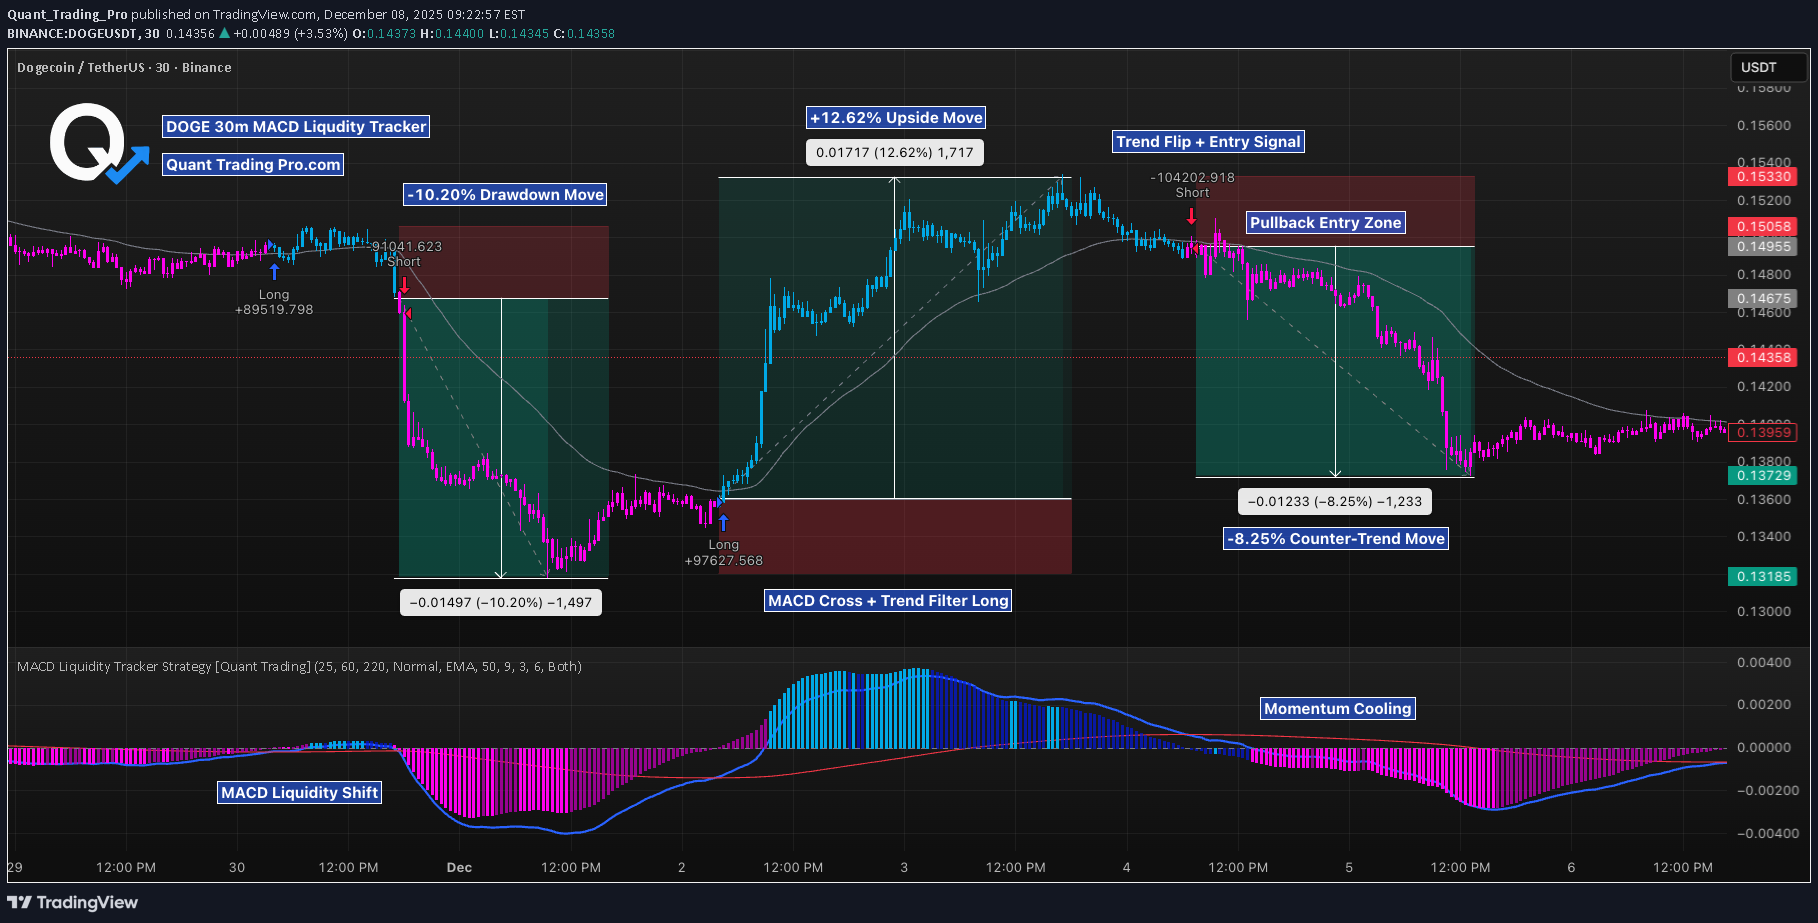
This 30M chart shows how the MACD Liquidity Tracker Strategy behaves during clear trend rotations. The first shift came after a strong liquidity flip on MACD, followed by alignment with the EMA trend filters. That combination produced a clean long signal and a full trend rotation before momentum began to fade. The second sequence shows the opposite: a pullback entry formed while momentum was already weakening, leading into a counter-trend move as EMAs rolled over and MACD histogram compressed. This contrast highlights how the strategy performs best when MACD expansion and trend filters sync, and becomes less reliable during momentum decay. The settings used here were selected through automated backtesting, where multiple MACD lengths and EMA filters were tested to identify combinations that maintained trend clarity and avoided excess chop. The final set reflected the strongest balance between early momentum detection and false-signal reduction. Backtested Settings: MACD: 25 / 60 / 220 Signal: 9 EMA Filters: 50 & 100 Mode: Normal Trend Filter: On Entry Type: Long + Short enabled Price is now consolidating under the EMAs while MACD momentum cools. A new trend signal requires a higher low and fresh MACD expansion; otherwise, short-term chop remains likely.
Quant_Trading_Pro
آیا سولانا (SOL) در آستانه بازگشت تاریخی است؟ تحلیل حمایتها و سطوح کلیدی
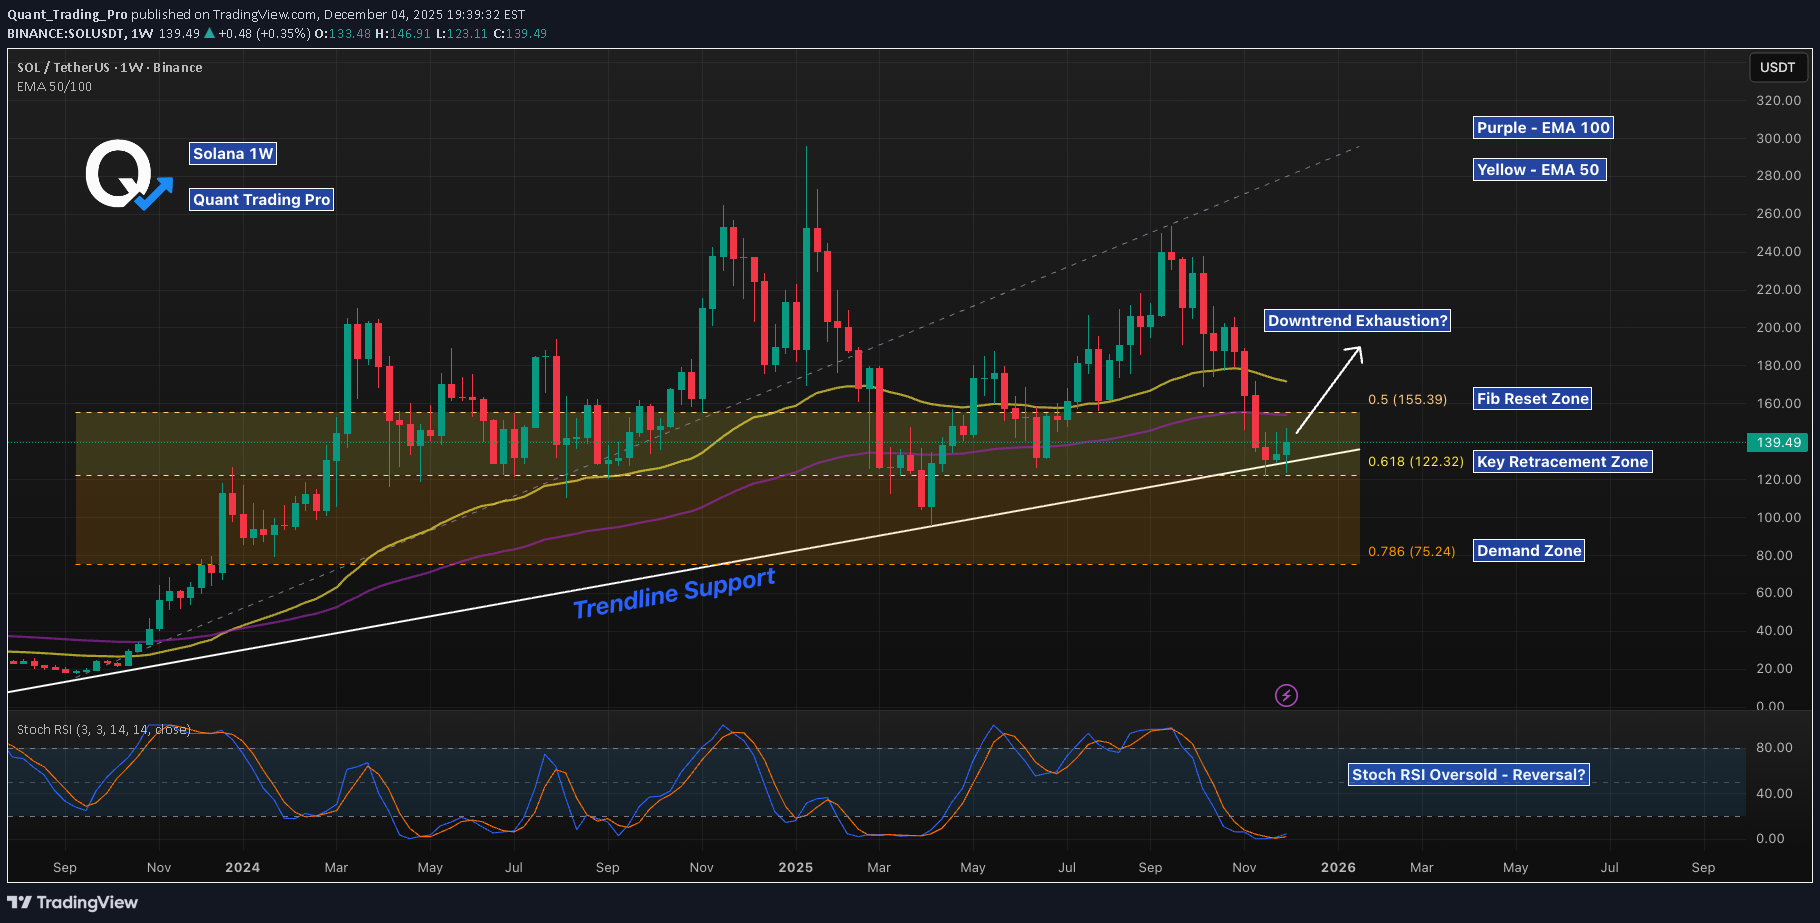
SOL has reached a major confluence area on the weekly chart, tagging the broader Fib Reset Zone and reacting directly from long-term Trendline Support. This is the same structural level that launched previous multi-month rallies, making this an important point for potential reversal. Price is also sitting just above the 0.618 retracement — historically one of SOL's strongest reaction levels — while the weekly Stoch RSI is emerging from oversold conditions, a signal often seen near macro turning points. The declining 50/100 EMAs still create overhead pressure, but reclaiming these EMAs would confirm a shift in weekly trend structure and open the door for a broader recovery leg. If the trendline fails, the lower demand zone becomes the next logical retest. But as long as SOL continues to defend this diagonal and build higher closes inside the Fib Reset Zone, the case for reversing the multi-month downtrend strengthens. This is one of the most important weekly levels SOL has approached all year.
Quant_Trading_Pro
اتریوم در آستانه تغییر روند؟ پر شدن شکاف قیمت و لمس حمایت؛ آیا برگشت آغاز شده است؟
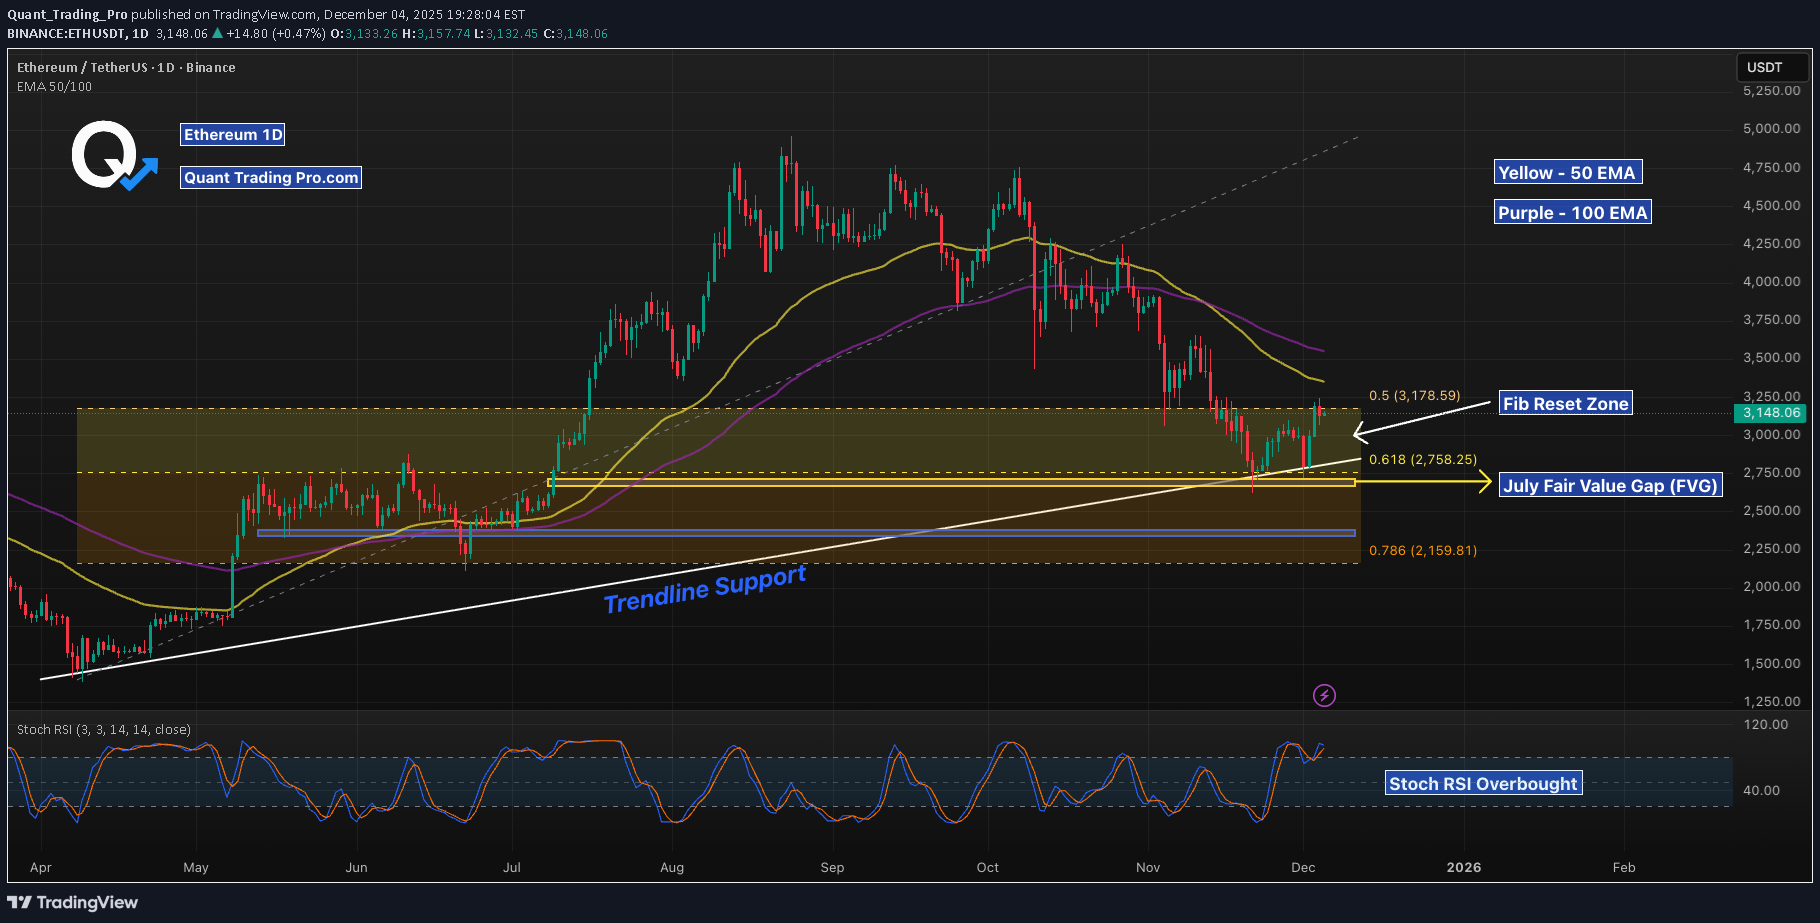
ETH may finally be showing signs of downtrend exhaustion. Price has tapped the Fib Reset Zone, filled the July Fair Value Gap, and bounced cleanly from long-term Trendline Support — a combination that often marks the end of corrective phases. The declining 50 and 100 EMAs still act as dynamic resistance overhead, but the market is now pressing into them with higher momentum. Reclaiming these EMAs would be the clearest structural shift signaling that the downtrend may be ending. If ETH loses trendline support, the demand zone below becomes the next logical retest. But as long as price remains above the diagonal and continues building higher lows inside this reset structure, the probability of a reversal increases. Stoch RSI remains overbought, so short-term cooling is possible — but structurally, ETH is completing all the ingredients needed for trend reversal: FVG filled, retracement satisfied, and support holding.
Quant_Trading_Pro
دوج کوین (DOGE) در خطر سقوط؟ سطوح کلیدی حمایت و مقاومت کجاست؟
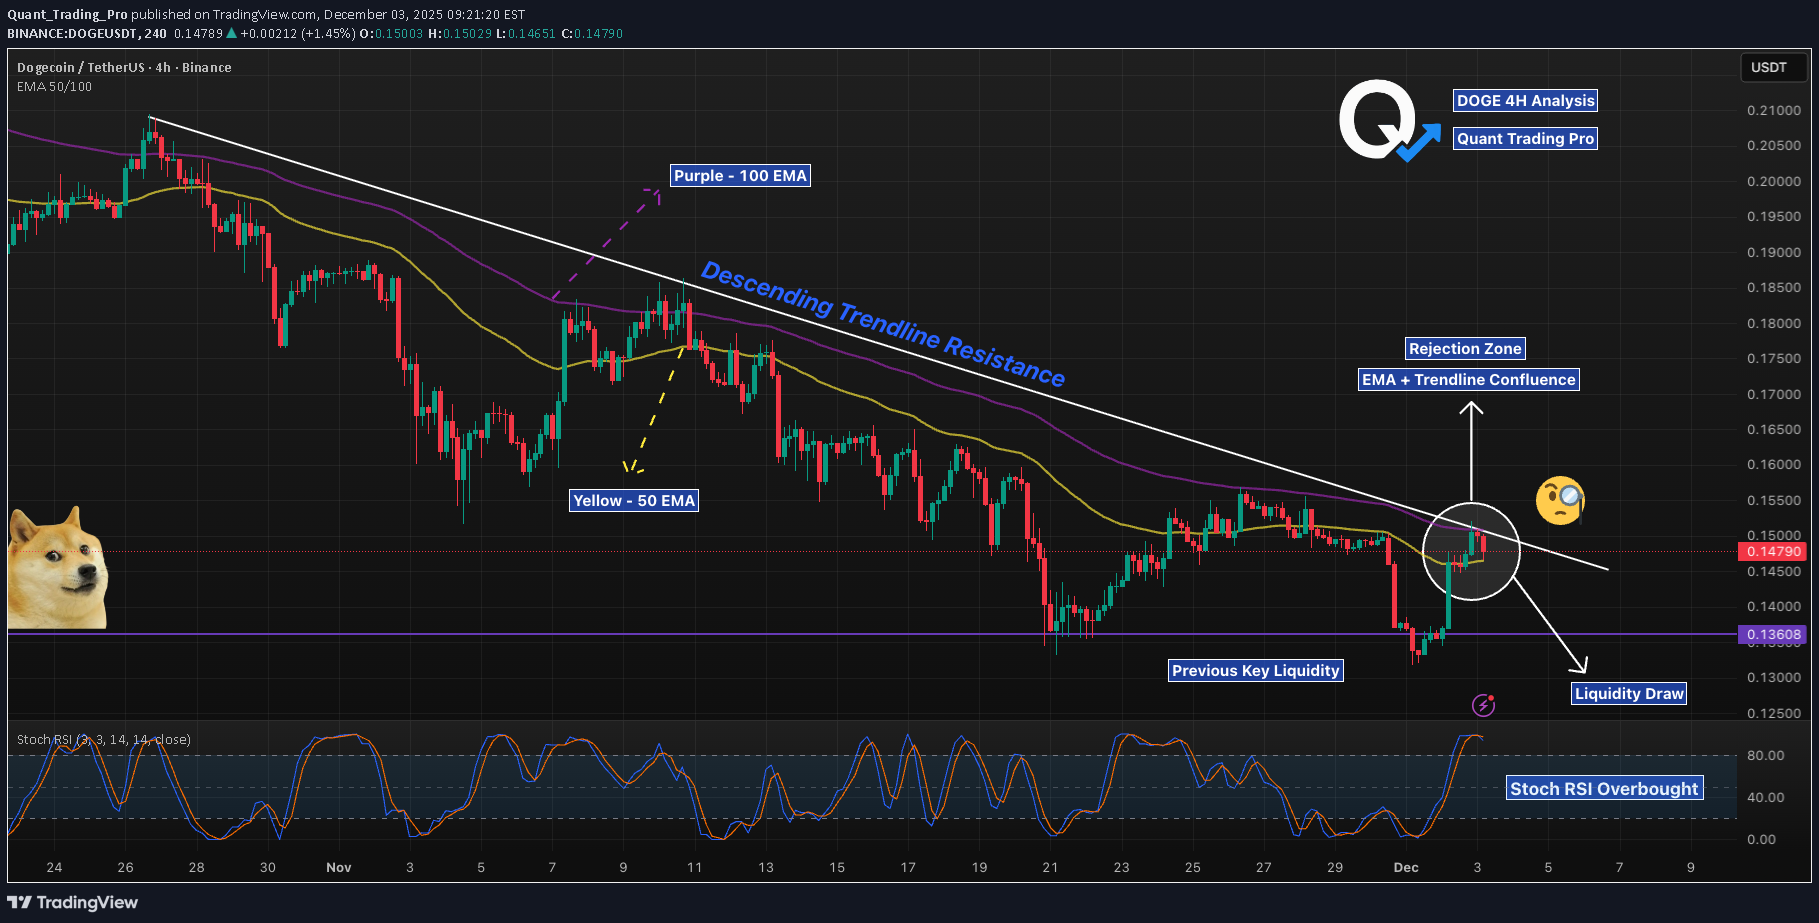
DOGE is reacting cleanly to a multi-factor resistance cluster: the descending trendline, the 50 EMA, and the 100 EMA all converge at the same price level. This area has rejected every retest during the downtrend, and today’s wick into the circle shows the same behavior. Stoch RSI is extended into overbought territory, adding momentum exhaustion to the setup. Below, the $0.136 level remains the key liquidity draw from previous lows — and price has not fully tapped into that zone since the last sweep. For bulls to regain control, DOGE must break and hold above the EMA cluster and trendline. Until then, the structure favors a continuation move toward lower liquidity levels.
Quant_Trading_Pro
سولانا در آستانه سقوط؟ منطقه حساس قیمتی و هدف بعدی نقدینگی کجاست؟
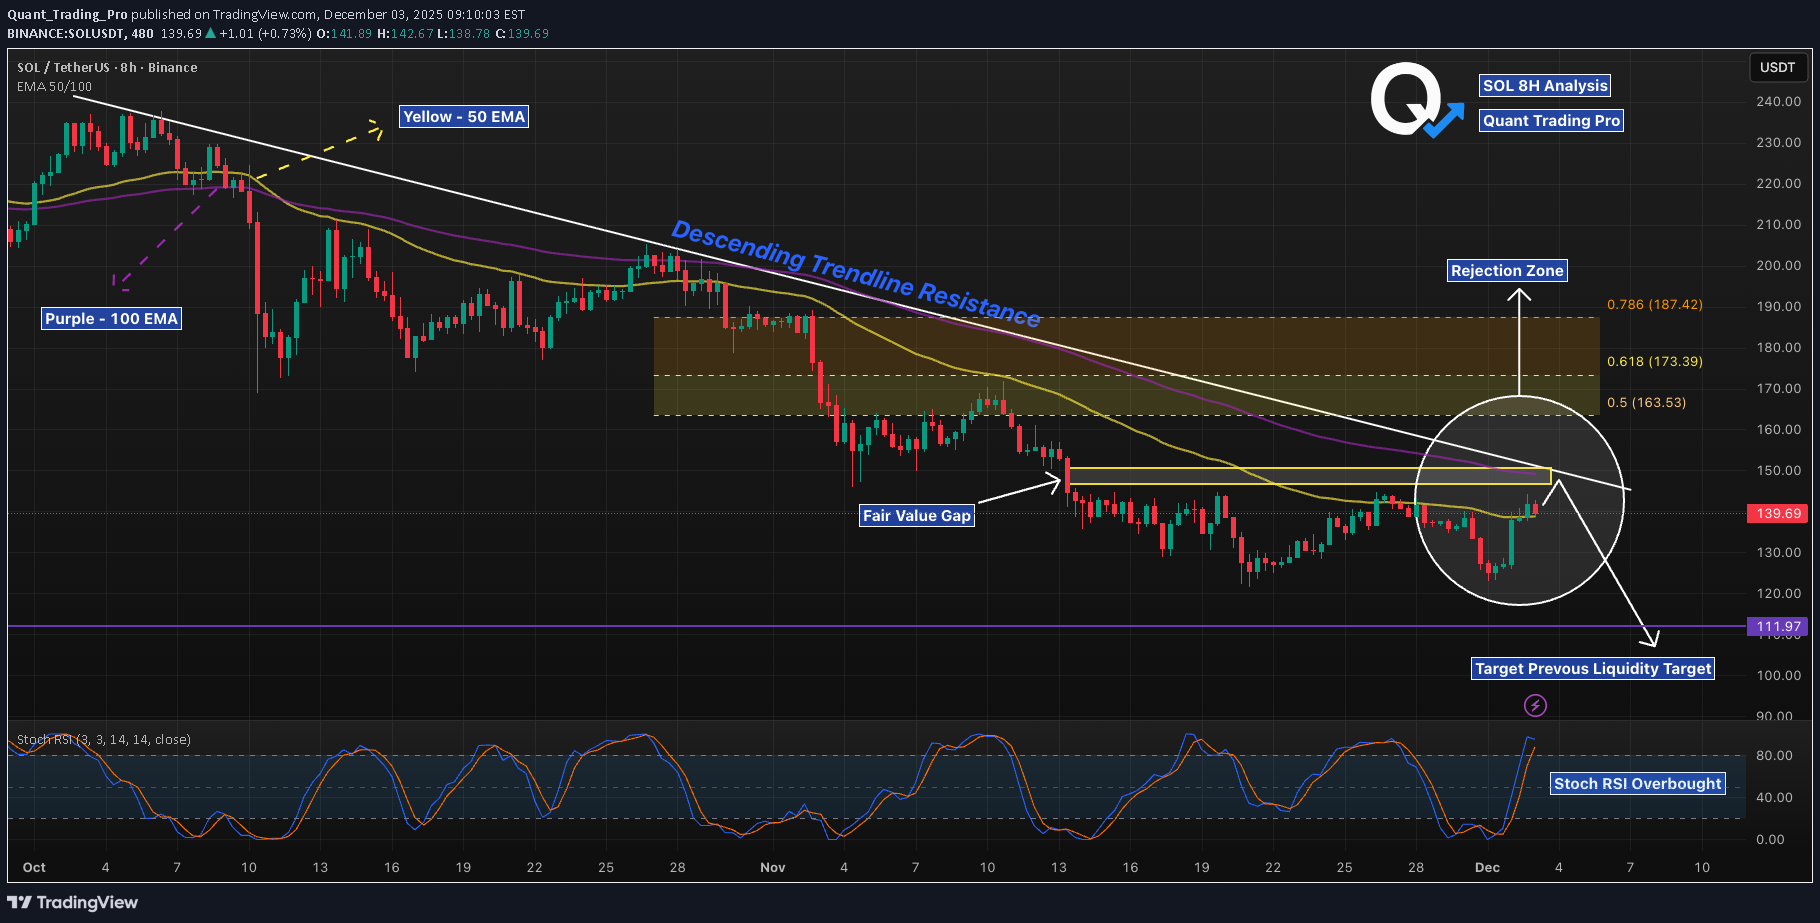
SOL has tapped a clean multi-confluence rejection zone: the descending trendline, the 50/100 EMA cluster, and a filled Fair Value Gap all stack at the same price level. This area has acted as a strong pivot throughout November, and today’s reaction is consistent with prior trendline rejections. The Stoch RSI is already in overbought territory on the 8H, adding momentum exhaustion to the setup. Bears will watch for continuation toward the major liquidity level around $111.97, which remains untested below. For bulls to regain control, price must break and hold above the EMA cluster and FVG, flipping the trendline into support. Until then, the path of least resistance remains down toward liquidity.
Disclaimer
Any content and materials included in Sahmeto's website and official communication channels are a compilation of personal opinions and analyses and are not binding. They do not constitute any recommendation for buying, selling, entering or exiting the stock market and cryptocurrency market. Also, all news and analyses included in the website and channels are merely republished information from official and unofficial domestic and foreign sources, and it is obvious that users of the said content are responsible for following up and ensuring the authenticity and accuracy of the materials. Therefore, while disclaiming responsibility, it is declared that the responsibility for any decision-making, action, and potential profit and loss in the capital market and cryptocurrency market lies with the trader.