Technical analysis by Quant_Trading_Pro about Symbol SOL on 12/5/2025

آیا سولانا (SOL) در آستانه بازگشت تاریخی است؟ تحلیل حمایتها و سطوح کلیدی
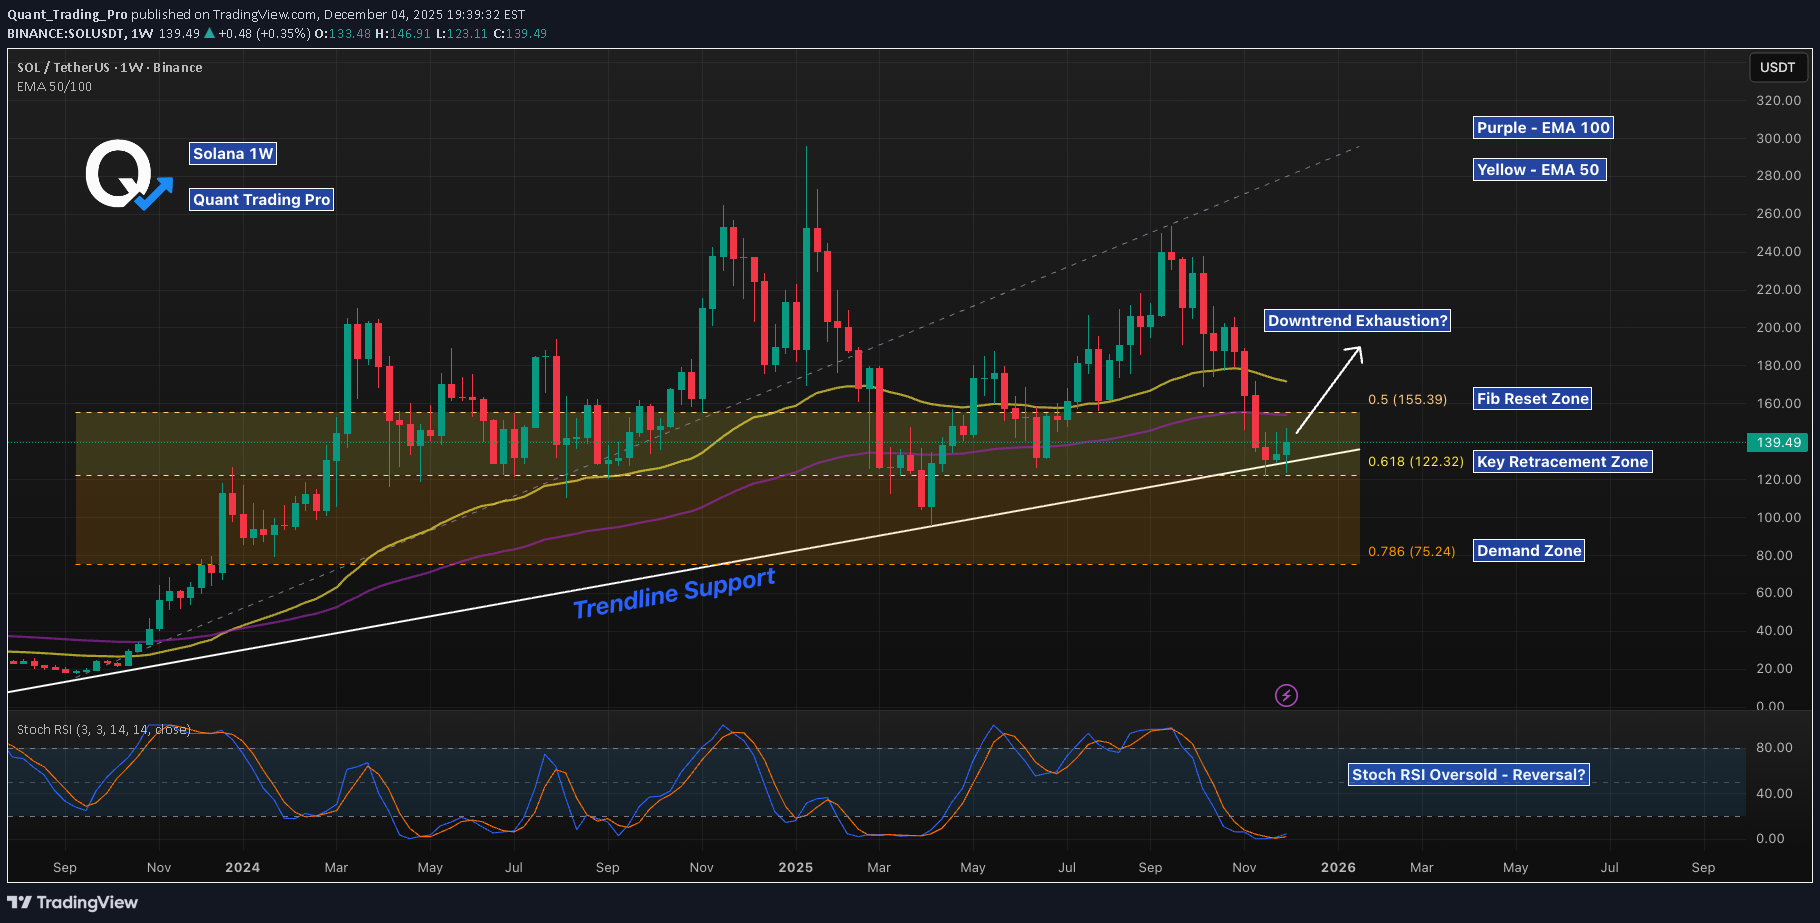
SOL has reached a major confluence area on the weekly chart, tagging the broader Fib Reset Zone and reacting directly from long-term Trendline Support. This is the same structural level that launched previous multi-month rallies, making this an important point for potential reversal. Price is also sitting just above the 0.618 retracement — historically one of SOL's strongest reaction levels — while the weekly Stoch RSI is emerging from oversold conditions, a signal often seen near macro turning points. The declining 50/100 EMAs still create overhead pressure, but reclaiming these EMAs would confirm a shift in weekly trend structure and open the door for a broader recovery leg. If the trendline fails, the lower demand zone becomes the next logical retest. But as long as SOL continues to defend this diagonal and build higher closes inside the Fib Reset Zone, the case for reversing the multi-month downtrend strengthens. This is one of the most important weekly levels SOL has approached all year.