
PingTechAcademy
@t_PingTechAcademy

What symbols does the trader recommend buying?
Purchase History
پیام های تریدر
Filter
PingTechAcademy
فرصت طلایی خرید VET: آیا تاریخ تکرار میشود؟ (تحلیل حمایت حیاتی 2020)
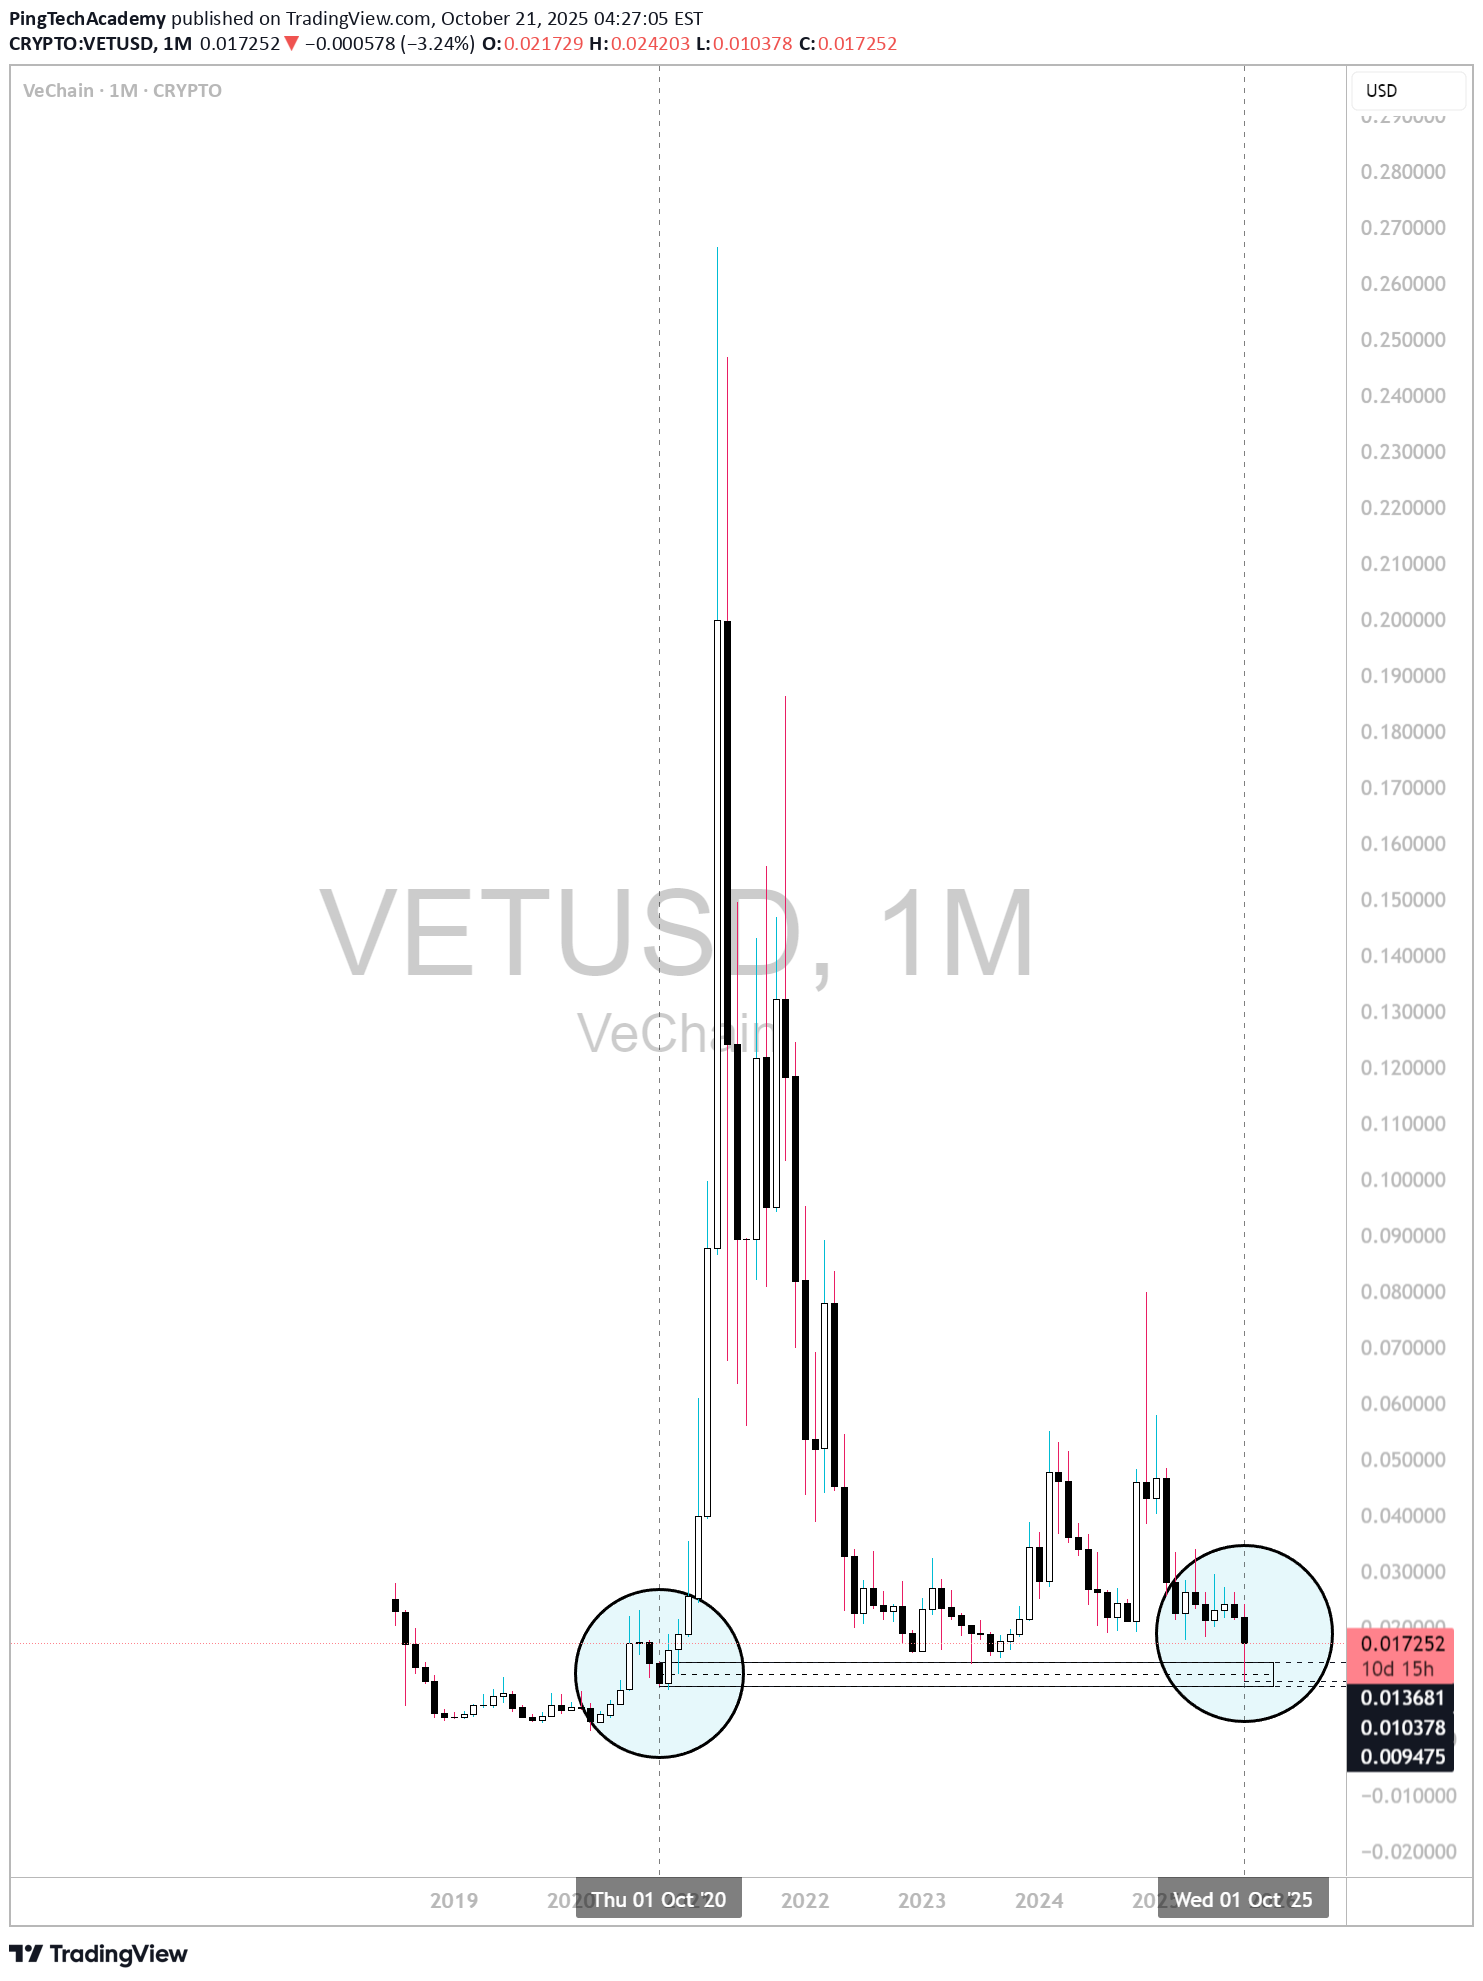
## **VeChain (VET/USD) — Macro Structural Analysis | Monthly Outlook** ### 🧭 **Market Context** As of **October 2025**, VeChain (VET) has returned to the **same macro demand zone** that formed in **October 2020**, the foundation of its previous bull cycle. The **flash crash this month** brought the price down to a historical accumulation level between **$0.009 – $0.013**, creating a structural mirror of the early 2020 setup before the 2021 rally. This move suggests that VET is now testing a **critical long-term support**, aligning with the broader market phase where altcoins typically consolidate before a new expansion cycle. --- ### 📊 **Technical Structure** * **Support Zone:** $0.009 – $0.013 * **Resistance Range:** $0.035 – $0.050 * **Macro Invalidation:** Monthly close below $0.009 The current monthly candle shows **a deep wick and strong price rejection**, signaling possible *liquidity absorption* at the lows. Maintaining this structural base above **$0.013** could confirm a **macro bottom formation**, with potential continuation toward **$0.05 – $0.07** during **Q2–Q3 2026**, particularly if **Bitcoin dominance** begins to decline as projected. --- ### 🪙 **Fundamental Overview** VeChain remains one of the leading **enterprise-focused Layer-1 blockchains**, providing real-world solutions in **supply chain management, logistics, and carbon tracking**. * **Market Cap:** ≈ $1.25B * **Circulating Supply:** ≈ 72.5B VET * **On-Chain Metrics:** Stabilizing activity and rising VTHO consumption indicate renewed network usage. This fundamental resilience supports the idea that VeChain could be entering a **re-accumulation phase**, mirroring the 2020–2021 structural rhythm. --- ### 🔭 **Outlook** If this historical symmetry continues, VeChain could remain within a **sideways accumulation structure** until **April 2026**, before initiating a new bullish expansion phase. A confirmed break above **$0.035** would likely mark the first signal of structural recovery across the altcoin sector. --- ### ⚠️ **Disclaimer** This analysis is for **educational and informational purposes only** and does **not constitute financial advice**. All opinions represent my **personal market perspective** and may change without notice. Trading cryptocurrencies involves **significant risk**, and investors should perform their own research or consult a licensed financial advisor before making decisions.
PingTechAcademy
پایان 50 ساله طلا: آیا قیمت طلای جهانی به سقف تاریخی رسید؟

🟡 Gold Macro Structure — The End of a 50-Year Bullish Epoch Symbol: XAU/USD (OANDA Data) Timeframe: 1M (Monthly Candles) Published by: Ping Tech Academy 🕰️ The Story of Gold — Between Faith, Fear, and Cycles Gold has never been just a commodity — it is the mirror of human belief in value. When trust in fiat weakens, gold rises; when confidence returns, it retreats. Since the dollar was detached from gold in December 1971, every cycle has reflected the rhythm of fear and faith across the global economy. Now, after more than half a century of expansion, gold stands at what appears to be the final chapter of its generational bull cycle. 🔹 Historical Context (1971–2009) From December 1st, 1971, gold traded within a long-term ascending channel, with its lower boundary near $43.50 and its upper boundary reaching around $1,195.40. That upper structure was broken and retested on November 2nd, 2009, marking the beginning of a new macro bullish channel that defined the modern era of gold movement. 🔹 The Second Channel (2005–2024) The base of the current macro structure was established on July 1st, 2005, at $417.90, while its top expanded to around $2,663.50, reached on September 2nd, 2024. This high was broken and retested — a textbook continuation signal — leading gold to its recent peak near $4,165 (October 2025). ⚠️ Critical Resistance Zone — Structural Completion Based on price symmetry and long-term channel geometry, gold has reached its final structural target of the 50-year ascending cycle: 📍 $4,166.66 (OANDA XAU/USD) Allowing for a technical deviation, the potential reversal range stands between: 📉 $4,166.66 – $4,294.43 This area represents a major exhaustion zone, likely to act as the macro top of the cycle before a multi-year correction begins. 🧭 Long-Term Downside Targets (Macro Correction Path) If the market confirms rejection within the 4.16–4.29k range, the following structural targets may unfold sequentially: $3,940 $3,730 $3,415 $3,072 $2,791 → Key Level $2,535 → Critical Foundation Zone 🔹 This region is viewed as the potential final structural base for gold — a level where a new long-term accumulation phase could begin. However, breaking below $2,535 would indicate the start of a deep macro revaluation, potentially driving gold to unexpectedly low levels, but such a move would likely require a period of global economic stability and geopolitical peace — a rare alignment that historically marks the end of systemic fear cycles. $2,438 $2,227 $2,089 → Final macro target if bearish continuation persists 🧠 Market Psychology & Cyclic Behavior Each gold supercycle follows a familiar psychological rhythm: Accumulation (Smart Money Phase): Institutions accumulate quietly when sentiment is exhausted and prices are undervalued. Expansion (Public Awareness): Momentum builds; narratives like inflation, rate cuts, or war become surface-level catalysts. Euphoria (Public Participation): Retail investors flood in at new highs, while institutions distribute positions into strength. Distribution → Correction: Price weakens, volatility expands, optimism fades — the new cycle begins where fear returns. Gold currently displays late-euphoria characteristics, suggesting the distribution phase of the macro cycle is well underway. 🧩 Conclusion Gold appears to be completing a 50-year structural expansion that began in 1971 — a cycle that reshaped global perceptions of value. While minor overshoots beyond $4,294 remain possible, the risk-to-reward profile now favors defensive or profit-taking strategies. A multi-year corrective phase is expected before a new generational accumulation begins. ⚖️ Disclaimer This analysis is provided for educational and informational purposes only and does not constitute financial or investment advice. All price levels and projections are based on historical modeling and macro-technical analysis. Financial markets involve risk — past performance does not guarantee future results. Always conduct independent analysis or consult a licensed professional before making investment decisions. 📘 Ping Tech Academy “Trade Smart. Trade Fearless.” © 2025 – All Rights Reserved.
PingTechAcademy
پایان 50 سال طلایی؟ اوج تاریخی طلا در این نقطه است!
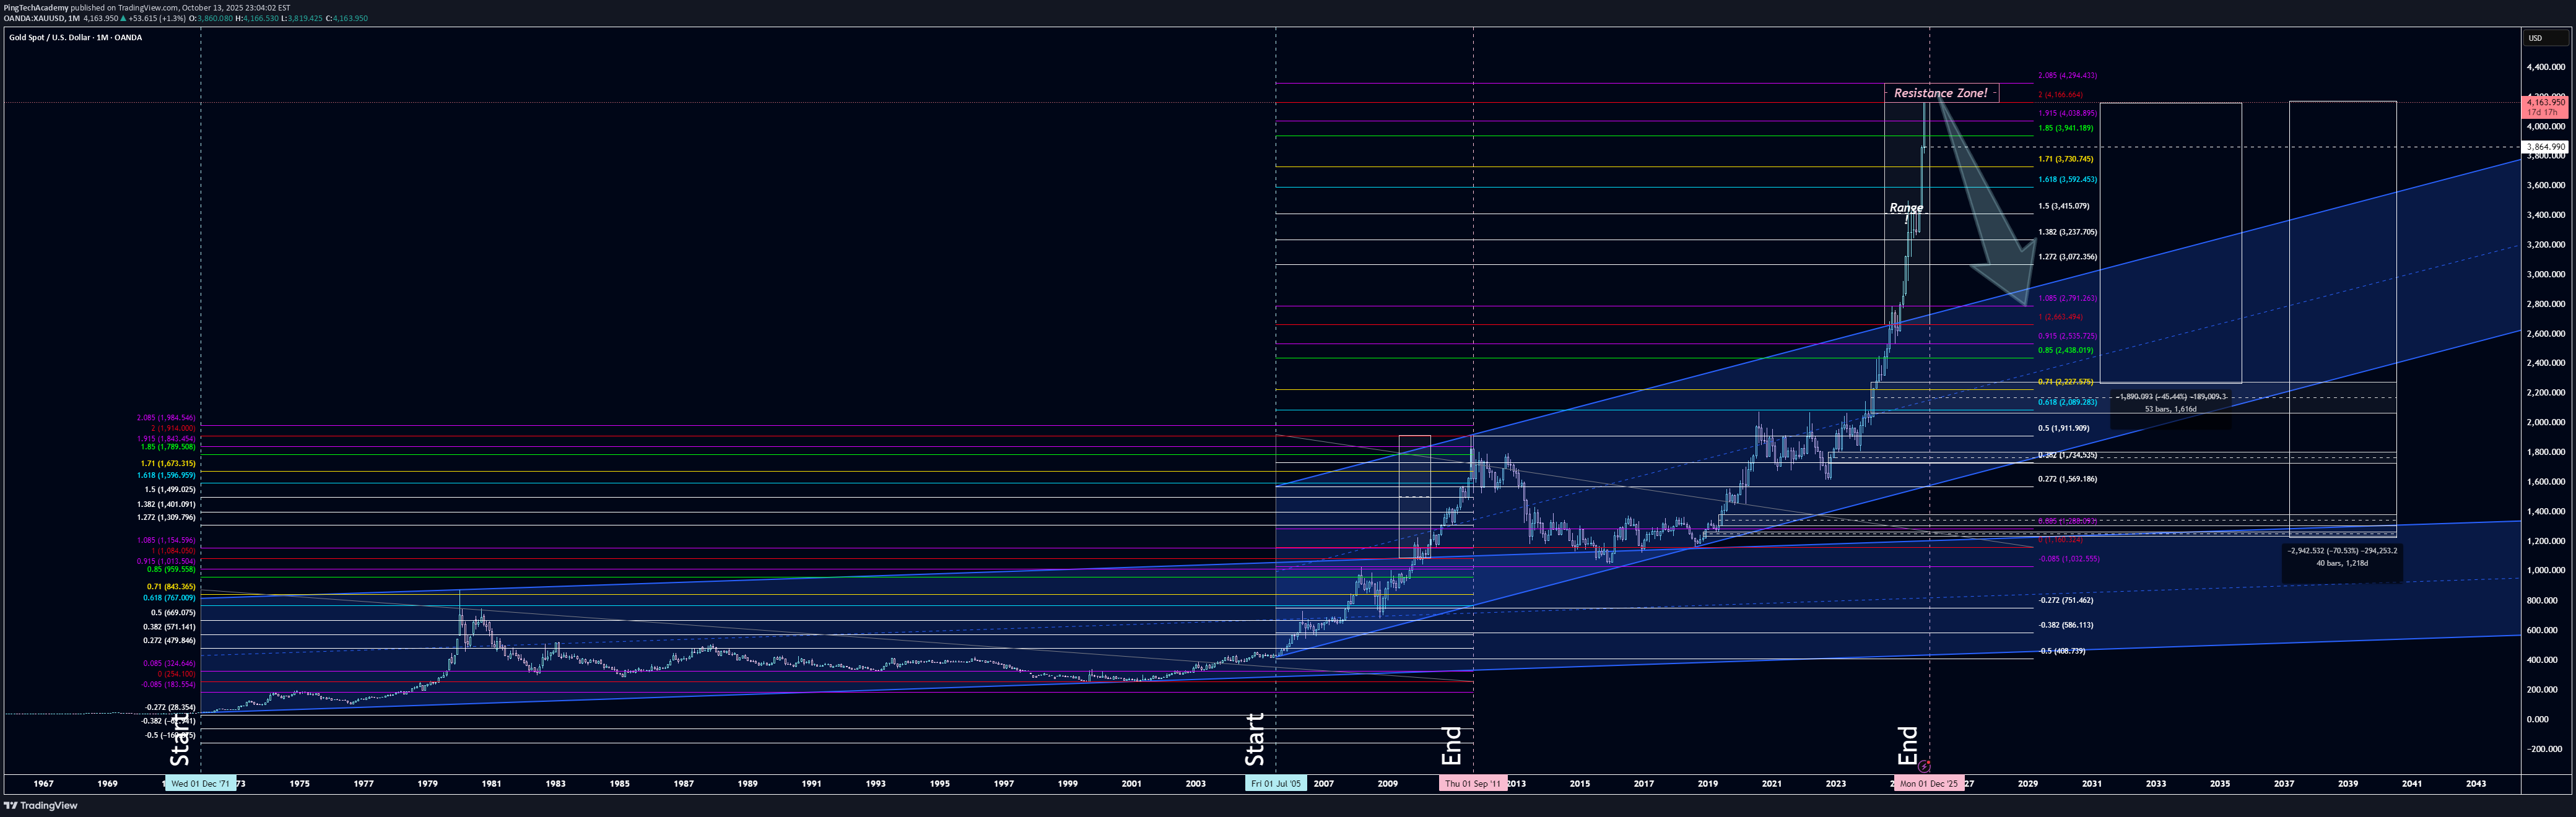
🟡 Gold Macro Structure — The End of a 50-Year Bullish Epoch Symbol: XAU/USD (OANDA Data) Timeframe: 1M (Monthly Candles) Published by: Ping Tech Academy 🕰️ The Story of Gold — Faith, Fear, and Cycles Gold has always been more than a commodity — it’s the mirror of human belief. When trust in paper fades, gold rises. When euphoria returns, gold retreats. Since the U.S. dollar detached from gold in December 1971, every major swing has reflected the balance between fear and faith. Today, after more than five decades, gold may be reaching the final chapter of its generational bull cycle. 🔹 Historical Structure (1971–2009) From December 1st, 1971, gold has moved within a long-term ascending price channel, anchored between $43.50 (bottom) and $1,195.40 (top). That upper boundary was broken and retested on November 2nd, 2009, marking the transition into a new bullish macro channel — the one that has guided us for the past 16 years. 🔹 The Second Channel (2005–2024) The base of this channel formed on July 1st, 2005, at $417.90, while its upper boundary expanded to around $2,663.50, reached on September 2nd, 2024. This level was broken and retested — a classical continuation signal — and from there, gold surged into the $4,165 region (October 2025). ⚠️ Critical Zone: The Completion of the Macro Channel According to price behavior symmetry and channel geometry, gold has now fulfilled the structural target of its multi-decade bullish channel: 📍 $4,166.66 (OANDA XAU/USD) Accounting for margin of deviation, the potential final resistance zone is estimated between: 📉 $4,166.66 – $4,294.43 This area is expected to represent the macro peak of this cycle, after which a multi-year corrective phase could begin. 🧭 Projected Downside Path (Long-Term Correction Targets) If price confirms rejection within this resistance cluster, these levels are projected as sequential macro targets: $3,940 $3,730 $3,415 $3,072 $2,791 → Key Structural Level Breaking below $2,791 could unlock the next leg toward: • $2,438 • $2,227 • $2,089 → Final Macro Target 🧠 Market Psychology & Cyclic Behavior Every gold supercycle follows a rhythm of human emotion and institutional logic: Accumulation (Smart Money Phase): Institutions buy quietly when the world stops caring — at undervalued extremes. Expansion & Public Awareness: The trend becomes “obvious,” and narratives such as inflation, rate cuts, or war become convenient justifications. Euphoria (Public Participation): Retail capital floods in at all-time highs. Media coverage peaks. Institutions distribute into optimism, slowly unloading into retail demand. Distribution → Correction: Price action weakens, volatility expands, and the illusion of “new paradigms” fades. Fear replaces greed — and the cycle resets. Gold is currently showing late-euphoria behavior on the monthly timeframe — the classic footprint of a distribution phase in motion. 🧩 Conclusion Gold may be closing the final leg of a 50-year macro expansion, completing a structure that began in 1971 — an era that redefined global value systems. While an overshoot beyond $4,294 remains possible, the reward-to-risk profile now shifts decisively toward defensive positioning. This could mark the beginning of a generational correction before a new cycle of accumulation emerges. ⚖️ Disclaimer This analysis is for educational and informational purposes only and does not constitute financial advice. All projections are derived from long-term historical modeling and price structure analysis. Financial markets carry risk; always perform your own research or consult a licensed advisor before making investment decisions. 📘 Ping Tech Academy “Trade Smart. Trade Fearless.” © 2025 – All Rights Reserved.
Disclaimer
Any content and materials included in Sahmeto's website and official communication channels are a compilation of personal opinions and analyses and are not binding. They do not constitute any recommendation for buying, selling, entering or exiting the stock market and cryptocurrency market. Also, all news and analyses included in the website and channels are merely republished information from official and unofficial domestic and foreign sources, and it is obvious that users of the said content are responsible for following up and ensuring the authenticity and accuracy of the materials. Therefore, while disclaiming responsibility, it is declared that the responsibility for any decision-making, action, and potential profit and loss in the capital market and cryptocurrency market lies with the trader.