Phemex
@t_Phemex

What symbols does the trader recommend buying?
Purchase History
پیام های تریدر
Filter
Phemex
تحلیل TRUMP: آیا رالی قدرتمند ادامه دارد یا منتظر استراحت هستیم؟
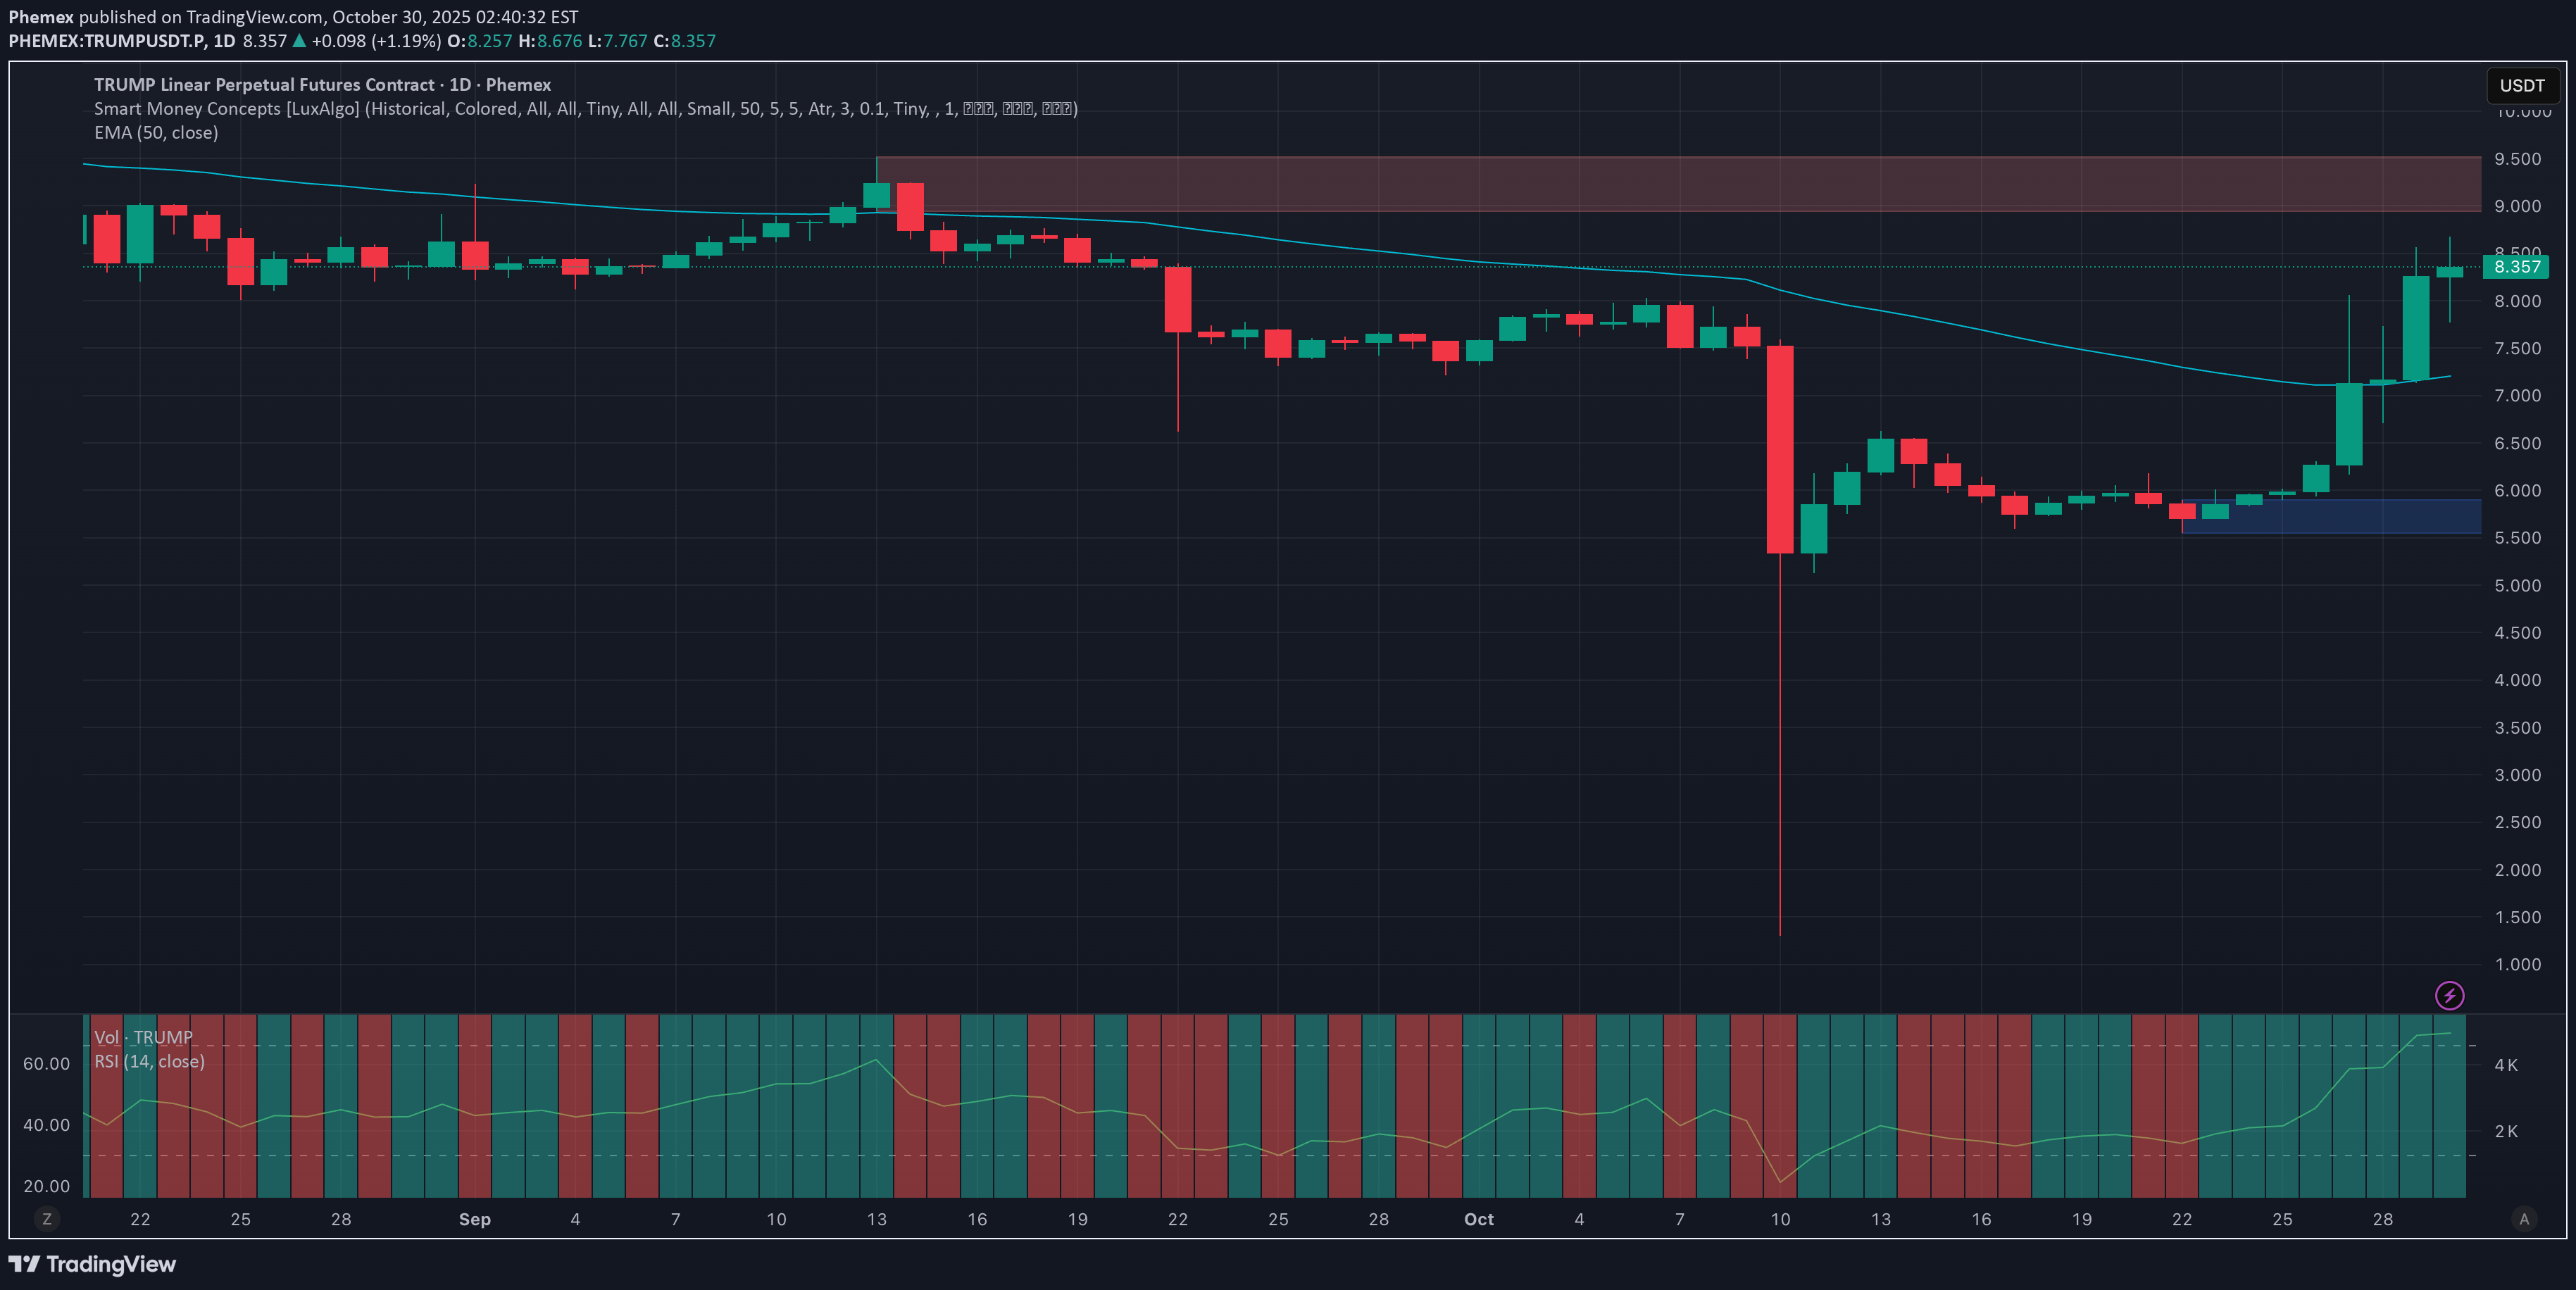
Since Monday, TRUMP has been grinding higher from the mid-$7s, shaking out late shorts and building momentum into Thursday. Spot participation improved, funding cooled, and the tape now reads “accumulation with intent,” not a one-off spike. The real question: does this push have enough fuel to clear the next band of resistance, or do we need a reset before the next leg? Possible Scenarios 1) Momentum Extension — Break and Run After a strong run so far this week, price continues to stair-step higher. A decisive break-and-hold above $8.40 puts the next supply zones in play at $8.80 and $9.50; if momentum persists, $11.90 is the stretch target. Pro Tips: Entry: Wait for a clean break-and-hold above $8.80 on rising volume; avoid front-running wicks. Risk: Initial stop just below the recent low (e.g., $8.40). Exits: Scale profits into $11.90, leave a runner toward $14.70 with a trailing stop. 2) Cool-Off & Coil — Range Before the Next Move After this fabulous run since Monday, TRUMP cools into a $7.20–$8.80 box. Volatility compresses, open interest normalizes, and the market builds energy for the next decisive push. Pro Tips: Plan the box: Accumulate closer to $7.20–$7.60; trim exposure into $8.60–$8.80. Grid-friendly: A light long-grid near the lower third can harvest chop while you wait for a breakout cue. Break tells: A volume expansion at the range edge often telegraphs direction—react, don’t predict. 3) Giveback & Reset — Bears Take a Swing If momentum stalls and price loses $7.00 on strong sell volume, the path opens to $6.00–$5.00 (psychological) and, in a sharper risk-off, $4.00. That would convert this week’s move into a lower-high failure. Pro Tips: Defense first: Cut risk on a daily close below $7.00; don’t fight a heavy tape. Buy-the-dip only with signals: Look for stabilization (shrinking candles, waning sell volume, higher-low attempts) before scaling bids at $6.00–$5.00. Flip criteria: A strong reclaim of the lost level with follow-through breadth. Conclusion TRUMP has delivered an impressive week so far—enough to earn the benefit of the doubt if it can convert momentum into structure. Trade the if/then map: press strength through $8.80, play the box while it coils, and respect the downside if $7.00 snaps. Let the levels—and only the levels—decide the story’s next chapter. 🔥 Tips: Armed Your Trading Arsenal with advanced tools like multiple watchlists, basket orders, and real-time strategy adjustments at Phemex. Our USDT-based scaled orders give you precise control over your risk, while iceberg orders provide stealthy execution. Disclaimer: This is NOT financial or investment advice. Please conduct your own research (DYOR). Phemex is not responsible, directly or indirectly, for any damage or loss incurred or claimed to be caused by or in association with the use of or reliance on any content, goods, or services mentioned in this article.
Phemex
تحلیل بیت کوین پس از سقوط تاریخی: سه مسیر پیش روی BTC!

Last Friday—October 10, 2025— BTCUSDT.P endured a historic flush. In a matter of hours, price slipped from the low-$120Ks into the low-$100Ks as leverage unwound across venues. It looked dramatic, but the post-mortem reads more like a broad‐based deleveraging than a structural failure. Since then, BTC has steadied around the low–$110Ks, with intraday swings as traders slowly rebuild risk. Context in one breath. A late-week macro wobble hit an over-levered market. Forced sellers did the rest. By mid-week, the tone shifted from “spiraling” to “stabilizing” as the market defended the $110K region and funding normalized. Possible Paths From Here 1) Reclaim & Run — rebuild above $115K → $120–$123K retest After flushing weak longs, BTC grinds higher, then reclaims $115K on improving spot demand. A strong daily close above $118K invites a retest of the $120–$123K band (pre-flush supply). A clean break there opens room toward $128–$130K. Pro Tips: Entry: Stagger in on a daily close > $115K; add on a confirmed reclaim of $118–$120K. Risk: Initial stop below the reclaim zone (~$110.5K), then trail beneath higher lows. Targets: $120–$123K first; if momentum broadens, stalk $128–$130K. 2) Chop & Rebuild — base between $108–$116K The market digests the shock. BTC ranges $108–$116K, volatility compresses, open interest stays sober, and spot quietly absorbs supply. This is where patience—not prediction—wins. Pro Tips: Plan the box: Accumulate near $108–$110K, trim near $115–$116K; avoid mid-range chop. Volume tells: Expansion at range edges often telegraphs the break direction. Tools: Consider light grid/range tactics with clear invalidation below $108K. 3) Second-Leg Flush — lose $110K → $105K, even $100–$102K If headlines sour or liquidity thins and BTC closes below $110K on heavy sell volume, $105K (prior liquidity pocket) is exposed. A disorderly tape can sweep toward $102–$100K before bargain hunters step in. Pro Tips: Defense first: Reduce exposure on a decisive daily close < $110K. Wait for stabilization: Look for capitulation wicks + waning sell volume before redeploying near $105K / $102–$100K. Flip criteria: A strong reclaim of $110–$112K with breadth is your cue to re-engage. Conclusion If BTC reclaims $115K and $118–$120K holds → ride the trend toward $123K, then $128–$130K. If we range $108–$116K → harvest the box with tight risk. If $110K snaps on heavy sell volume → stand aside and let $105K → $102–$100K stabilize. Trade the levels. Respect the tape. Let structure—not the memory of the flush—drive your decisions. 🔥 Tips: Armed Your Trading Arsenal with advanced tools like multiple watchlists, basket orders, and real-time strategy adjustments at Phemex. Our USDT-based scaled orders give you precise control over your risk, while iceberg orders provide stealthy execution. Disclaimer: This is NOT financial or investment advice. Please conduct your own research (DYOR). Phemex is not responsible, directly or indirectly, for any damage or loss incurred or claimed to be caused by or in association with the use of or reliance on any content, goods, or services mentioned in this article.
Phemex
تحلیل پمکس: آیا قیمت زِدکش (ZEC) به ۳۰۰ دلار میرسد؟ سناریوهای صعودی و نزولی

In a matter of weeks, ZECUSDT.P ripped from the double-digits into the mid-$200s, putting privacy coins squarely back in focus. As of now, ZEC hovers near $245–$260, with an intraday range that’s stretched as high as the upper-$270s—the kind of wide tape that rewards disciplined plans and punishes hesitation. With momentum heated and volatility elevated, here’s a clear if/then map for the next leg. Possible Scenarios 1) Bullish Continuation — squeeze through the high-$260s, eyes on $277 → $300 What to watch: A decisive push back through $260–$270 with rising volume. That reclaims the top of today’s range and puts the $277 spike back in play; above there, round-number gravity favors a $300 test. Pro Tips: Entry: Add on a strong 1H/4H close > $268–$270, or a break-and-retest that holds. Risk: Initial stop just below the reclaimed zone (e.g., $255–$258). Targets: $277 (recent peak), then stagger into $295–$305 if momentum persists. 2) Retest & Accumulation — cool off into $210–$230, rebuild for another run What to watch: A controlled pullback (shrinking candles, softer volume) into $230 or as deep as $210–$215. This lets funding reset and late longs get flushed without breaking market structure. Pro Tips: Entry: Scale bids near $230 → $215 only if selling pressure is waning. Risk: Place protective stops a tier below your lowest ladder (e.g., $204–$206). Re-trigger: Re-add on a reclaim of $240–$245 with volume. 3) Bearish Reversal — lose $210 on heavy sell volume, open a slide to $185 → $168 What to watch: A daily close under $210 with expanding volume, turning today’s lower bound into resistance. That exposes $185 (prior congestion) and even the mid-$160s (today’s intraday low region) in a sharper unwind. Pro Tips: Defense first: Cut risk on a decisive break < $210. Patience: Don’t knife-catch; look for capitulation (wide wick + volume spike) then base-building before re-entries. Invalidation to flip long: Strong reclaim of $210–$215 after the flush, with momentum divergences. Conclusion ZEC’s tape is hot, the ranges are wide, and the levels are clean. Trade what the market gives you: If the high-$260s break and hold → ride the $277 retest, then stalk $300. If we cool into $230–$215 on light volume → consider accumulation for the next push. If $210 snaps on heavy selling → stand aside and wait for $185 → $168 stabilization. Stay nimble, size sanely, and let the levels—not the adrenaline—drive your decisions. 🔥 Tips: Armed Your Trading Arsenal with advanced tools like multiple watchlists, basket orders, and real-time strategy adjustments at Phemex. Our USDT-based scaled orders give you precise control over your risk, while iceberg orders provide stealthy execution. Disclaimer: This is NOT financial or investment advice. Please conduct your own research (DYOR). Phemex is not responsible, directly or indirectly, for any damage or loss incurred or claimed to be caused by or in association with the use of or reliance on any content, goods, or services mentioned in this article.
Phemex
Phemex Analysis #107: Pro Tips for Trading Ethereum (ETH)

Ethereum (ETH) has pushed back into the spotlight after shaking off early‑summer weakness and reclaiming the psychological $4,000 handle. With price now hovering near $4,200, buyers have stepped back in and the daily chart shows a clean sequence of higher lows—story beats that often precede a decisive move. The question on every trader’s mind: does ETH press higher from here, or does it need one more reset before the next leg? Possible Scenarios 1) Bullish Breakout — momentum carries above nearby supply If ETH can extend above the immediate supply zone (watch the $4,300–$4,350 band) on rising volume, a trend continuation opens toward $4,500 and a stretch into $4,800. Pro Tips: Entry: Look for a strong daily close through $4,350 or a break‑and‑retest that holds as support. Risk: Initial stop below the breakout zone (~$4,000), then trail under higher lows. Profit‑taking: Scale out into $4,500 and $4,800 while leaving a runner if momentum expands. 2) Range & Accumulation — base building above $4,000 ETH may continue to coil between $4,000 support and $4,350 resistance while the market digests macro cues and liquidity rotates across majors. Pro Tips: Plan the box: Accumulate near $4,000, lighten up into $4,300–$4,350. Avoid the middle: Wait for edges; don’t chase mid‑range noise. Watch volume: Expansion at range edges often telegraphs the break direction. 3) Bearish Pullback — liquidity sweep into deeper supports Failure to hold $4,000 on heavy sell volume invites a deeper flush toward $3,750 and, in a heavier risk‑off tape, $3,500. Pro Tips: Defense first: Cut risk on a decisive daily close below $4,000. DCA with discipline: Long‑term bulls can consider staggered bids only after stabilization (shrinking candles, waning sell volume, higher‑low attempts) near $3,750 / $3,500. Re‑entry tells: Look for momentum divergences or a strong reclaim of $4,000 to re‑engage. Conclusion ETH sits at a pivotal zone with a clear if/then map: If $4,350 breaks and holds → ride the trend toward $4,500–$4,800. If the range persists → harvest the $4,000–$4,350 box with tight risk. If $4,000 fails → wait for stabilization at $3,750 / $3,500 before redeploying. Anchored by deep liquidity, relentless builder activity, and a maturing staking and L2 ecosystem, Ethereum remains the market’s bellwether. Trade the levels, respect the tape, and let structure—not emotion—drive your decisions. 🔥 Tips: Armed Your Trading Arsenal with advanced tools like multiple watchlists, basket orders, and real-time strategy adjustments at Phemex. Our USDT-based scaled orders give you precise control over your risk, while iceberg orders provide stealthy execution. Disclaimer: This is NOT financial or investment advice. Please conduct your own research (DYOR). Phemex is not responsible, directly or indirectly, for any damage or loss incurred or claimed to be caused by or in association with the use of or reliance on any content, goods, or services mentioned in this article.
Phemex
Phemex Analysis #106: Is Cronos (CRO) Ready for a Comeback?
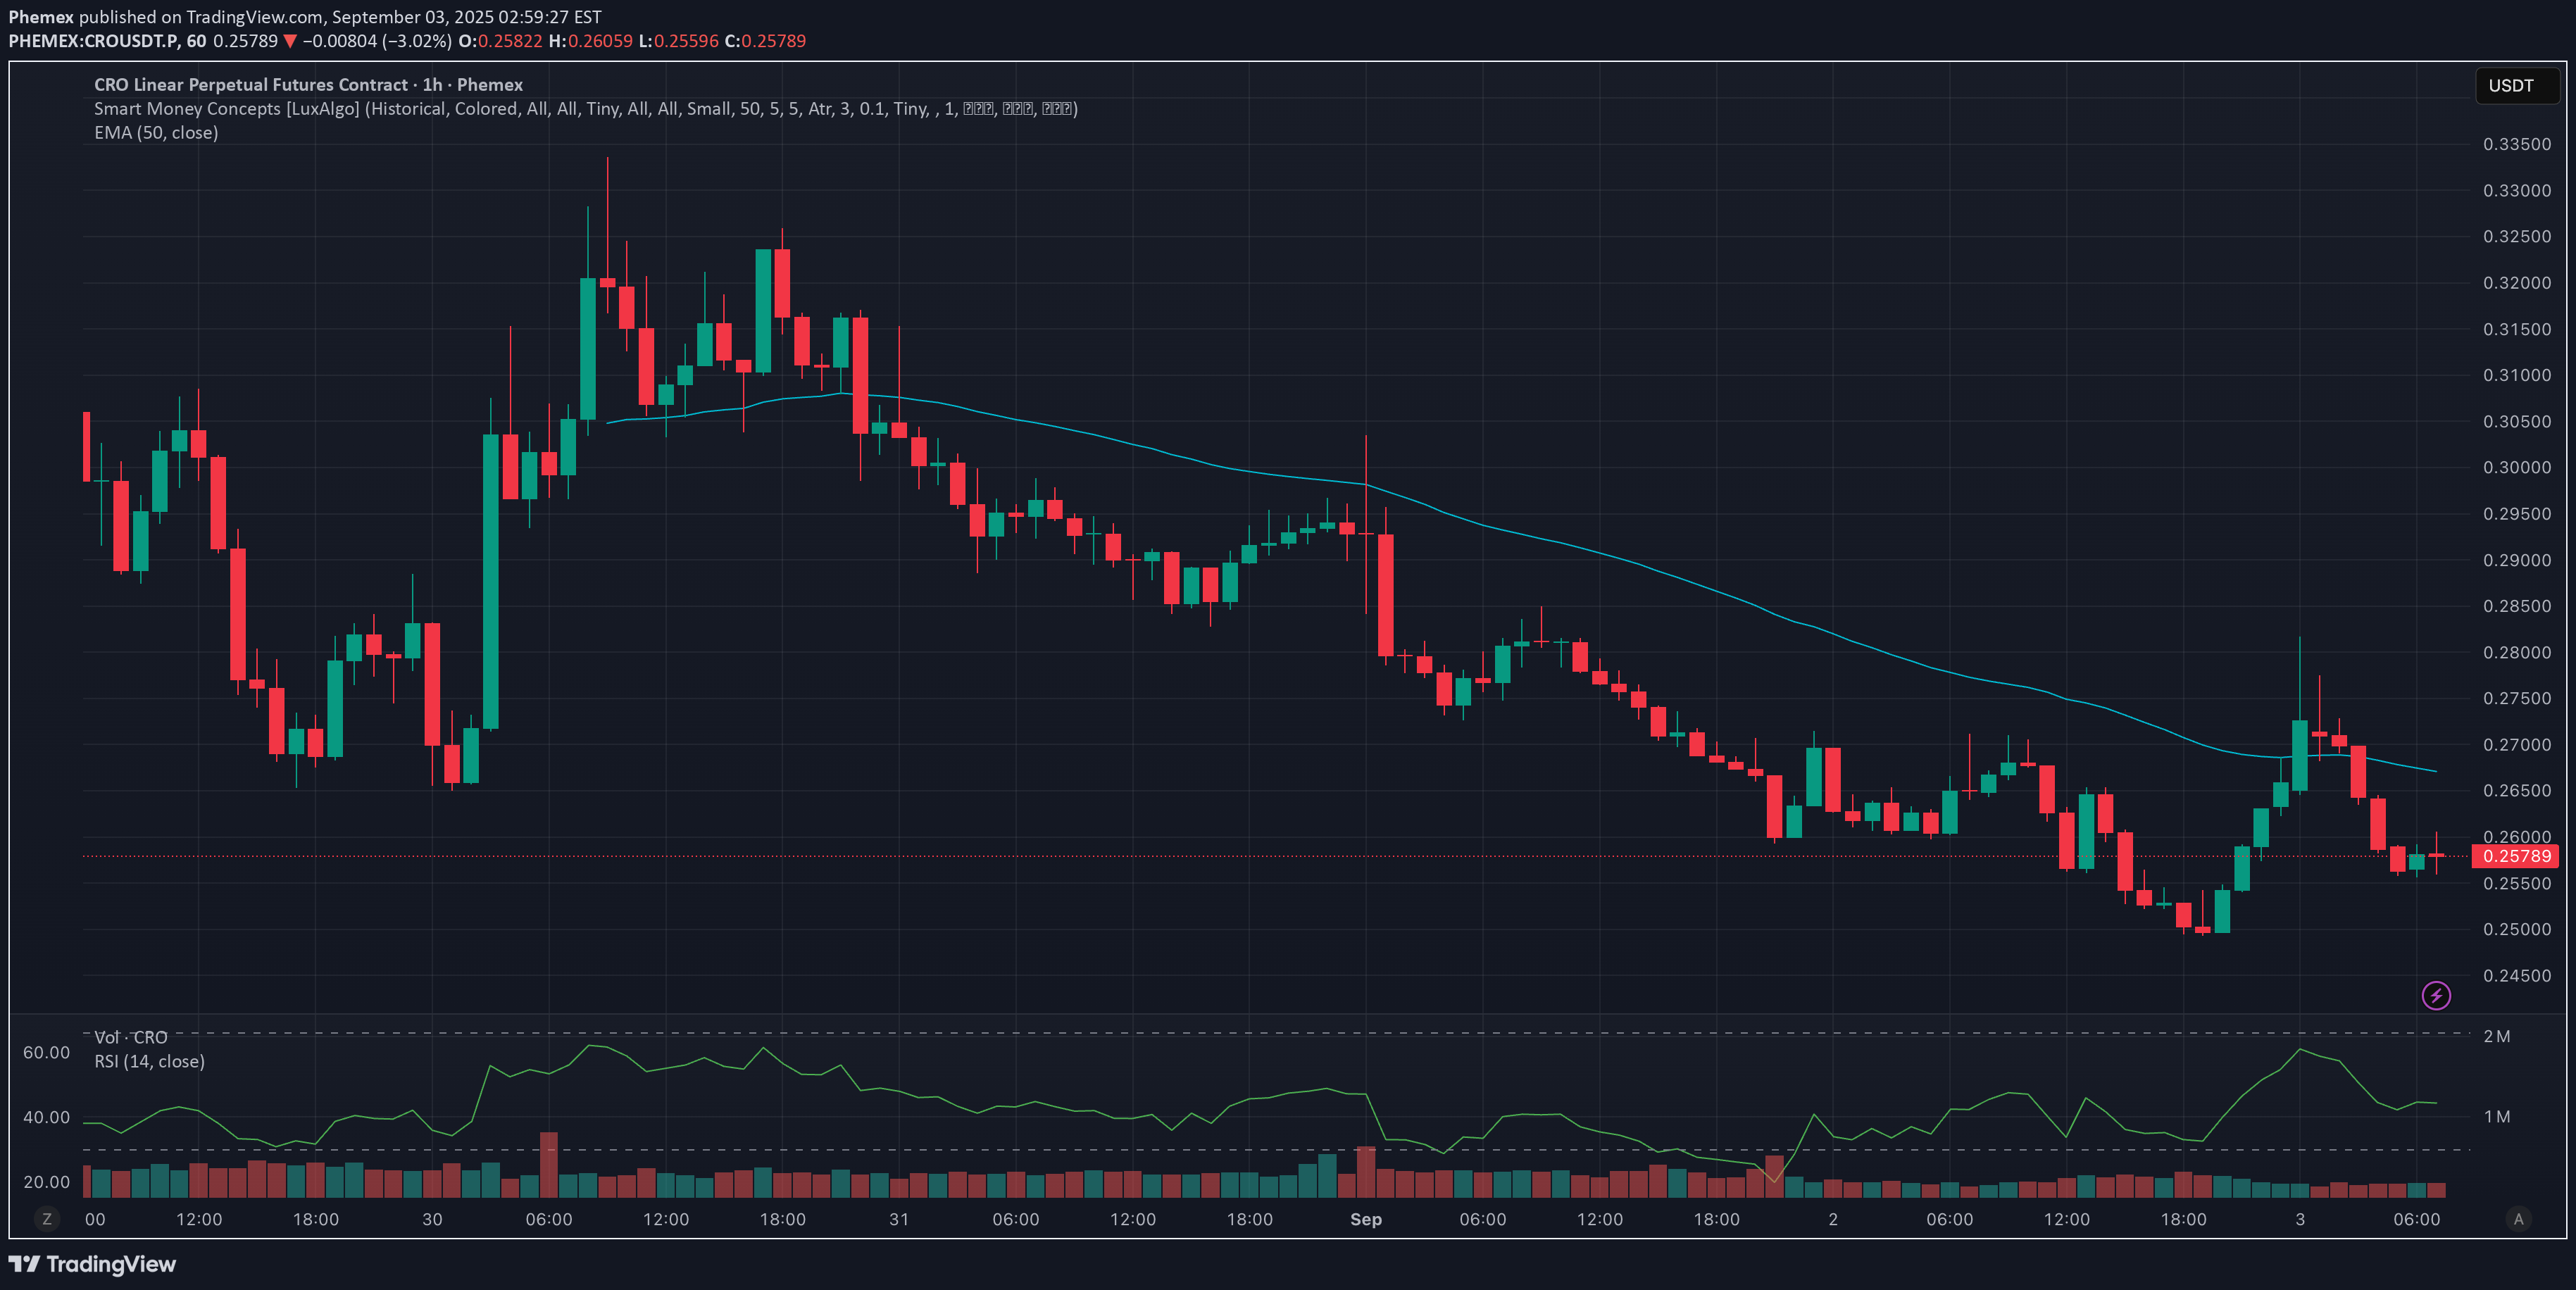
Cronos (CRO), the native token of the Crypto.com ecosystem, has had a turbulent year but is beginning to show signs of recovery. After plunging to lows near $0.08 in early July, CRO rallied to $0.38 by end-August, before retracing and trading today around $0.25. This rebound has fueled optimism among holders who see CRO as a long-term play on exchange tokens and blockchain adoption. Beyond price action, CRO continues to be supported by its strong ecosystem. As the gas token for the Cronos Chain, it powers DeFi apps, NFT platforms, and GameFi projects while offering utility within Crypto.com’s exchange. The combination of real-world usage and a dedicated user base gives CRO a strong foundation for potential growth. With CRO now consolidating under key resistance, the market is watching closely to see if it can stage a sustained comeback. Let’s explore the possible scenarios ahead. Possible Scenarios 1. Bullish Breakout Toward $0.33 - $0.38 If CRO manages to reclaim $0.28 with rising volume, it could trigger a bullish continuation toward $0.33 and potentially $0.38, aligning with prior resistance zones. Pro Tips: Enter after confirmation of a breakout close above $0.28. Scale out profits at $0.33 and $0.38. Use stop-loss orders slightly below $0.25 to protect capital. 2. Range-Bound Consolidation $0.24–$0.28 CRO may continue to oscillate between support at $0.24 and resistance at $0.28, as traders wait for clearer market direction. Pro Tips: Buy near $0.24 support and sell close to $0.28 resistance. Avoid overtrading in the middle of the range. Watch volume shifts as a signal of an impending breakout. 3. Bearish Pullback Toward $0.15 If CRO fails to hold $0.24 on strong sell volume, the bearish trend could resume, sending price back toward $0.15, its support before recent rally. Pro Tips: Reduce exposure if $0.24 fails to hold with conviction. Long-term investors may consider DCA at deeper supports ($0.12–$0.15). Look for reversal signals like RSI divergence before re-entering. Conclusion CRO has rebounded strongly from its summer lows and is now consolidating in a key zone. With real utility across the Crypto.com ecosystem and the Cronos blockchain, it remains a token with strong long-term potential. Traders should keep an eye on the $0.28 breakout level and the $0.24 support zone to navigate the next move effectively. Whether CRO is on the verge of a sustained comeback or preparing for another test of support, disciplined strategies will be essential to capture opportunities. 🔥 Tips: Armed Your Trading Arsenal with advanced tools like multiple watchlists, basket orders, and real-time strategy adjustments at Phemex. Our USDT-based scaled orders give you precise control over your risk, while iceberg orders provide stealthy execution. Disclaimer: This is NOT financial or investment advice. Please conduct your own research (DYOR). Phemex is not responsible, directly or indirectly, for any damage or loss incurred or claimed to be caused by or in association with the use of or reliance on any content, goods, or services mentioned in this article.
Phemex
Phemex Analysis #105: Is AERO Going to the Moon?!
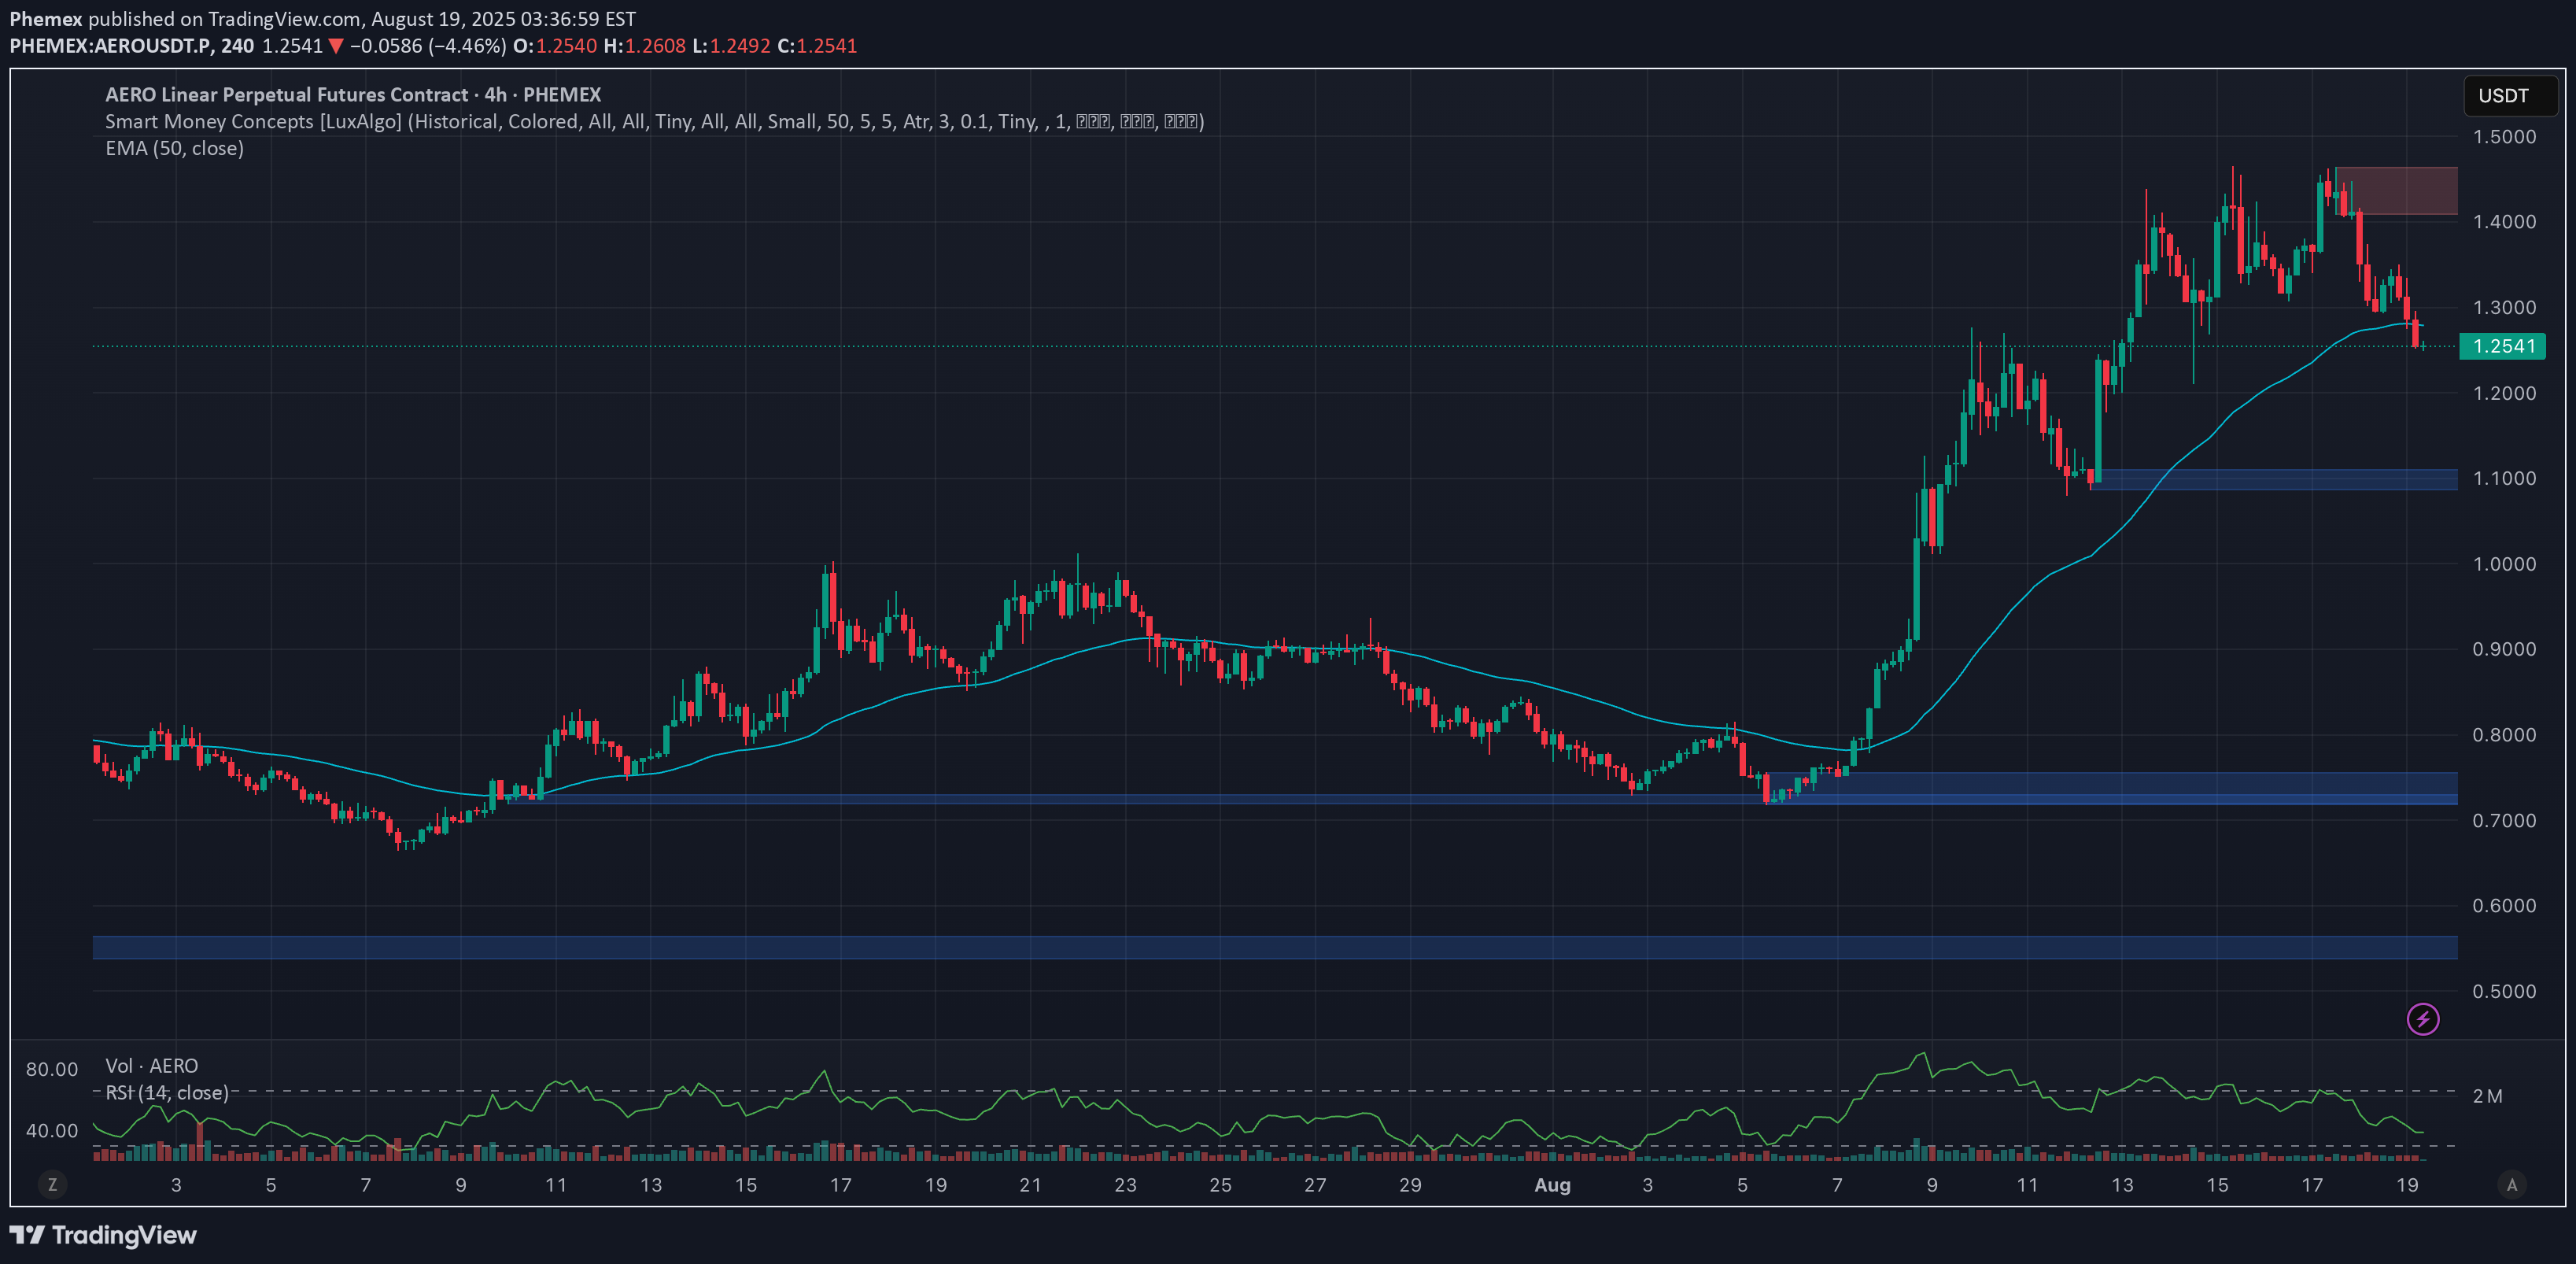
Aerodrome Finance (AERO), the liquidity hub of the Base network, has been one of the hottest DeFi tokens this summer. Since early August, AERO’s price has surged from $0.75 on August 7 to a peak of $1.46 on August 17, before pulling back to around $1.25 today. This rally has fueled speculation that AERO may be preparing for its next big move. Beyond its price action, AERO continues to impress with strong fundamentals. Its vote-locked governance (veAERO) gives holders influence over emissions and fee rewards, while its position as the leading AMM on Base offers significant ecosystem upside. With emissions tapering, AERO’s supply growth is slowing, adding a deflationary edge to its tokenomics. With solid fundamentals and price consolidating just under resistance, AERO is at a pivotal point. Let’s explore the possible scenarios ahead. Possible Scenarios 1. Bullish Breakout: Targeting $1.60+ If AERO stabilizes and breaks $1.46 with strong volume, bullish momentum could extend toward $1.60–$2.00. Pro Tips: Enter on a confirmed breakout close with volume. Take partial profits at $1.60 & $2.00. Use stops just below the consolidation low. 2. Choppy Consolidation at $1.20–$1.46 Price may continue to range between $1.20 and $1.46 as traders digest recent gains. Pro Tips: Trade the range—buy near $1.20, sell near $1.46. Avoid chasing mid-range entries. Watch for volume spikes to anticipate breakout direction. 3. Bearish Retracement Toward $1.00 If AERO fails to hold $1.20, momentum could turn bearish, with $1.00 as the next key accumulation zone. Pro Tips: Exit or reduce positions if $1.20 breaks on heavy volume. Look for stabilization and wick recoveries before re-entering. Long-term bulls may accumulate in the $0.95–$1.00 range, or at the strong $0.75 support level. Conclusion AERO’s rally from $0.75 to $1.46 reflects its growing strength both technically and fundamentally. With Base adoption rising, strong governance mechanics, and a deflationary supply curve, AERO remains one of the most compelling DeFi tokens to watch. The question is whether this consolidation will lead to another leg higher—or if a reset back toward $1.00 is needed first. Either way, disciplined traders with clear strategies are well-positioned to capitalize.
Phemex
Phemex Analysis #103: SOL at $168—Bull Trap or Moon Mission?
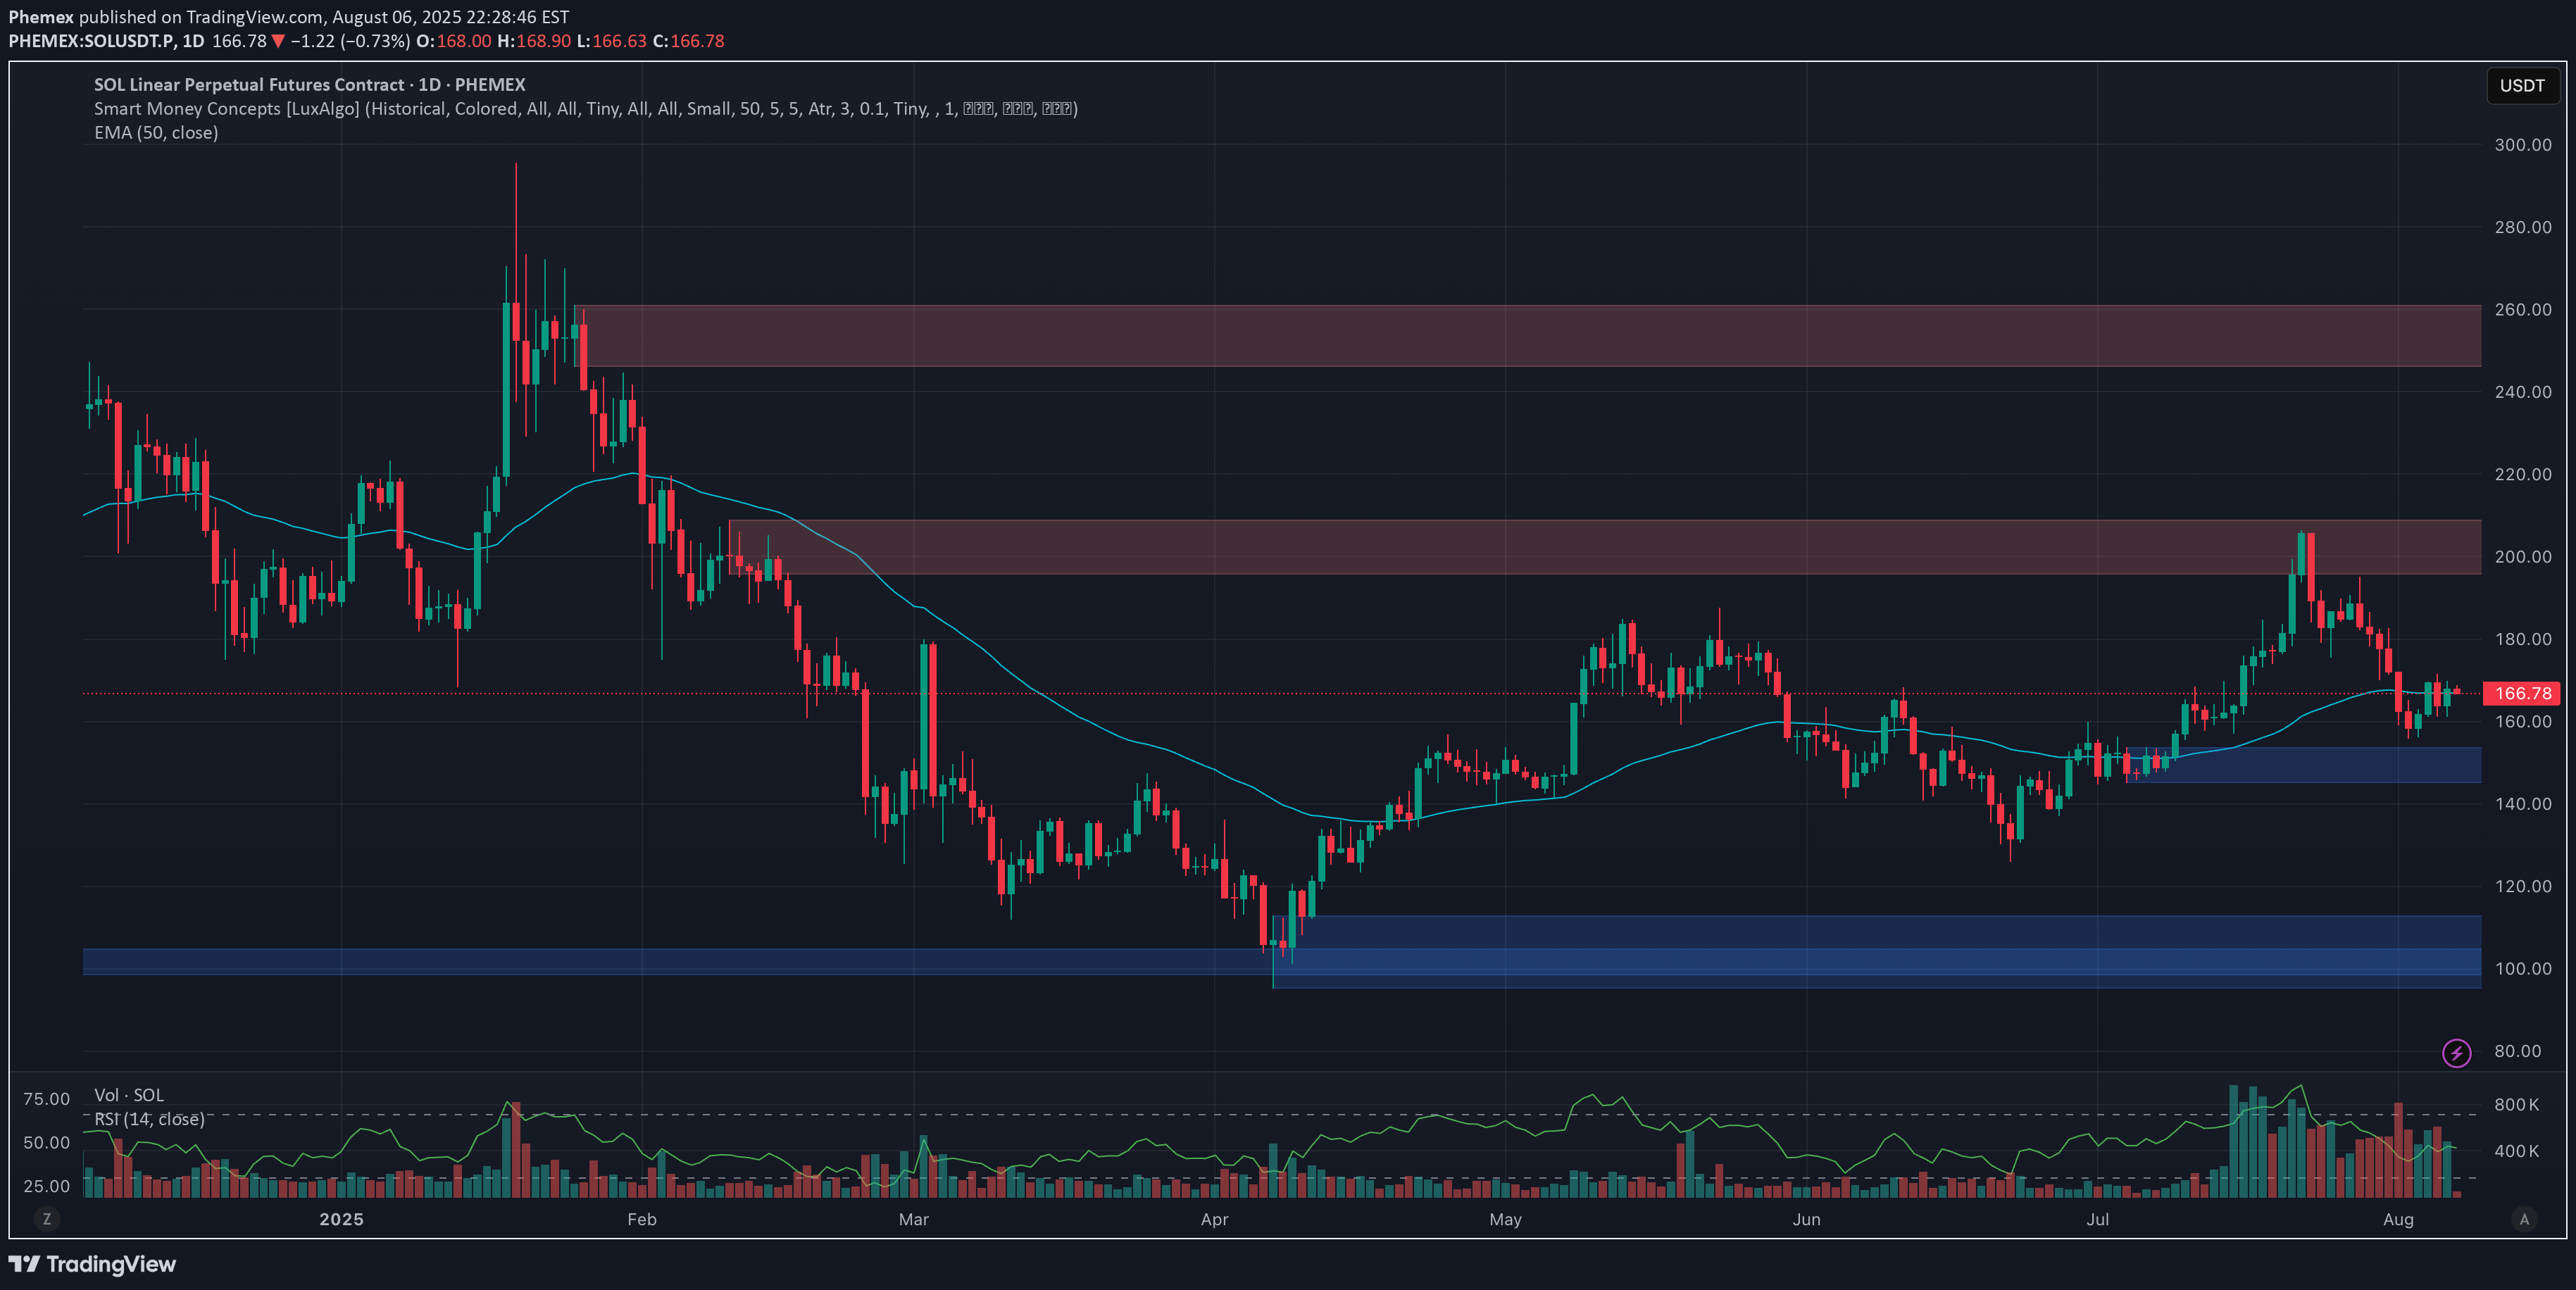
2025 has been a wild ride for Solana ( SOLUSDT.P ). Its price soared from $189 on January 1 to an all-time high of $295 on January 19, only to crash over 65% to a low of $95 by April 4. Today, SOL has bounced back to around $168, sitting between a key support at $145 and resistance at $209. Fundamentally, Solana is trending back into the spotlight. Institutional interest is up, with ETF filings from major players like Franklin Templeton, Grayscale, and VanEck. The launch of the REX-Osprey Solana + Staking ETF (SSK) in July—offering a 7.3% staking yield—has added fuel to SOL’s resurgence. On-chain activity remains strong, with over 22 million active addresses and growing developer engagement following performance upgrades like Alpenglow. With fundamentals strengthening, institutional interest building, and price action showing renewed life, let's explore the possible near-term moves for Solana. Possible Scenarios 1. Bullish Breakout to $209 and Beyond SOL may continue its rebound and test the $180–$190 resistance zone. If that breaks with heavy volume, we could see a bullish continuation toward $200–$209, opening the path for a test of recent highs. Pro Tips: Entry Signal: Buy on a breakout above $180 with strong volume confirmation. Profit Targets: Look to take gains near $200 and $209, while watching for further momentum toward $250+. Risk Management: Place stop-loss just below $165 to protect against sudden reversals. 2. Consolidation Between $145–$180 If buying pressure isn’t enough for a breakout, SOL could consolidate within the $145–$180 range. This would allow the market to digest recent volatility and prepare for the next move. Pro Tips: Range Trading: Use grid bots or buy near support ($145–$150) and sell near resistance ($175–$180). Breakout Watch: Wait for volume to increase at breakout or breakdown levels before taking a more aggressive position. 3. Bearish Breakdown Toward $145 If broader market sentiment shifts or ETF momentum fades, SOL could fail to hold above $145, triggering a correction toward lower support levels near $130 or even $100–$120 in a severe scenario. Pro Tips: Reduce Risk: Scale out of positions or go cautious if $145 fails decisively on high volume. Dip Accumulation: Long-term investors may look to re-enter at stabilized price zones at $130–$120. Conclusion Solana remains in a critical phase where fundamentals—signal upgrades, active developer growth, and institutional ETF activity—align with technical bounce patterns. Whether SOL breaks out into a new rally, consolidates, or pulls back depends on upcoming price action and broader market sentiment. By using clear entry triggers, defined targets, and disciplined risk management, traders can effectively ride Solana’s next wave of volatility. 🔥 Tips: Armed Your Trading Arsenal with advanced tools like multiple watchlists, basket orders, and real-time strategy adjustments at Phemex. Our USDT-based scaled orders give you precise control over your risk, while iceberg orders provide stealthy execution. Disclaimer: This is NOT financial or investment advice. Please conduct your own research (DYOR). Phemex is not responsible, directly or indirectly, for any damage or loss incurred or claimed to be caused by or in association with the use of or reliance on any content, goods, or services mentioned in this article.
Phemex
Phemex Analysis #102: Is Notcoin Ready for a BULL RUN?!
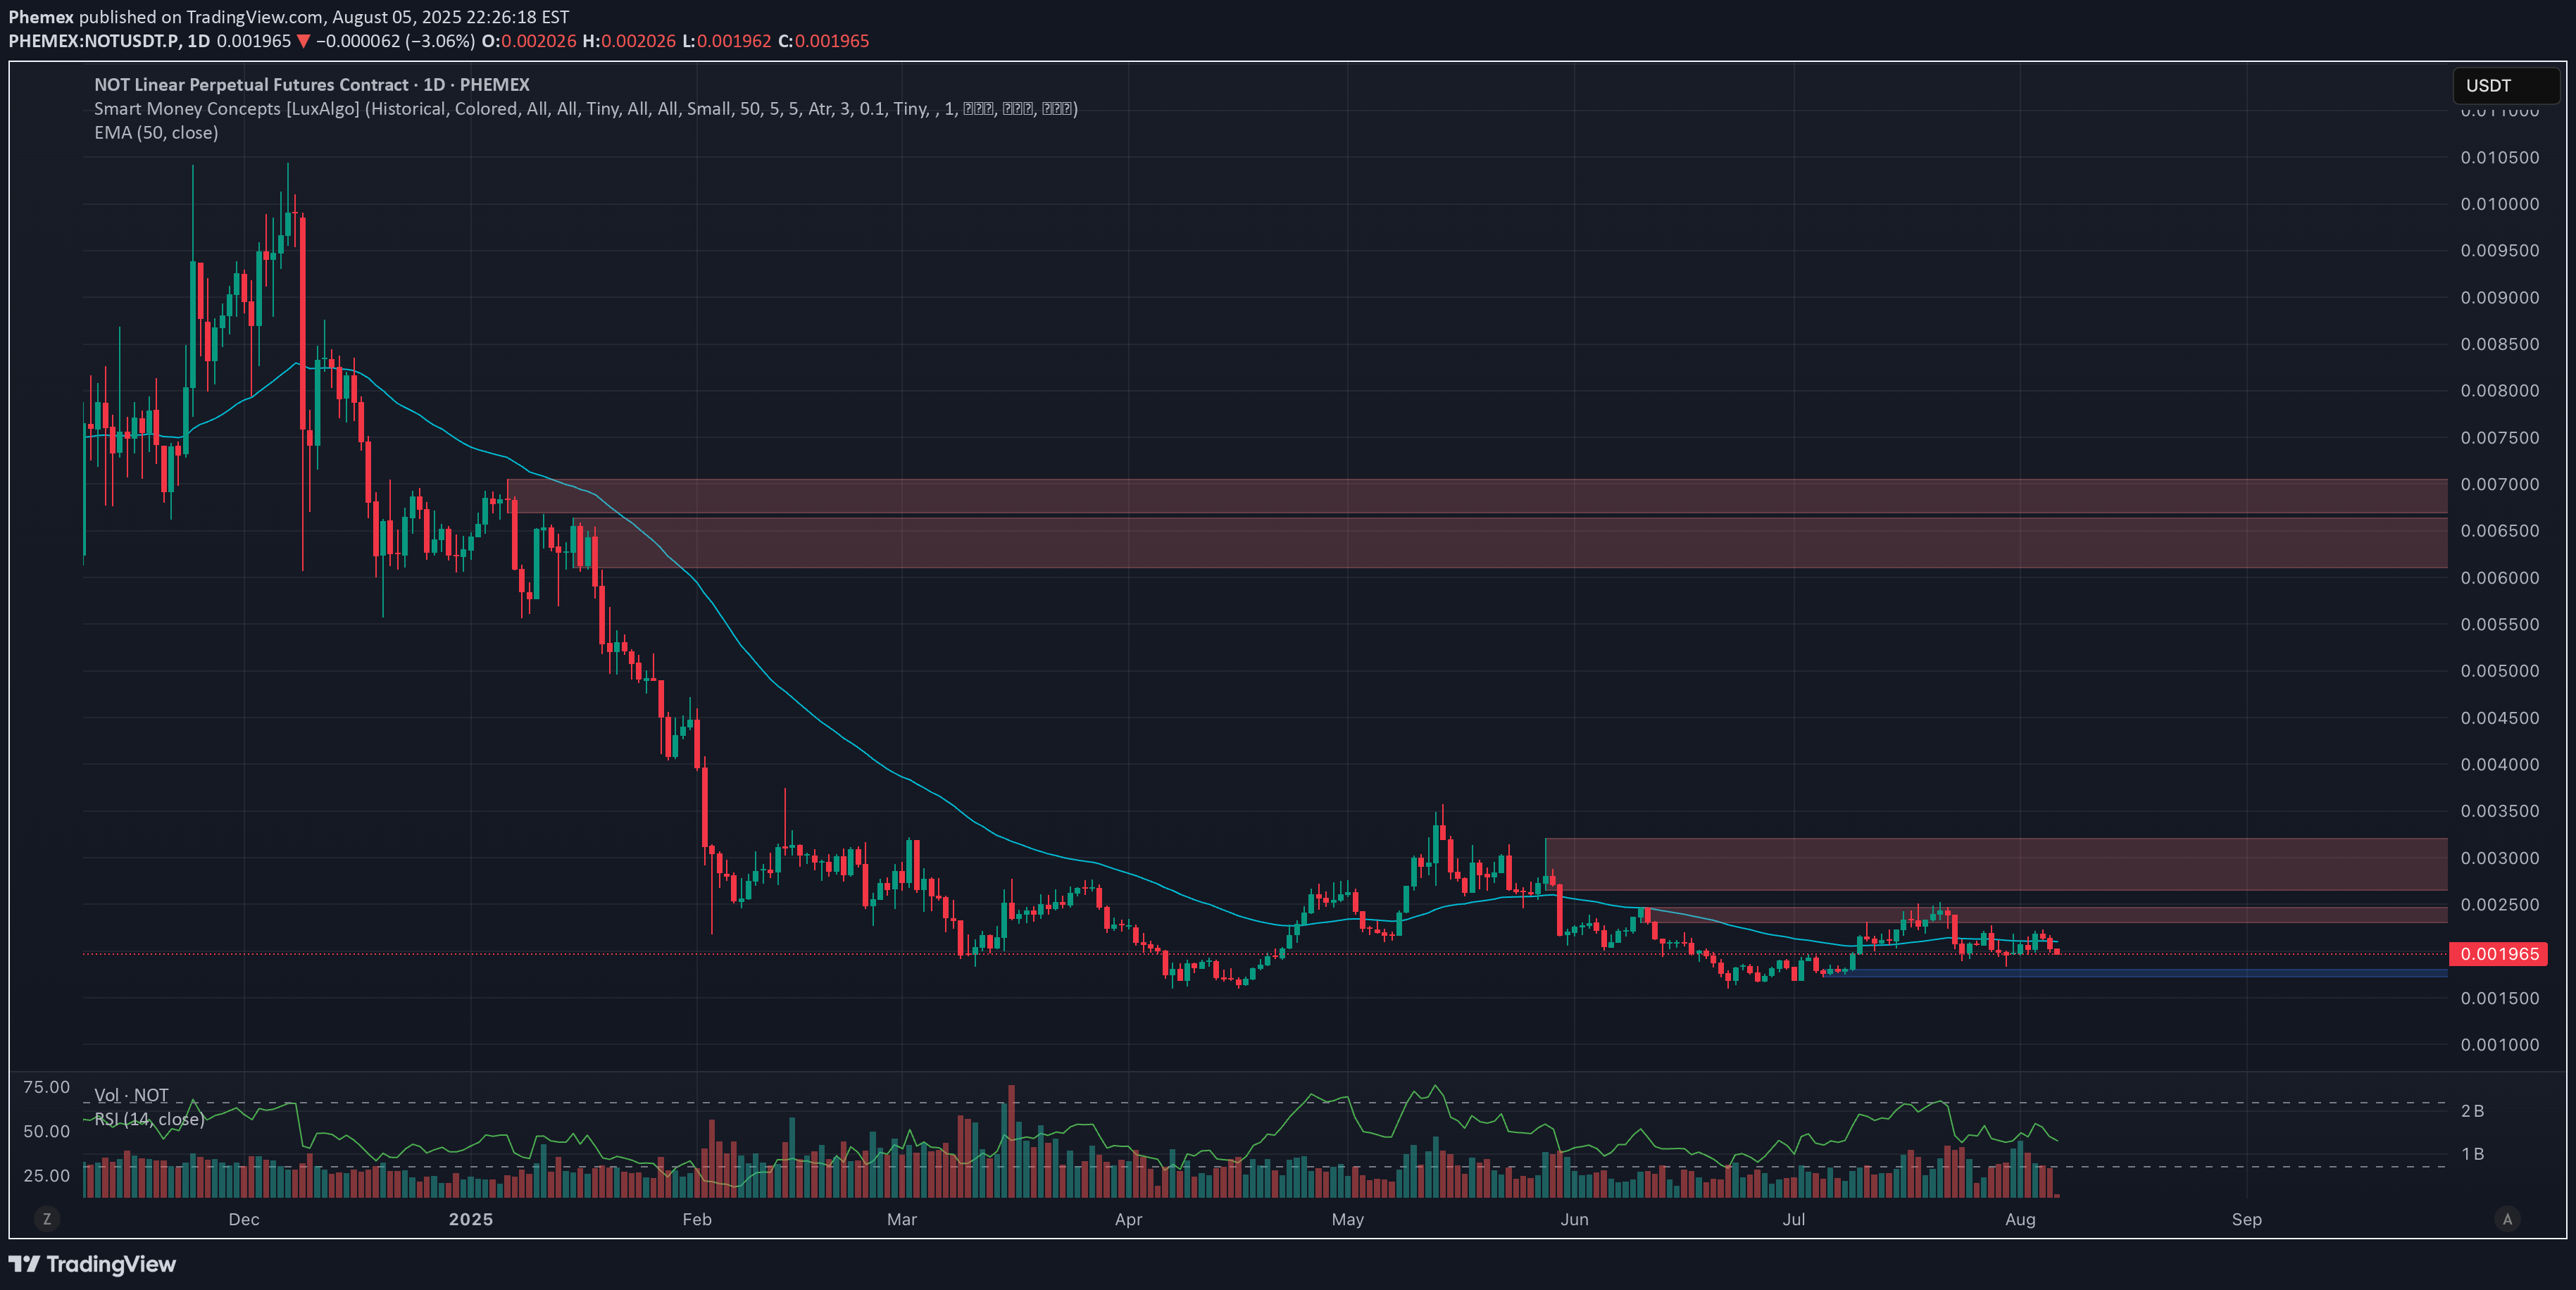
Notcoin (NOT) is a popular Telegram-based tap-to-earn game token launched on the TON blockchain. Designed as a gateway to Web3, it attracted over 35 million players, supported by a community of 2.86 million wallet holders and nearly 8 million wallet interactions—making it one of the largest social-game currencies in crypto. Recently, Notcoin’s price has been building on the daily (1D) timeframe, showing signs of structural accumulation across multiple days. This long-fashioned base suggests potential for a continuation rally, especially if buyer demand reasserts itself. Currently, NOT trades near $0.00198, giving it a market capitalization around $200 million, and about a 9% gain over the past 30 days. Volume is also picking up, confirming growing retail interest and speculation. Given this backdrop, let’s explore the near-term scenarios shaping NOT’s next move. Possible Scenarios 1. Bullish Breakout—Momentum Ignites If NOT continues its daily-range accumulation and rises above $0.0023–$0.0025 with increased volume, this could trigger a breakout phase. Momentum traders may target levels around $0.0032 or higher—driven by renewed speculation and broader bullish sentiment. Pro Tips: Enter positions once price clears $0.0025 with strong volume. Consider taking short-term profits at $0.0032, $0.0036; long-term profit at $0.0065 or $0.007. 2. Neutral Range & 1D Base Confirmation If price remains contained between $0.0017 and $0.0023, continued sideways movement may reflect institutional accumulation or range farming. This base-building phase—formed in the daily timeframe—often precedes a breakout when volume starts to pick up. Pro Tips: Use grid trading to ride small swings between support and resistance. Watch for volume spikes around the $0.0023 resistance; this can signal breakout readiness. Avoid overtrading; accumulate slowly only after price shows sustained stabilization. 3. Breakdown Relative Weakness Should NOT fail to hold the bottom trendline near $0.0017, or break with high volume down toward $0.0015 or below, bearish pressure could intensify. This could indicate a sell-off or loss of interest over time. Pro Tips: If support at $0.0017 fails decisively, consider reducing positions or staying sidelined. Long-term holders may wait for a retest near lower supports ($0.0015 or below) before gradually re-entering. Conclusion Notcoin (NOT) sits at a key crossroads—built on robust Web3 community metrics, strong daily timeframe structure, and rising interest. Whether you trade the potential breakout, capitalize on range-bound opportunities, or adopt a long-term DCA strategy, ensuring tight risk management and clear entry/exit levels is essential. Watch the critical $0.0017–$0.0023 zone carefully: its direction could define NOT’s next big move. 🔥 Tips: Armed Your Trading Arsenal with advanced tools like multiple watchlists, basket orders, and real-time strategy adjustments at Phemex. Our USDT-based scaled orders give you precise control over your risk, while iceberg orders provide stealthy execution. Disclaimer: This is NOT financial or investment advice. Please conduct your own research (DYOR). Phemex is not responsible, directly or indirectly, for any damage or loss incurred or claimed to be caused by or in association with the use of or reliance on any content, goods, or services mentioned in this article.
Phemex
Phemex Analysis #101: Is Dogecoin (DOGE) Ready to Moon Again?
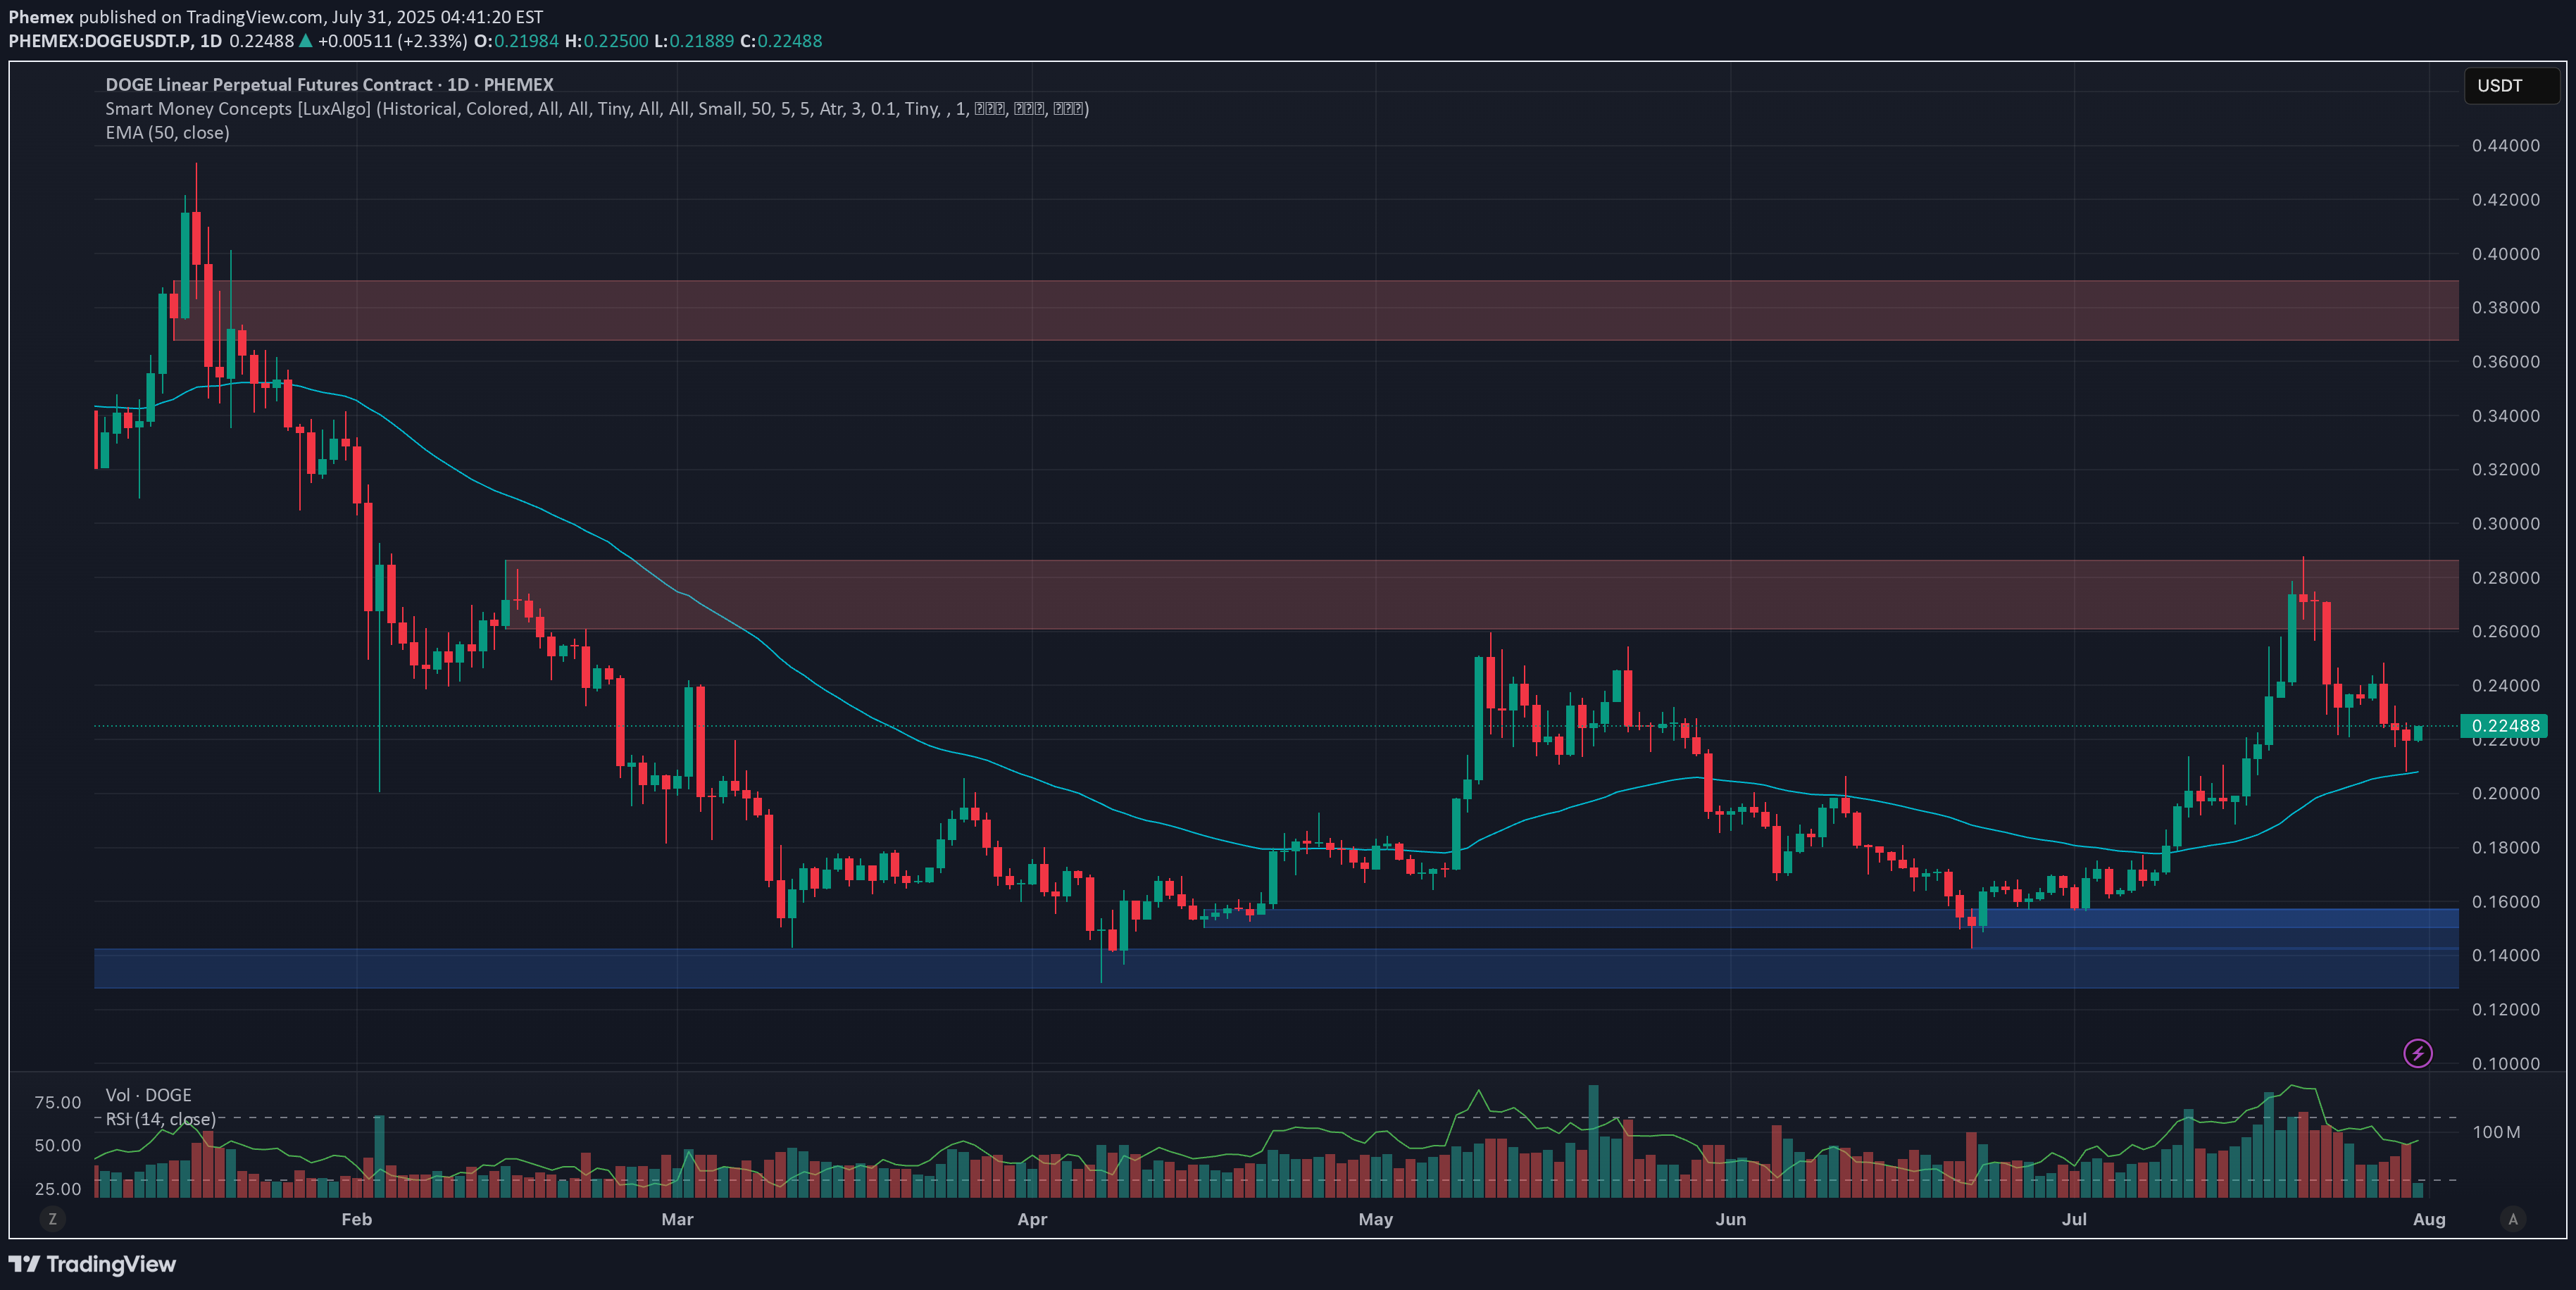
Dogecoin ( DOGEUSDT.P ), the original meme cryptocurrency, is once again capturing investor attention, fueled by impressive bullish movements. Currently trading around $0.2245, DOGE surged approximately 70% in July, decisively breaking the key resistance at $0.22 and challenging the next resistance level near $0.28. With whale accumulation intensifying, renewed retail investor enthusiasm, and heightened speculation surrounding possible ETF approvals, Dogecoin appears poised to potentially sustain or even amplify its recent gains. But the key question remains: is DOGE truly ready to moon again, or is caution necessary following such rapid price movement? Let’s carefully explore a few potential scenarios to inform your trading strategies: Possible Scenarios 1. Bullish Continuation—Targeting Higher Levels After successfully breaking above the crucial $0.22 resistance, Dogecoin could maintain its upward momentum if buying pressure remains strong. In this bullish scenario, DOGE might swiftly retest the immediate resistance at $0.25, then target higher levels near $0.28, and potentially surge toward the significant resistance at $0.39. Pro Tips: Entry Signals: Watch for a confirmed breakout above $0.25, especially if accompanied by rising trading volume, as a potential bullish entry point. Profit-Taking: Strategically secure partial profits at resistance zones around $0.28 and $0.39. Risk Management: Implement tight stop-loss orders just below the key support at $0.20 to guard against unexpected reversals. 2. Retest and Accumulation—Neutral Scenario Given DOGE’s rapid price rise, a short-term pullback towards previous resistance-turned-support at $0.22 or even $0.20 is plausible. Such retracements, particularly on decreasing volume, might signal healthy consolidation, setting the stage for future bullish momentum. Pro Tips: Buying Opportunities: Look to accumulate DOGE if a low-volume pullback occurs toward support zones around $0.22 or $0.20. Monitor Volume: Observe closely for decreasing trading volume during retracements, which typically indicates positive consolidation rather than a bearish reversal. 3. Bearish Scenario—Deeper Correction Possible Should overall market sentiment shift negatively or DOGE fail to hold crucial support at $0.22, bearish pressure could escalate, potentially pushing Dogecoin down to deeper support levels around $0.198, and possibly as low as $0.15 or $0.13. Pro Tips: Risk Management: Consider reducing or exiting positions if DOGE decisively breaks below $0.22 on increased selling volume. Long-Term Accumulation: Long-term holders may strategically accumulate DOGE at historically strong support levels ($0.15 or $0.13) once price stabilization occurs. Conclusion Dogecoin (DOGE) stands at a pivotal point, balancing bullish enthusiasm against the possibility of a correction. Traders should carefully monitor resistance at $0.25, the critical support at $0.22, and closely observe volume dynamics. By strategically aligning their trades with these outlined scenarios and employing disciplined risk management, traders can confidently navigate DOGE’s volatility and potentially capitalize on its next significant move. 🔥 Tips: Armed Your Trading Arsenal with advanced tools like multiple watchlists, basket orders, and real-time strategy adjustments at Phemex. Our USDT-based scaled orders give you precise control over your risk, while iceberg orders provide stealthy execution. Disclaimer: This is NOT financial or investment advice. Please conduct your own research (DYOR). Phemex is not responsible, directly or indirectly, for any damage or loss incurred or claimed to be caused by or in association with the use of or reliance on any content, goods, or services mentioned in this article.
Phemex
Phemex Analysis #100: Pro Tips for Trading Sui (SUI)
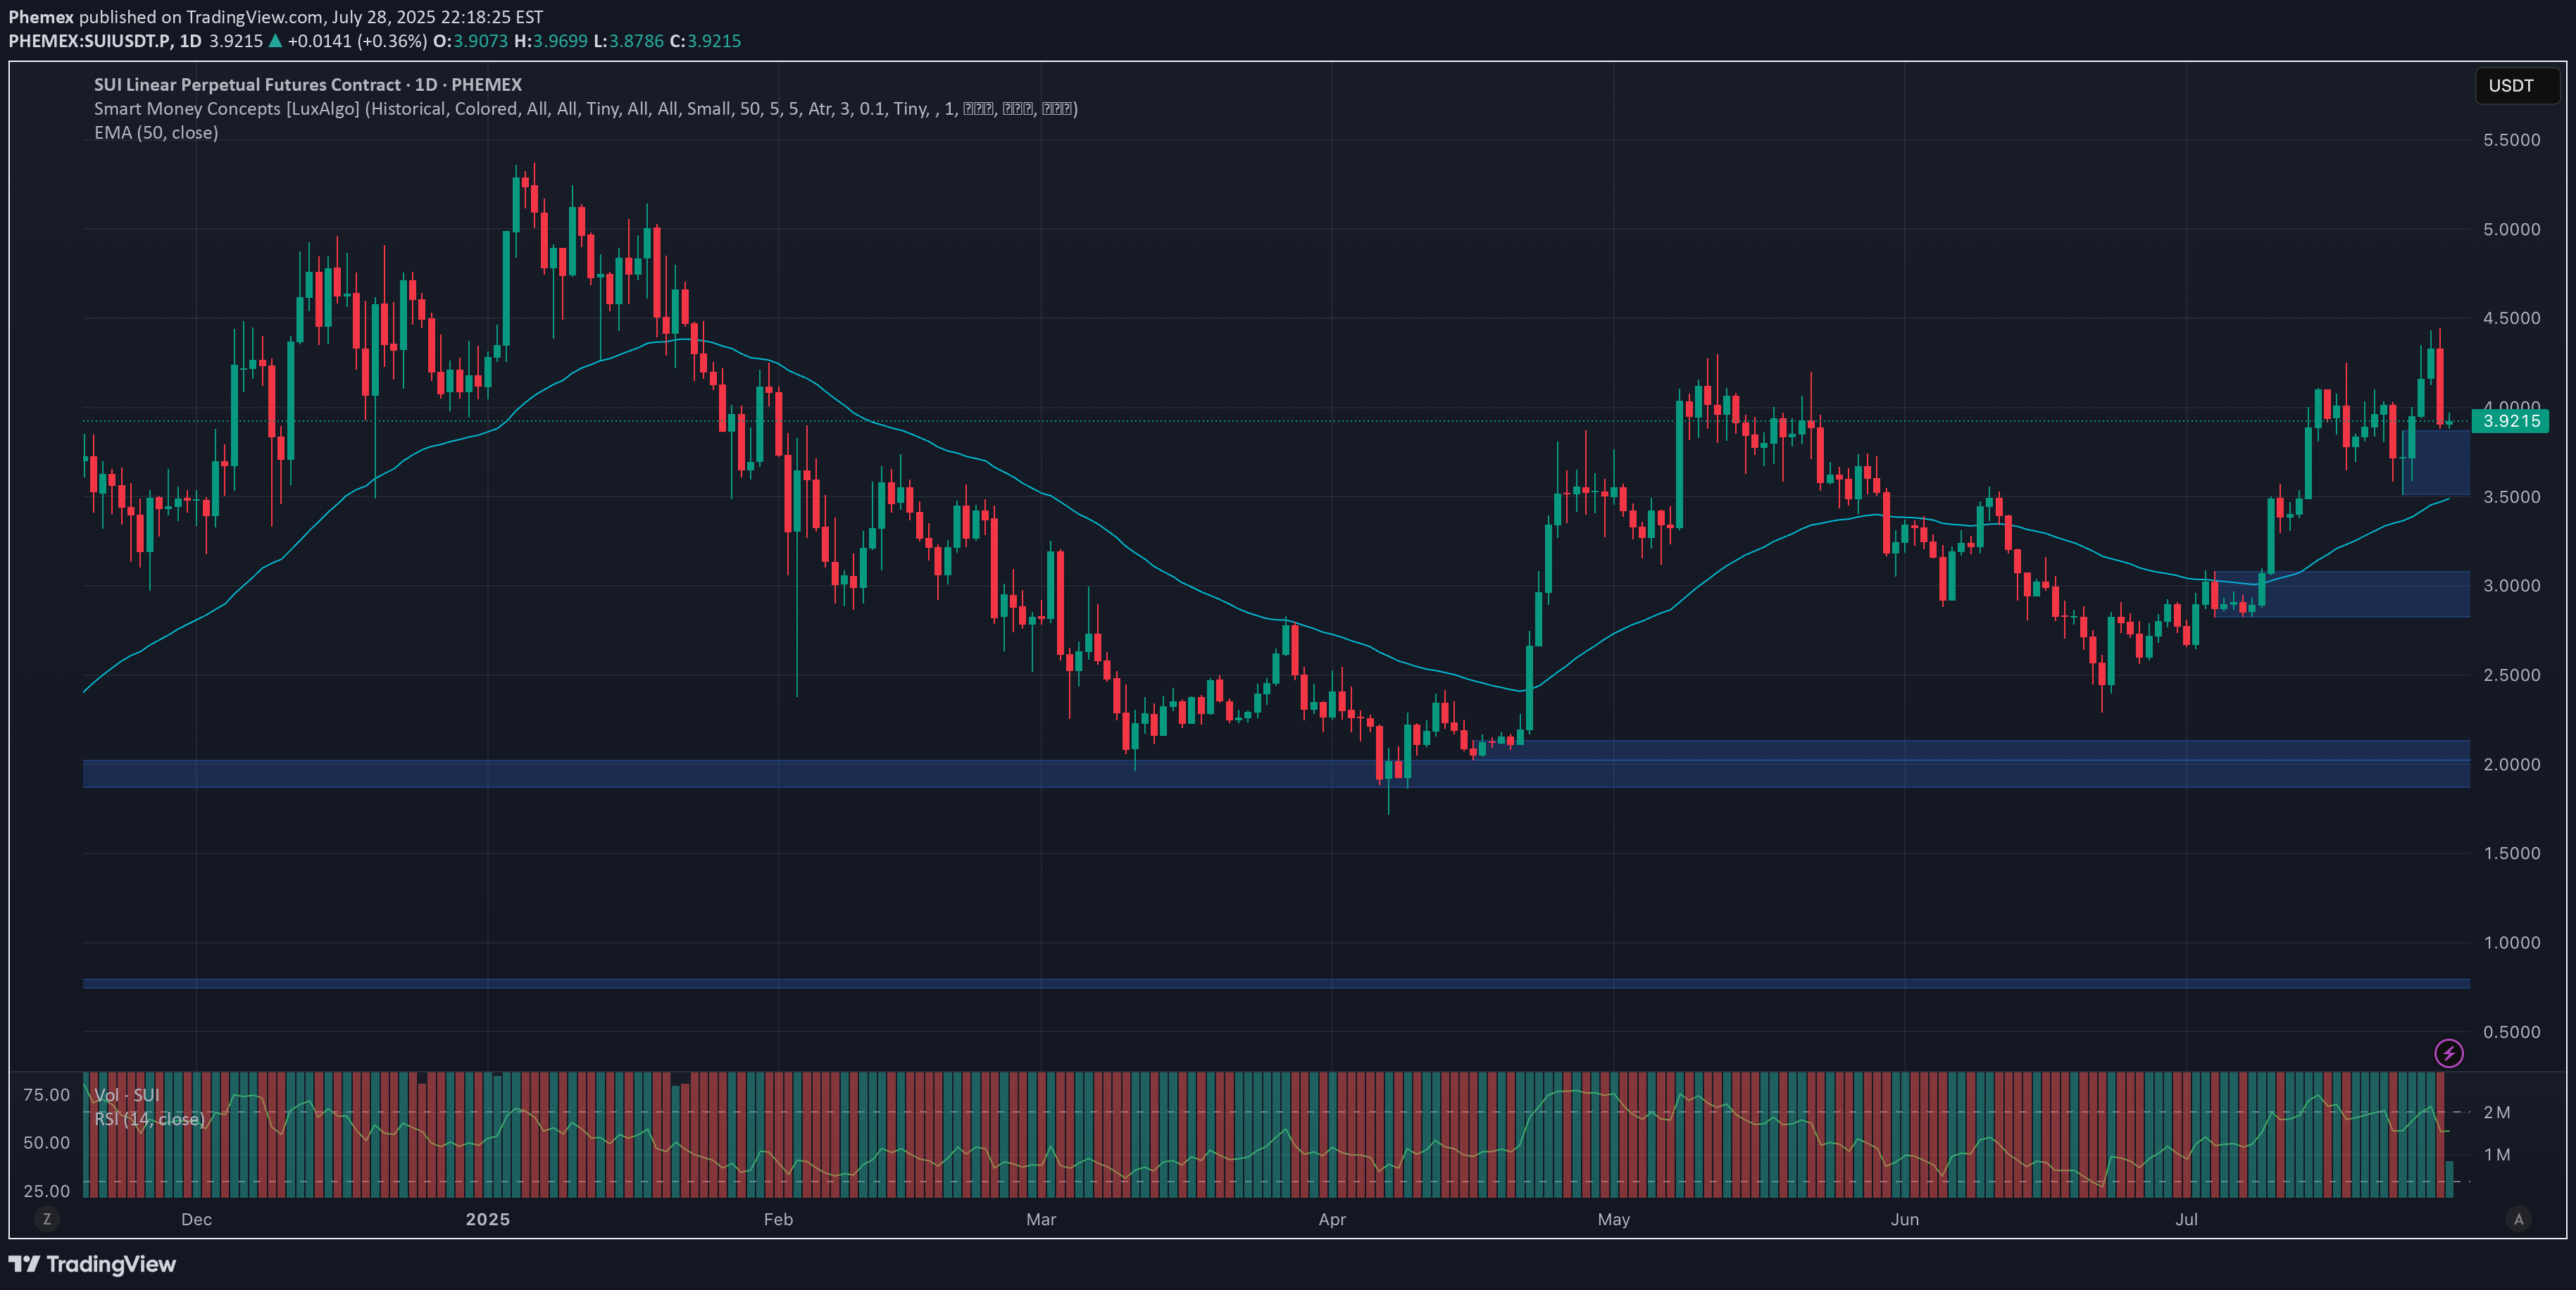
Sui ( SUIUSDT.P ) has swiftly emerged as one of the most promising Layer 1 blockchains, well-known for its focus on scalability, high throughput, and developer-friendly infrastructure. Recently, Sui has attracted significant attention thanks to its growing DeFi ecosystem, strategic partnerships, and community enthusiasm. Over the past 2 weeks, SUI showed robust bullish activity, rising more than 30% to break key resistance around $4.3, and it’s now trading at around $3.9. The current price action indicates a potential continuation of bullish momentum, yet traders remain cautious about possible retracements and volatility. Let’s carefully examine a few likely scenarios for SUI and determine how traders can capitalize strategically. Possible Scenarios 1. Short-term Retracement (Healthy Pullback) Following the recent rapid price rise, SUI might experience a short-term correction toward previous resistance-turned-support near $3.6. A low-volume retracement to this level could represent a healthy pause before the next bullish leg. Pro Tips: Buying the Dip: Closely watch support around $3.6; a successful retest on lower volume could present an ideal buying opportunity. Volume Monitoring: Pay close attention to volume levels during the pullback—a low-volume dip indicates healthy profit-taking rather than bearish reversal. 2. Bullish Breakout (Pushing Higher!) If SUI maintains bullish momentum and successfully holds above recent support around $3.8, it may continue to target higher resistance levels. Strong buying volume accompanying further gains could send SUI towards key resistance zones around $5.0 and potentially breaking previous all-time-high $5.37. Pro Tips: Entry Signals: Consider buying positions on a high-volume breakout confirmation above $4.45, signaling bullish continuation. Profit Targets: Plan partial profit-taking around $5.0 and $5.37 resistance zones to lock in gains. 3. Bearish Scenario (Deeper Correction) If broader market sentiment turns negative or if buying volume significantly weakens, SUI could break below $3.6, signaling bearish pressure. In this scenario, deeper corrections towards support levels at $2.8 or potentially $2.3 may occur. Pro Tips: Short Opportunities: Experienced traders could consider shorting or reducing exposure if SUI decisively breaks below the key $3.6 support level on increased selling volume. Accumulation Strategy: Long-term investors can strategically accumulate positions near stronger support zones around $2.8 and $2.3 after confirming price stabilization. Conclusion Sui (SUI) currently offers compelling trading opportunities driven by recent bullish activity and increasing ecosystem growth. Traders should stay alert for critical breakout levels ($4.45) and monitor essential support areas ($3.6) closely. By applying disciplined trading approaches, setting clear profit targets, and managing risk prudently, traders can navigate SUI’s volatility with greater confidence and potentially maximize gains. 🔥 Tips: Armed Your Trading Arsenal with advanced tools like multiple watchlists, basket orders, and real-time strategy adjustments at Phemex. Our USDT-based scaled orders give you precise control over your risk, while iceberg orders provide stealthy execution. Disclaimer: This is NOT financial or investment advice. Please conduct your own research (DYOR). Phemex is not responsible, directly or indirectly, for any damage or loss incurred or claimed to be caused by or in association with the use of or reliance on any content, goods, or services mentioned in this article.
Disclaimer
Any content and materials included in Sahmeto's website and official communication channels are a compilation of personal opinions and analyses and are not binding. They do not constitute any recommendation for buying, selling, entering or exiting the stock market and cryptocurrency market. Also, all news and analyses included in the website and channels are merely republished information from official and unofficial domestic and foreign sources, and it is obvious that users of the said content are responsible for following up and ensuring the authenticity and accuracy of the materials. Therefore, while disclaiming responsibility, it is declared that the responsibility for any decision-making, action, and potential profit and loss in the capital market and cryptocurrency market lies with the trader.