
PegasusTechCharts
@t_PegasusTechCharts

What symbols does the trader recommend buying?
Purchase History
پیام های تریدر
Filter
Signal Type
PegasusTechCharts
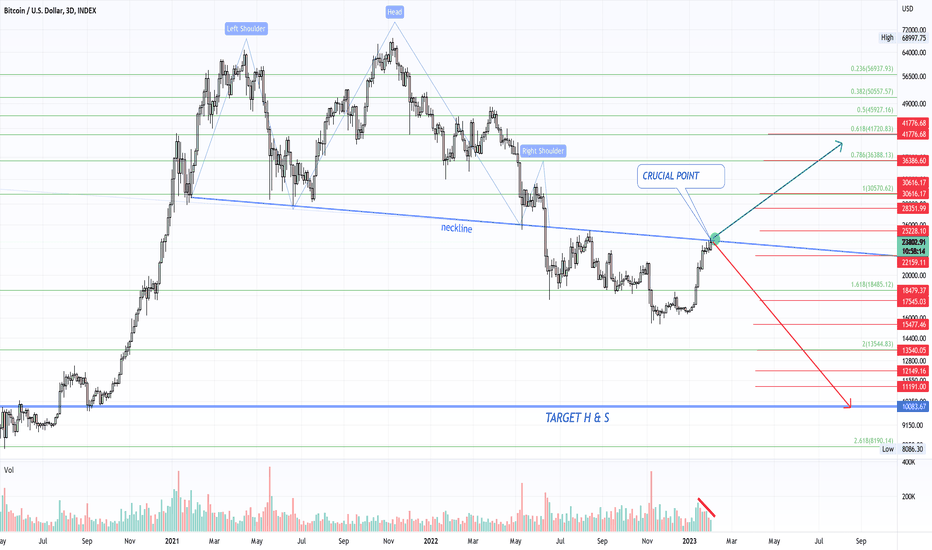
Hello friends, It was already some time since my last published idea, so here is a fresh one! You can see here that a head shoulder formation has formed on this 3-day chart The neckline is immediately a crucial point. We have a divergence with the volume and price as you can see. There are also divergences on several other oscillators. A picture say more that a thousand words, so you see it all in the chart The price target for now is USD 10,000 for Bitcoin , and the key here is of course patience. The interest rate hikes are far from done and the macroeconomic looks very bad. The war also seems to be escalating, and there are other tensions in the world as well. E.g. China/ US, Israel and Iran. Food prices continue to rise. Food prices continue to rise violently. In short, we see everywhere malaise. My idea is that the Euro and the Dollar are being extremely manipulated, but also the markets in general, by central banks. Stock prices are way too high compared to what is happening in the world, and normally there will be a sharp correction on that. The SP-500 will my idea quite soon go on the downward path again. Happy trading and good luck! Disclaimer This is my view, no advice to buy or sell. Also, always do your own research! --->> Dear friends, please follow me for updates and give me support with a like 👍 if you like me to continue this work. Thanks 💚
PegasusTechCharts
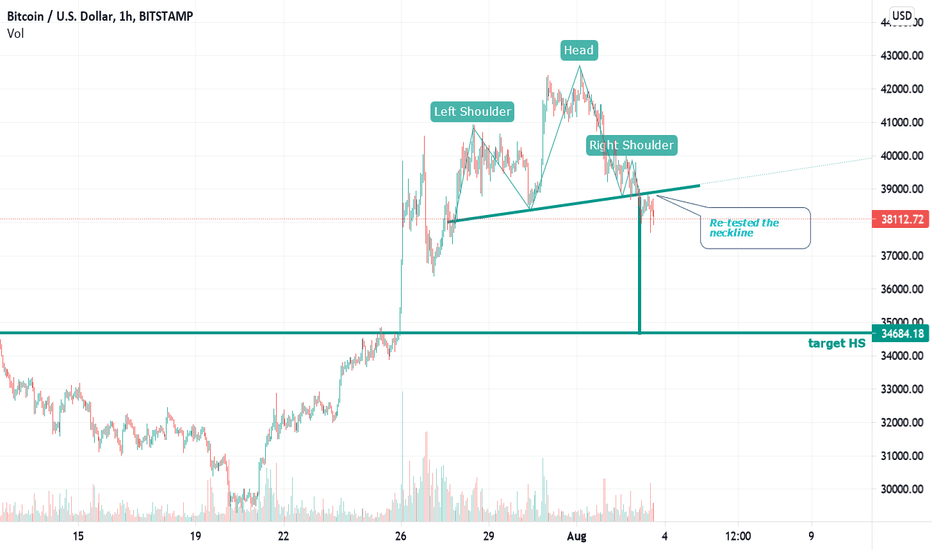
HS FormationDear FriendsA quick but brief update here on the hourly chart.Bitcoin has clearly formed a HS formation and the neckline of this formation has already been re-tested.The Target is now 34684 and from there we will see again how the structure develops. Also be sure to check out my previous updates on Bitcoin as they belong together. The others show the middle term targets.--- > In this market I advice to use tight stops. <---Please share your thoughts and idea's below dear friends. What do you think and why do you think it with or without a chart.I wish you all good luck with trading!Disclaimer This is my view, no advice to buy or sell. Also always do your own research!--->> Dear friends please follow me for updates and give me support with a like 👍 if you like me to continue this work. Thanks 💚Forming of the right shoulder of a bigger HS formations possible that will happen ...Dear friends 2 scenarios could happen. Please note these are hypothesis! Scenario 1 Price rebounds up to the green neckline at 39000 and continues down to the target of 34379. Scenario 2Price breaks through the green neckline and invalidates the first HS formation but then forms the right shoulder of the orange HS formation.The target would then be 32125. Interestingly, in scenario 1 This is the 0.618 fibonacci level and in scenario 2 it is the 0.786 level.If price goes under the 0.786 we will be heading to the old low. This happens sometimes with the formation of HS formations. You can see that by the 2 necklines which are crossing. So again these are my ideas and of course it can fail as everything can fail in TA.Bullish falling wedge Dear friends,I close the trade because in my opinion BTC will first retest the 0.618 Fiblevel which is exactly the target of the bullish falling wedge. The target is 40580 and stop loss level 37377.Then we have formed a new bearish Head and shoulders as seen in my updates to go short.Dear friends,The trade is going as expected. Now we need to see how it evoluates. We are forming now the right shoulder of this HS formation. The green one which was not a perfect one is invalidated but this orange one has a chance.The orange will be invalidated when the price goes higher than 41-42600 because the right shoulder cannot be higher then the head.The outbreak happened with good volume so that always validate it.Succes dear friends and please share your idea's here.Closed Long positionDear friends,I closed the long position. Volume is declining, price is rising. The target almost reached.A possible scenario is that we form the right shoulder of the HS formation mentioned in the updates before. Should that be the case than the HS formation has a target of about 33000.I am not shorting BTC unless we will break below the neckline and re-test it.Wish you all good luck friends and happy trading!Update wedgeThe levels from the trading range are still valid and in between you can trade on shorter timeframes if you have the time to monitor it intraday of course.Right now we see price bouncing with nice volume This will not invalidate the HS pattern yet but it will also not fall in on straight line under the neckline.My idea is that price can even go again to the top of the range because BTC is forming a falling wedgeWish you very good profits dear friends!Short updateWe see a head and shoulders and a bearish rising wedge has formed.If the price of BTC rise above 42600 then the HS formation is invalid and the bullish falling wedge from the last update comes in play. The levels from the other idea's in the range are still valid untill price breaks out to the upside or downside.Succes dear friends!
PegasusTechCharts
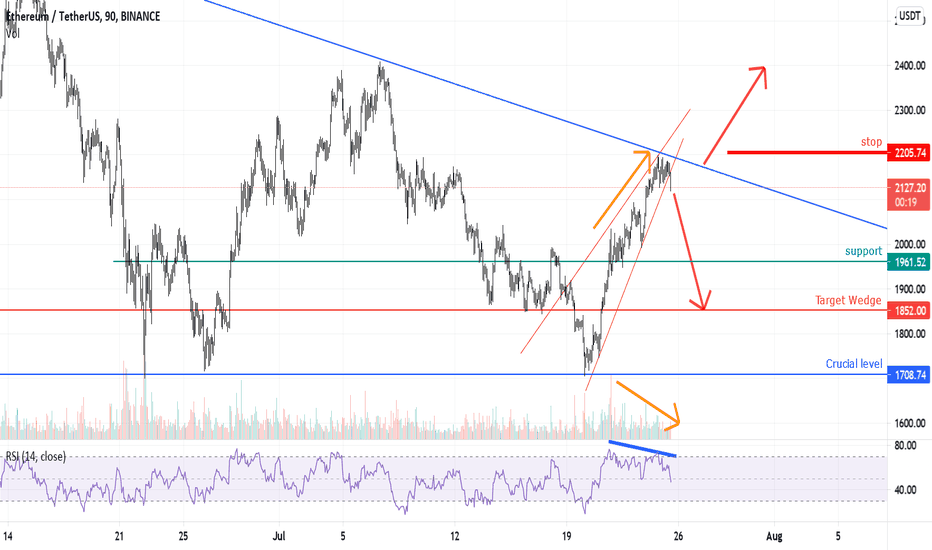
Dear Friends,Ethereum has formed a bearish rising wedge and it has broken out to the downside. The target of the wedge is 1852 USD.If Ethereum breaks out above 2205 this will be the stoploss for the short and it will go to the next level of 2400 usd.We also see the declining trendline which acts as a strong resistance and for a bullish scenario Ethereum need to break this trendline.On the other side, if the support with the triple bottom doesn't hold Ethereum will dive but that is just a possibility which sooner or later can happen. Just be always prepared for a B plan in case things change.In this market I advice to use tight stops.Please share your thoughts and idea's below dear friends. What do you think and why do you think it with or without a chart.I wish you all good luck with trading!Disclaimer This is my view, no advice to buy or sell. Also always do your own research!--->> Dear friends please follow me for updates and give me support with a like 👍 if you like me to continue this work. Thanks 💚Friends just also keep a close eye on the blue trendline. A break of this trendline need more than average volume to buy it. Ideally is to wait for a re-test. If it happens, it would be a very nice bullish signal but we need to be aware of bull traps all the time. The re-test with a tight stop can help in this.Good luck dear friends and I wish you all great profits!Beste vrienden,We got to see here once again how strong market manipulation is in the cryptos. Fortunately, we had a tight stop in place and this was a trade with potential. Why? Because all the rising wedges of late in Bitcoin did what they were supposed to do except now. But against manipulation which often happens when there are low volumes, there is nothing to do against it except your stop loss.friends, I am not taking a position at the moment until it is clear how the situation evolves. I have not a single bias because we can make profits in bull and bear markets. What we have seen in the stockmarkets with new all time highs is only caused by unlimited printing Dolalrs and Euros's by the trillions where a big part is injected indirecly in the markets. As long as this goes on the chance for a real stockmarket crash is zero in my opinion. The crypto markets are different then the stockmarkets but with all new constructions in funds it get more and more correlated. So that is something to keep in mind for the mid to longer term.Good luck dear friends
PegasusTechCharts
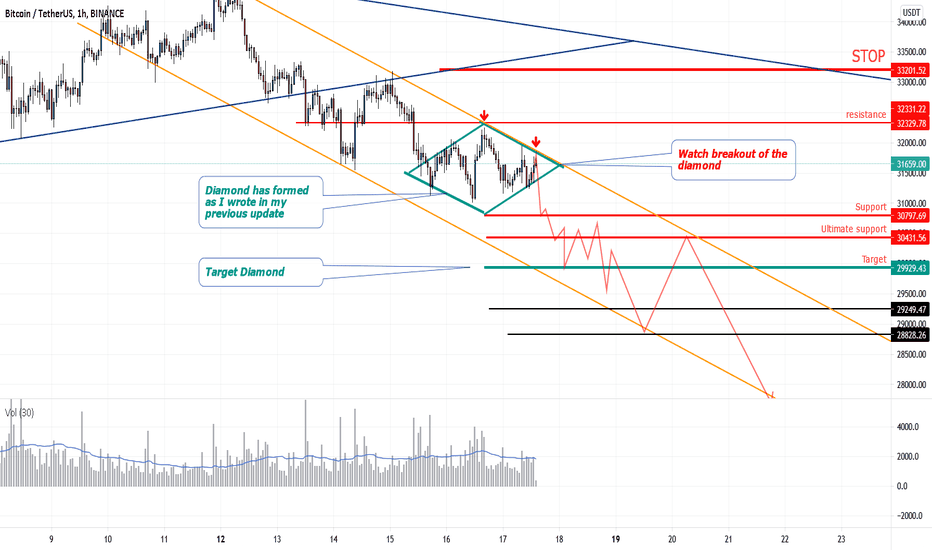
Bitcoin Diamond pattern formed. Watch the breakout!Diamond pattern formed as expected. Dear friends,As I wrote in my previous update, a diamond pattern has indeed been formed. Now look at the breakout. It is expected to be down but if not then the stop level is at 33200.I expect at least 25000 USD as a price target for Bitcoin but it could easily go lower based on the chart at that time. Step by step instead of too long targets. The price and market is dynamic so as a trader you need to adjust yourself continuously.The head and shoulder formations from previous analysis are all valid but they all points to the same target. So be sure to check out the previous updates as well.If you appreciate my work then it's nice to get a like and please follow me for new uodates. Please share your thoughts and idea's below dear friends. What do you think and why do you think it with or without a chart.I wish you all good luck with trading!Disclaimer This is my view, no advice to buy or sell. Also always do your own research!--->> Dear friends please follow me for updates and give me support with a like 👍 if you like me to continue this work. Thanks 💚Of course if the Diamond break to the upside, we possibly get a short pauze in the decline of Bitcoin. The chart will show the direction. Watch always for HH HL LH LL patterns for the trend. Important is that you look for this a t the right timeframe. For example; higher highs and higher lows on a 5 minute chart is not the same as on a 1 hour, 4 hour time frame. Good luck dear friends!Here you see the valid and already re-tested Head and shoulder pattern. What is happening now is that we are on the way to the target.So most patterns you see will be just continuation patterns. Even if not, they will probably just pause the declining price.I redrew the diamond a little bit. That's exactly how it is! Now we just have to wait and see what will happen and what direction the breakout will be. If it is upwards keep in mind a bull trap because we get to see those on a regular basis. Also the trend is still down by the LH and LL.Good luck dear friends!There is no breakout yet and look at the volume. It is declining while price rise.Bearish sign is this.Abreakout must be with good volume and a more than average candle.You can also see a bearish wedge on the right side of the triangle.UpdateDear Friends,The diamond from the previous uodate has broken out upwards but as I already wrote, this is probably a bull trap as we have seen so many. This is because the trend is still down. HH HL LL LH method 4 hour charts. New patterns are formed, a bearflag / bearish rising wedge and a triangle. On you to think about which direction it will go. Wish you all succes and good profits!Good evening dear friends,The diamond is now no longer important. The pattern has now been transformed into a bearflag. This happens constantly, patterns change.For example, a sysmetrical triangle can transform to a ascending triangle. A wedge to a trend channel. A failing head shoulder formation to a wedge etc. I trade what I see and not what I think. No biases, not bearish not bullish either. I don't care at all if it goes up or down as long as you follow the trend!Too many signals and too much information from different sources make it also difficult in special for new traders. However the market is complex and 50% thinks it goes up and 50 % thinks it goes down. That is why the price is in balance.So when does this trend change then? I have indicated that in the chart. When the level of 33129 is broken through with the close of a 4 hour candle things are going to look different. As long as that has not happened there is no rising trend. There can be a rising trend on a shorter time frame. For example on the 15 minute chart but I am talking about the 4 hour timeframe here.The shorter the time frame the more noise and the smaller the moves.Also the volume is low and cannot sustain a rising trend. For that, the volume has to grow while the price is rising. Everything can happen, we will just see what happens and then act as the chart show the direction itselfGood luck dear friends!Weekly candle Here is a weekly chart of Bitcoin. What do you guys think of this red weekly candle. It is a full candle with almost no wick. A wick below the candle is a rejected level.The monthly looks also the same.When in doubt about a trend, zoom out for another look io the price.The neckline of the HS formation and the lower trendline of the bearflag has been broken and the first target is now USD 30000.Good luck dear friendsWhat is next with Bitcoin?Bitcoin has reached our SHORT target and even went down to 29249 usd. Personally, I do not expect the trend to turn positive now. We will see that by the price movement. If Bitcoin sets a higher high then that could be the start of a short-term uptrend but again, I don't expect that.In short:If bitcoin manages to rise above 30000 then the next level is 30430 to max 31000. After that the trend should continue downwards.If bitcoin does not manage to break through the 30000 level then the decline will continue. Don't buy too soon friends because in my opinion the decline is not over yet.Do not forget that 16 months ago the price of one bitcoin was 3850 and this is not a type error;-) As an advice, always do your own research and never trade blindly on any idea!If you use a max risk of 1-2% with automatic stop loss then you have so much less risk to end with a liquidation or zero account. It is maybe not spectacular this 2% max risk but it protect your account! Good luck with trading dear friends and if you like my work please follow me and give me a like which is good for my motivation to continue this work!updateDear friends,This pullback was expected as the 29-30k level is a strong support level. The falling trendline is a strong resistance.Only on a breakout with volume and a pullback to test the red trendline is a LONG position recommended up to 36600. From there, another very heavy resistance awaits.However, I expect a deeper decline from the red descending trend line to at least 28810. Then we should see if this level is broken downwards and we enter a new analysis with much lower targets.If Bitcoin breaks out above the red trend line we can expect a rise to 36600. There I still expect a continuation of the decline again unless the price breaks through upwards there as well. Then the top of the range will come into view again. Eventually we will get another bull market if the price can break through the 42k level with high volume,We are not that far yet and it is also very questionable whether this will happen but the chart and the price dictate the direction. I am not a bull nor a bear just follow and anticipate what can happen. I have not a single bias or emotion if it goes up or down.Eventually we will get another bull market if the price can break through the 42k level with high volume,Good luck dear friends!Short update.Not much changed since the last update. The levels are still valid, the older analysis also.Bitcoin is forming now an inversed Head and shoulders but this is probably not working out because there is no volume anymore. Only with a break trough the blue trendline and a retest the situation improves for the very short time.So it looks like the trend will continue as it was untill we see a move with volume to the upside.Wish you all good trading dear friends!An updateDear friends,If Bitcoin goes through the 33600 then I expect at least a target of 36600 usd. Beware though because bull traps have been many and it could happen here too. The big boys make a game out of it to mislead every trader, therefore, also keep an eye on the trading volume.On a break down from the rising wedge I see the old low again as a target at 28800 but if Bitcoin goes below that, we will get an acceleration to 25000 as the first target. Note an uptrend there is a pullback, not a trend reversal.In short- Upon breakout of the orange trendline and ONLY after a re-test of this tread line LONG to 36600. Risk exists for a bulltrap.- Upon breakout of the wedge downwards AND the black trendline a continuation of the decline to the old low at 28800.Friends, do not go long before a re-test of broken trendline is my advice! The orange trandline is not yet broken but it is very close. Prices always re-test so no need for any fomo or emotions.Watch out for beartraps and that is why a re-test is the only way to play this more safe. Then there are many resistance levels to break as seen in the chart. Once a resistance is broken it become a support level and so the next resistance will be next target.First 33600 then 36600 then 41-42000. After that it will be a nice bullish scenario. But below 28800 we will see a very nasty dive. Just be aware of this!By the way, I have no bias, not bullish, not bearish. Just trade what you see and certainly not what you are thinking of. Succes dear friends!updateDear Friends,To buy or not to buy? That, of course, is entirely everyone's personal choice. In my analysis, my target was almost reached at 400 points. Since then we have again seen a similar price trend as we have seen recently.A divergence has now occurred on the 1 hour chart with the RSI in overbought condition. A pullback is to be expected now. We are also seeing a bearish rising wedge. Be aware that all previous wedges caused a pullback. Will it this time be different? My advice for now is patience until a pullback to at least the neckline of the inversed head and shoulders pattern, then a tight stop loss and target to 36600. Then as explained in the previous update see if this resistance is broken. If yes then Bitcoin will go to the next resistance.We are still in the trading range and will have to deal with complex rises and falls. That is the consequence of this long trading range which in my opinion in Wyckoff means a re-distribution and not an accumulation. Nevertheless there are movements which you can profit from but I only see a solid rise above 42000. One of the things we have seen also in the past is the bull and bear traps. Will it happen this time or not is difficult to say now but you can protect yourself with tight stops. About trends rising or falling an important thing to remember. Which timeframe do you use. On a 15 minute there can be a rising trend perfect to trade where it is on the 4 hour a clear downtrend. The best thing to do is keep it simple! Look at one higher time frame, what is the trend on this higher timeframe and than on the short timeframe wait for a counter trade. That is a pullback. This way you trade with the larger timeframe in your direction and buy pullbacks. That is a very good method only the timeframe sets to trade is personal. Do not forget that the smaller you go the more noise and the more you need constant for your pc to monitorLast but not least, I only give idea's here and not advice to trade because you always have to do your own analysis. Any idea can be helpfull in this but to many idea's will be confusing because at any moment there will be traders who are go for Long setups and others for short setups. Good luck dear friends!Update - Hello friends,Bitcoin is still moving upwards in the wedge with a target 36600. There was no pullback to the neckline yet and there is a bearish divergence so that can happen today. IF Bitcoin cross the level of 36600 then we will probably see the old level 41k however this tradingrange is getting weaker with time a lot of time passing nd there are a lot of resistances to take. Just use tight stops in this market to minimalize the risk for a sudden drop!Succes dear friends and if you like my work please give me a like or follow for updates!Dear friends,On the daily timeframe we see there is a wedge in combination with declining volume. That is a bearish sign. The neckline still need to be re-tested so that would come in not as surprise.
PegasusTechCharts
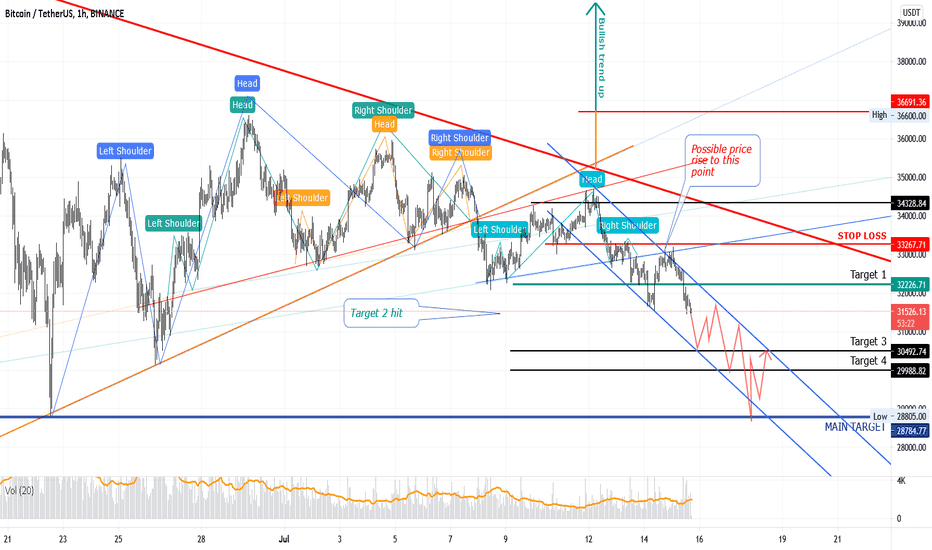
Bitcoin The effect of many Head and shoulders formations!Here we are looking at the 90 minute chart of Bitcoin dear friends.Bitcoin has made another lower high and lower low and so we are very likely going to descend further into the blue trend channel. The trend is your friend and the trend is down!The red trajectory is how it could go but it could also go faster. The real panic will not occur until we drop through the bottom at 28805.I definitely see that happening because most traders think that is where the bottom is. I don't think so but as you are already used to, I prefer not to make long term predictions because as a trader you can't do anything with them. Just step by step and review the situation every time. If Bitcoin shows bullish signs and form a bottem pattern there would be more then enough time to go long. Do not think that Bitcoin is going the fly right now. The tot market cap is also declining wich is all together bearish.First Taget and second target is 30500 and 30000.Then we are heading to the main target of 28805Volume is increasing in the decline and only confirms the bearish price action.My previous analyses with several larger head shoulder formations are all still valid but on this chart you can follow better the current action!No long term prediction but trade what you see that is easy on your mind and gives no conflicts!Please share your thoughts and idea's below dear friends. What do you think and why do you think it with or without a chart.I wish you all good luck with trading!Disclaimer This is my view, no advice to buy or sell. Also always do your own research!--->> Dear friends please follow me for updates and give me support with a like 👍 if you like me to continue this work. Thanks 💚Btc is forming a bearish rising wedge on smaller timeframe. Trend is down.Succes friends!Testing the neckline and then the decline ;-)Important!Dear friends, We see Bitcoin made a bearish wedge and also a expanding triangle. I think the expanding triangle could transform to a diamond pattern but it is still very premature to say. It will be more clear with time. If Bitcoin break the trendchannel that could be a warning but to change the downtrend we need to look at the 4 hour chart and the last high need to be taken out = 33300. After that there need to be a higher low and that would be the signal to go long. That lower low can be confirmed with a bullish 4 hour candlestick, a double bottom and so on. I do not expect it but only price will tell. Succes with trading!Dear friends,We continue the uodates now on the newest post.
PegasusTechCharts
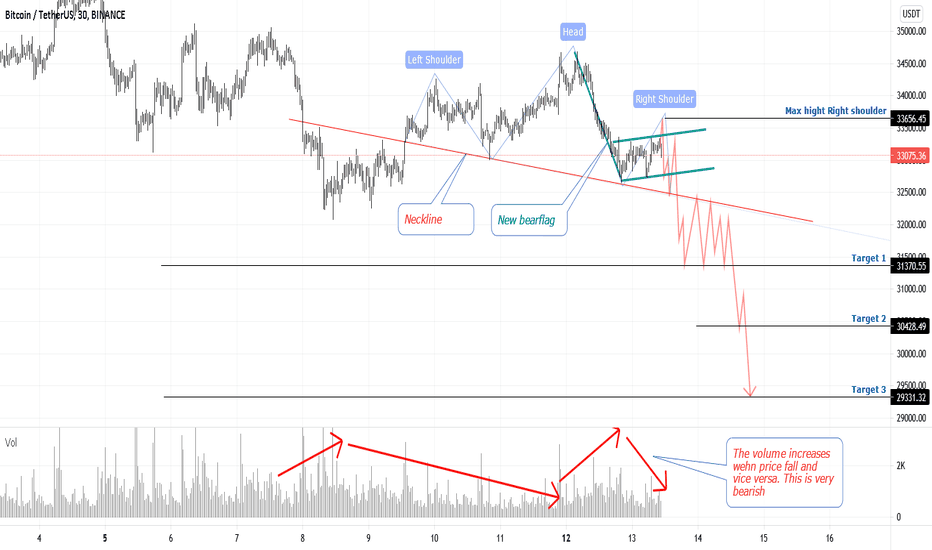
Bticoin 30 minute chart New Patterns - Check it out!Hello dear friends and traders,There are some new developments on Bitcoin's 30 minute chart.Bitcoin has already formed a Bearflag and is moving in this pattern. We also see the formation of a Head shoulder formation. I expect up to 33700 as the highest point for the right shoulder, After breaking through the neckline we see the following targets:314003050029400My previous analyses with several larger head shoulder formations are all still valid!No long term prediction but trade what you see that is easy on your mind and gives no conflicts!Please share your thoughts and idea's below dear friends. What do you think and why do you think it with or without a chart.I wish you all good luck with trading!Disclaimer This is my view, no advice to buy or sell. Also always do your own research!--->> Dear friends please follow me for updates and give me support with a like 👍 if you like me to continue this work. Thanks 💚You can see that every time the price goes up, the volume goes down. When the price goes down, the volume goes up. Should the price rise then we need to see volume to confirm it otherwise it is a move which will not continue.This behaviour is extremely bearish so I would not really hope that things will go up. If it happens we want good volume and some levels broken first. Preferable with a daily candle, even better 2 of them.Succes my dear friends! Don't forget your stops in place ;-)Bitcoin has formed a new minor bearflag and is now testing its lower trendline. The HS formation has not yet been broken at this time. Volume is bearish due to drop in volume when price rises and vice versa. See the red arrows in the chart and compare it to the price above it.The overall picture of Bitcoin looks very bearish but we have seen that in the other charts I have posted.My previous analyses with various larger head shoulder formations are all still valid!Good luck dear friendsUpdateYes indeed, again a new small bearish rising wedge. We have now 3 of them and we see also 2 extra HS fromations besides the 3 from my previous analyse! The 3 bigger also valid. First targets in this chart 32226 - 31512 - 30492. + Targets from previous posts.Good luck dear friends!Target 1 has been met and target 2 has been met! and now on to target 3! Good day dear friends!The Last HS formations are slightly redrawn and still perfectly valid. Just like the 3 major HS formations from my previous analyses.Bitcoin is still in a downward trend channel. The neckline of the blue HS has already been retested, that of the orange could possibly be re-tested as well.I expect a further decline and only at 33400 where the new stoploss lies will things improve. Good luck and always trade with a stop loss.New bearish rising wedge.Good afternoon dear friends!Please look at the chart. Bitcoin formed a bearish rising wedge. IT is also at the point for the re-tests of the neckline again. BTC moves in the downward trendchannel.A break above the red trendline will probably trigger a move to the upper side of the green channel. If it bounce on the red trendline which is the expected move it will continue to decline.Wish you succes and profits!The bearflagThe bearflag has been broken so normally continuation of the downtrend.Succes dear friends!Diamond/ Inv HSGoodevening dear friends!A small update here from Bitcoin We see a small Inverted HS and a Diamond topping pattern.Watch out for the breakout. The bigger HS formations are still in play from my previous analysis.If green trendline is broken target we see probably the top of the channel in green.But look at the volume! No volume = no valid move! Keep an eye on the levels and wish you succes dear friends!The downward trend continues.As you all know from the analyses, I have no doubt about the direction of BTC, it is still short. Very first target is of course the low of last time at 28800 and there you can expect a rebound of the price but now the target of 25000 is fast approaching. Catching a falling knife can result in a big loss. Before going long you need confirmation.Good luck with trading dear friends!Important!Dear friends, We see Bitcoin made a bearish wedge and also a expanding triangle. I think the expanding triangle could transform to a diamond pattern but it is still very premature to say. It will be more clear with time. If Bitcoin break the trendchannel that could be a warning but to change the downtrend we need to look at the 4 hour chart and the last high need to be taken out = 33300. After that there need to be a higher low and that would be the signal to go long. That lower low can be confirmed with a bullish 4 hour candlestick, a double bottom and so on. I do not expect it but only price will tell. Succes with trading!Dear friends,We continue the uodates now on the newest post.
PegasusTechCharts
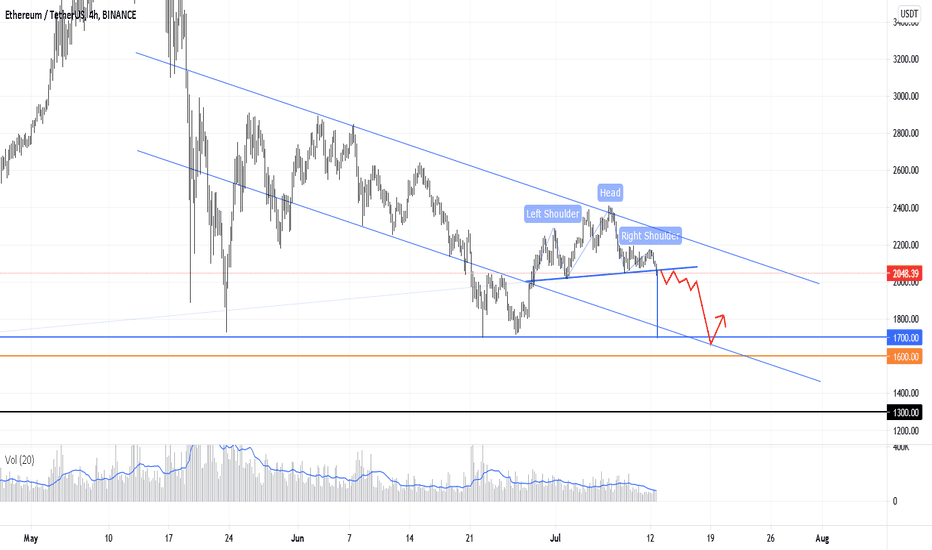
Ethereum HS Formation - Targets 1700 - 1600 - 1300Dear friendsEthereum has completed a head shoulder formation and we see as first targets 1700 - 1600 and 1300.The neckline of this HS formation has already been broken and Ethereum moves downwards in the trendchannel. Traders have become extremely cautious after all the liquidations of accounts during violent declines and that make the chance for a rise smaller and smaller.Normally the price returns to the neckline after a first decline. The question is now, does it stop after the first target is reached. If ETH goes lower than that an important key level is broken and we will probably see lower targets soon.Please share your thoughts and idea's below dear friends. What do you think and why do you think it with or without a chart.I wish you all good luck with trading guys!Disclaimer: this is my view, no advice to buy or sell. Also always do your own research!--->> Dear friends please follow me for updates and give me support with a like 👍 if you like me to continue this work. Thanks 💚Good day my dear friends!I expect a re-test of the neckine now and then a further decline. Take care for the bul traps. For the moment there is no bullish scenario, not in Bitcoin and not in Ethereum. Of course this can change but then certain levels need to be broken. For example the right shoulder of the HS in Ethereum but a break trough the neckline with high volume is also a signal.Succes and happy trading!Retest necklineGood afternoon dear friends,Here a little uodate so you can follow the price via the chart.Ethereum has broken through the neckline of the head and shoulders formation and is now retesting it. Short positions around the neckline with a stop at the 2203 which is the high of the right shoulder is what I personally should do. Also note the volume again as we sere it also in Bitcoin and other alt coins. Rising volume with falling price and vice versa. Extreme bearish behavior.Trend only change when we set a higher high and a higher low.See also the Bitcoin posts because if Bitcoin goes down, the rest will follow!Ethereum is on the way to the target:A new updateA new update. We are almost at the projected target but if Ethereum break out of the falling wedge, the target will be on a small pause.Succes dear friends!Dear friends,This trade is closed because the profittarget was reached/Total profit 17.48%Price will now likely retest the strong resistance first,If there is a new trade I will post it as a new idea.Thanks dear friends!
PegasusTechCharts
Bitcoin simple but powerful analysis with bullish bearish levelsDear friends,A different and very simple look at Bitcoin with the different bullish and bearish levels. Also posted so that you can follow it with the button in te screen to update the chart.This can be short but powerful. The simpler the better! Please note that my previous analyses are just still valid including the levels. This is just another simple view of Bitcoin, the other posts show the patterns etc.Above the green horizontal trend line there is a bullish scenario, below the orange trend line at 28805 a clear bear market with much lower levels. Above 35146 we have a higher high and below 32000 a lower low.We have the following bearish patterns (see it in my other posts)1. 3X HS formaties2 a larger bearflag3. A series of lower highs and lower lows.4 The red trendline connecting the lows which is extremely important was broken . 5. Once again declining volume with rising priceNote how during the decline the volume went up and during the last rise the volume went down. When you see something like that it is normally just bearish.A rise without volume will collapse under the force of gravity.Also take into account sudden interventions of whales and large funds. That is the only thing that can disturb the TA on the smaller timeframes.It now strongly looks like we are going to test the low again and maybe even drop below it. However, it is far too early now to judge that. The market is dynamic and anything can change. Therefore, step by step. No long term predictions that will be of little or no use to you at this time. After all, you want to make a profit now. It's good to have the fundamentals in your mind but it is important that it immediately not affect your trading from charts. If so, you won't be able to go on trading because of the many contradictions. As an advice, do not risk more than max 2% of your capital on the whole of your trades. The Crypto market moves together so 4 positions of 0.5 % risk is already the max of 2%! Of course many will not keep these numbers but is is a fact that without this you have a much higher chance of getting a zero account. The power of compounding smaller profits is the key for your total capital.Please share your thoughts and idea's below dear friends. What do you think and why do you think it with or without a chart.I wish you all good luck with trading guys!Disclaimer Traders this is my view, no advice to buy or sell. Also always do your own research!--->> Traders please follow me for updates and give me support with a like 👍 if you like me to continue this work. Thanks 💚A zoomed-in view. A zoomed-in view. An Important point is highlighted.ImportantDear Friends,Currently Bitcoin is still perfectly following the purple Rising wedge Beearflag. I expect it to break out downwards but only when the international markets reopen. If Bitcoin break upwards then that looks to me like yet another bulltrap! So beware of it because it happened several times and BTC is famous for it.When is it safe to go long? For that we first need to set a higher high and and higher low. So first of all above 35200. But then we need to set another higher low.In short.+34500 is a bullish signal but not to go long.+36000 is a clear improvement.+36800 The trend has reversed, after a re-test of 36800 Long positions are indicated but with a target of max 41-42000 USD.I don't expect BTC to go above +36800 and not even +36000 but if so we will follow charts. Why I don't expect it is because of the clear technical picture. The volume which is very low. There is absolutely no drive to be seen that people want to go full long. If there is a breakout upwards then as we have seen before it will come from a whale or large fund to manipulate again.Above 36800 with the close of at least a 4 hour candle is the signal and would mean we are heading towards 41000 /42000 again but unfortunately another huge resistance awaits there. Only above the trading range and after a pullback to retest it, the picture has changed completely to bullish and we can at least go to the old top. So step by step see what happens and don't act sooner or let yourself be lured into a trap is the message here.Happy trading dear friends and succes!UPDATEDear friends,I do not expect it but possible the price can still rise to a maximum of 34500 till 35200 usd. That does noet change the bearish picture at all and all the levels remain exactly the same.The volume has decreased again in the last rise so that is another bearish signal. All patterns are also still perfectly valid. Patience, patience, patience ;-)Tonight or tomorrow will bring clarity in my opinion. See you later friends!UpdateDear Friends,Bitcoin has already formed another bearish rising wedge. I think this time it is going down a little faster because of the price movements that were getting smaller and smaller. The volume is also ultra low so a rise has little support. The Rsi is not cooperating either.As I wrote earlier, a big move is coming and most likely not upwards. Here is also a chart showing a possible trajectory. Bitcoin should show movement but whether it happens right away we will have to wait and see. The chart here is how it could go and not a guarantee. The market is dynamic and if Bitcoin starts to rise again we will adjust the strategy as exactly described with the levels in the previous analyses still perfectly valid at this time!We will follow the chart and take it step by step without long term predictions which won't help you at this point anyway.Good luck and don't forget the stops dear friends!All the Head and shoulders patterns are still doing their job and still are valid.Bitcoin has formed a new minor bearflag and is now testing its lower trendline. The HS formation has not yet been broken at this time. Volume is bearish due to drop in volume when price rises and vice versa. See the red arrows in the chart and compare it to the price above it.The overall picture of Bitcoin looks very bearish but we have seen that in the other charts I have posted.My previous analyses with various larger head shoulder formations are all still valid!Good luck dear friendsUpdateYes indeed, again a new small bearish rising wedge. We have now 3 of them and we see also 2 extra HS fromations besides the 3 from my previous analyse! The 3 bigger also valid. First targets in this chart 32226 - 31512 - 30492. + Targets from previous posts.Good luck dear friends!Target 1 has been met and target 2 has been met! and now on to target 3! Good day dear friends!The Last HS formations are slightly redrawn and still perfectly valid. Just like the 3 major HS formations from my previous analyses.Bitcoin is still in a downward trend channel. The neckline of the blue HS has already been retested, that of the orange could possibly be re-tested as well.I expect a further decline and only at 33400 where the new stoploss lies will things improve. Good luck and always trade with a stop loss.New bearish rising wedge.Good afternoon dear friends!Please look at the chart. Bitcoin formed a bearish rising wedge. IT is also at the point for the re-tests of the neckline again. BTC moves in the downward trendchannel.A break above the red trendline will probably trigger a move to the upper side of the green channel. If it bounce on the red trendline which is the expected move it will continue to decline.Wish you succes and profits!The bearflagThe bearflag has been broken so normally continuation of the downtrend.Succes dear friends!Diamond/ Inv HSGoodevening dear friends!A small update here from Bitcoin We see a small Inverted HS and a Diamond topping pattern.Watch out for the breakout. The bigger HS formations are still in play from my previous analysis.If green trendline is broken target we see probably the top of the channel in green.But look at the volume! No volume = no valid move! Keep an eye on the levels and wish you succes dear friends!The downward trend continues.As you all know from the analyses, I have no doubt about the direction of BTC, it is still short. Very first target is of course the low of last time at 28800 and there you can expect a rebound of the price but now the target of 25000 is fast approaching. Catching a falling knife can result in a big loss. Before going long you need confirmation.Good luck with trading dear friends!Important!Dear friends, We see Bitcoin made a bearish wedge and also a expanding triangle. I think the expanding triangle could transform to a diamond pattern but it is still very premature to say. It will be more clear with time. If Bitcoin break the trendchannel that could be a warning but to change the downtrend we need to look at the 4 hour chart and the last high need to be taken out = 33300. After that there need to be a higher low and that would be the signal to go long. That lower low can be confirmed with a bullish 4 hour candlestick, a double bottom and so on. I do not expect it but only price will tell. Succes with trading!Dear friends,We continue the uodates now on the newest post.
PegasusTechCharts
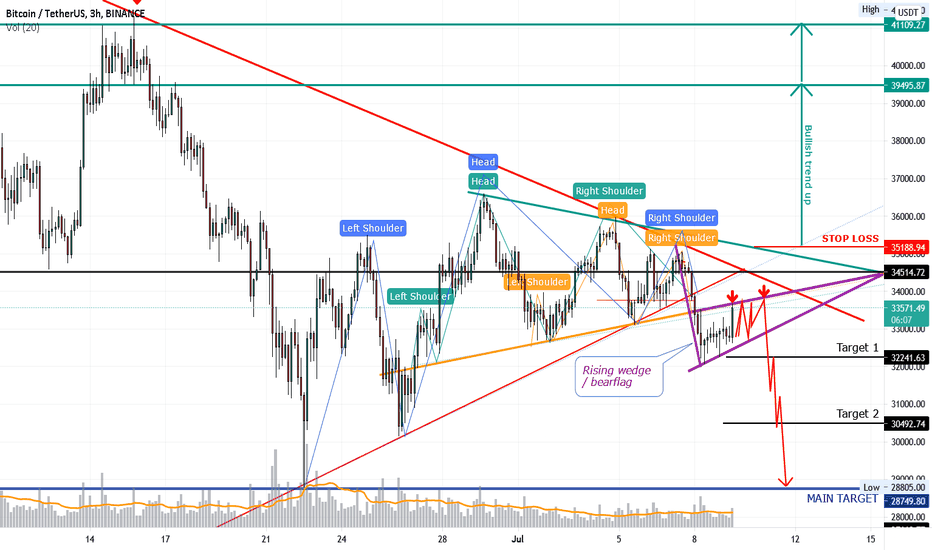
Bitcoin 3x head and shoulders + bearflag / bearish rising wedge + triangle. All patterns confirmed and validDear friends,As I expected, Bitcoin is forming a bearflag / bearish rising wedge (purple) . Yes unique because there are now 3 bearish head shoulder formations actif at the same time of which in all three the neckline has been broken.Currently, Bitcoin is re-testing the orange neckline of a smaller HS formation. Bitcoin formed under the main trend and necklines also the bearish purple rising wedge / bearflag.This picture looks pretty bearish. I expect around 34000 max 34500 another decline with the following targets.32250305002880028800 is extremely important. If BTC not hold this level we will sink much deeper. and we get 27500 and 25000 as first targets. If the price breaks through the red descending trend line with good volume that is a warning. If then BTC breaks through the green triangle trend line a second warning. Above 35200 there is a possible bullish scenario with target 39500 - 41500. This is because we set a higher high. Of course going long only after a pullback with confirmation of a higher low!If you look at this chart, a bearish flag/ rising wedge under a broken trendline in combination with 3 HS formations. It need to get very crazy if it breaks to the upside but we just follow what happens. This scenario is most likely, what do you think?Please share your thoughts and idea's below dear friends. What do you think and why do you think it with or without a chart.I wish you all good luck with trading!Disclaimer Traders this is my view, no advice to buy or sell. Also always do your own research!--->> Traders please follow me for updates and give me support with a like 👍 if you like me to continue this work. Thanks 💚UPDATE Dear Friends,An update on Bitcoin with slightly redrawn repositioned neckline and bear flag (purple).I have slightly repositioned the neckline of the hs formation but it is still perfectly valid. The price can possibly go up to 34500. Does BTC break higher then there is a warning zone. Only above 36700 we have set a higher high but then at least a pulback has to happen to go long.However, I expect the price to bounce off and fall further. I expect this due to the following reasons.1. 3X HS formaties2 a larger bearflag3. Inside the purple bearflag we see a bearish rising wedge(red)4 The red trendline connecting the lows which is extremely important was broken . 5. Once again declining volume with rising price6. A series of lower highs and lower lows.New we also see now clearly that btc has formed a bearish rising wedge in the bearflag as well. Can it be more bearish?Stop loss for this short is 35250 the targets 32240 - 30500 and 28750.There are so many factors that point to this trade succeeding but if it doesn't then it is due to manipulation of large funds because technically the picture is right on all counts.Good luck dear friends and don't forget the stop loss and the 1-2% money management rule!Looking at the candlesticks we clearly see signs again that it is going down quickly with Bitcoin unless there is intervention by a big party. We know this happens and that can disrupt everything but under normal circumstances it runs as we see in the charts.Don't forget the important rule; lower highs, lower lows. This is the most simplistic and powerful definition of the trend. When we set a higher high we are still not ready for long positions. We first have to set first a higher low after that higher high. That is then the moment to go long. That moment can be a trendline break, a bullish candle on smaller time frame, a double bottom and so on.Good luck dear friends!A zoomed-in view. A zoomed-in view. An Important point is highlighted.Dear friends,Do not forget to also check this chart. It is simple with clear targets for going long or short. I does not need to be complicated ;-)ImportantDear Friends,Currently Bitcoin is still perfectly following the purple Rising wedge Beearflag. I expect it to break out downwards but only when the international markets reopen. If Bitcoin break upwards then that looks to me like yet another bulltrap! So beware of it because it happened several times and BTC is famous for it.When is it safe to go long? For that we first need to set a higher high and and higher low. So first of all above 35200. But then we need to set another higher low.In short.+34500 is a bullish signal but not to go long.+36000 is a clear improvement.+36800 The trend has reversed, after a re-test of 36800 Long positions are indicated but with a target of max 41-42000 USD.I don't expect BTC to go above +36800 and not even +36000 but if so we will follow charts. Why I don't expect it is because of the clear technical picture. The volume which is very low. There is absolutely no drive to be seen that people want to go full long. If there is a breakout upwards then as we have seen before it will come from a whale or large fund to manipulate again.Above 36800 with the close of at least a 4 hour candle is the signal and would mean we are heading towards 41000 /42000 again but unfortunately another huge resistance awaits there. Only above the trading range and after a pullback to retest it, the picture has changed completely to bullish and we can at least go to the old top. So step by step see what happens and don't act sooner or let yourself be lured into a trap is the message here.Happy trading dear friends and succes!UPDATEDear friends,I do not expect it but possible the price can still rise to a maximum of 34500 till 35200 usd. That does noet change the bearish picture at all and all the levels remain exactly the same.The volume has decreased again in the last rise so that is another bearish signal. All patterns are also still perfectly valid. Patience, patience, patience ;-)Tonight or tomorrow will bring clarity in my opinion. See you later friends!UpdateDear Friends,Bitcoin has already formed another bearish rising wedge. I think this time it is going down a little faster because of the price movements that were getting smaller and smaller. The volume is also ultra low so a rise has little support. The Rsi is not cooperating either.As I wrote earlier, a big move is coming and most likely not upwards. Here is also a chart showing a possible trajectory. Bitcoin should show movement but whether it happens right away we will have to wait and see. The chart here is how it could go and not a guarantee. The market is dynamic and if Bitcoin starts to rise again we will adjust the strategy as exactly described with the levels in the previous analyses still perfectly valid at this time!We will follow the chart and take it step by step without long term predictions which won't help you at this point anyway.Good luck and don't forget the stops dear friends!This is the original post updated.All the Head and shoulders patterns are still doing their job and still are valid.Bitcoin has formed a new minor bearflag and is now testing its lower trendline. The HS formation has not yet been broken at this time. Volume is bearish due to drop in volume when price rises and vice versa. See the red arrows in the chart and compare it to the price above it.The overall picture of Bitcoin looks very bearish but we have seen that in the other charts I have posted.My previous analyses with various larger head shoulder formations are all still valid!Good luck dear friendsUpdateYes indeed, again a new small bearish rising wedge. We have now 3 of them and we see also 2 extra HS fromations besides the 3 from my previous analyse! The 3 bigger also valid. First targets in this chart 32226 - 31512 - 30492. + Targets from previous posts.Good luck dear friends!Target 1 has been met and target 2 has been met! and now on to target 3! Good day dear friends!The Last HS formations are slightly redrawn and still perfectly valid. Just like the 3 major HS formations from my previous analyses.Bitcoin is still in a downward trend channel. The neckline of the blue HS has already been retested, that of the orange could possibly be re-tested as well.I expect a further decline and only at 33400 where the new stoploss lies will things improve. Good luck and always trade with a stop loss.New bearish rising wedge.Good afternoon dear friends!Please look at the chart. Bitcoin formed a bearish rising wedge. IT is also at the point for the re-tests of the neckline again. BTC moves in the downward trendchannel.A break above the red trendline will probably trigger a move to the upper side of the green channel. If it bounce on the red trendline which is the expected move it will continue to decline.Wish you succes and profits!The bearflagThe bearflag has been broken so normally continuation of the downtrend.Succes dear friends!Diamond/ Inv HSGoodevening dear friends!A small update here from Bitcoin We see a small Inverted HS and a Diamond topping pattern.Watch out for the breakout. The bigger HS formations are still in play from my previous analysis.If green trendline is broken target we see probably the top of the channel in green.But look at the volume! No volume = no valid move! Keep an eye on the levels and wish you succes dear friends!The downward trend continues.As you all know from the analyses, I have no doubt about the direction of BTC, it is still short. Very first target is of course the low of last time at 28800 and there you can expect a rebound of the price but now the target of 25000 is fast approaching. Catching a falling knife can result in a big loss. Before going long you need confirmation.Good luck with trading dear friends!Important!Dear friends, We see Bitcoin made a bearish wedge and also a expanding triangle. I think the expanding triangle could transform to a diamond pattern but it is still very premature to say. It will be more clear with time. If Bitcoin break the trendchannel that could be a warning but to change the downtrend we need to look at the 4 hour chart and the last high need to be taken out = 33300. After that there need to be a higher low and that would be the signal to go long. That lower low can be confirmed with a bullish 4 hour candlestick, a double bottom and so on. I do not expect it but only price will tell. Succes with trading!Dear friends,We continue the uodates now on the newest post.
PegasusTechCharts
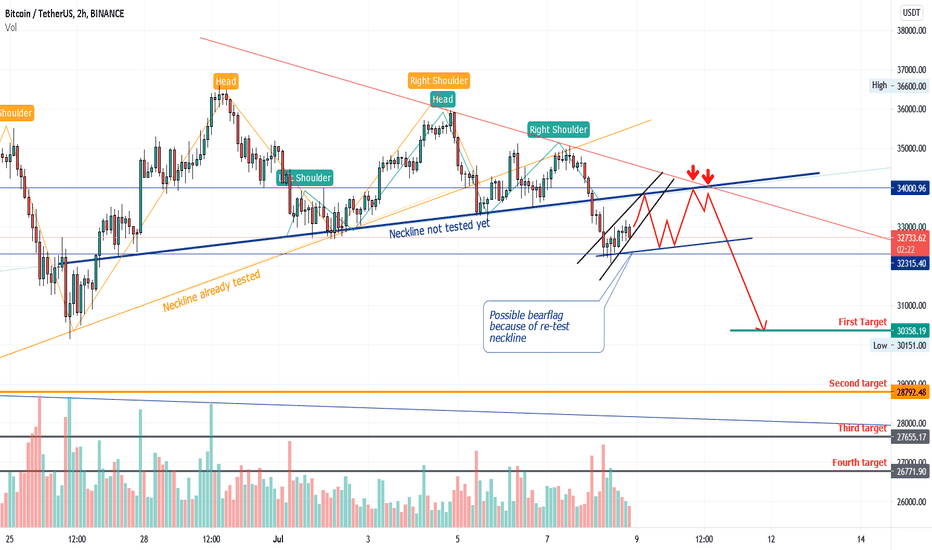
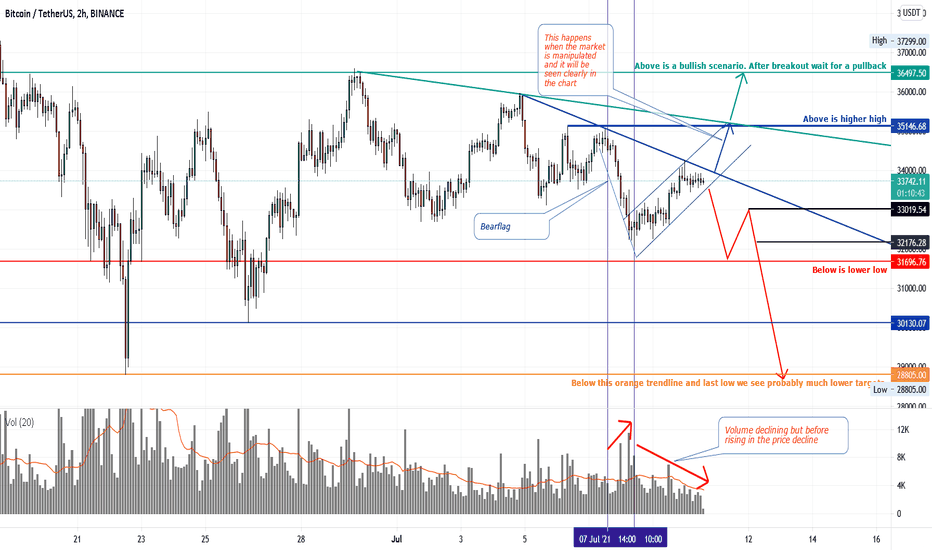
Dear friends,Here is an update of Bitcoin on the 2 hour chart.Be sure to check out my previous analysis as this one is an addendum to the previous one that is still valid.Bitcoin has fallen through the neckline of the HS formation (orange) and has successfully re-tested this line.The second HS formation (green) is also valid and the price has already fallen through that neckline. I expect a re-test of that neckline at 33800-34000. Maybe BTC don't even have the force to go that high as volume decreases while price increases. That is always bearish!After the (possible) re-test, the following targets come into the picture.30350, 28800, 27655 and possibly 26771.Should Bitcoin rise above the red triangle trendline than that is a bullish sign but still not enough. We clearly need higher highs and higher lows to change the trend! I do not expect it however but you never know with the heavy manipulation of the markets. Nothing is 100% sure in TA but this seems very likely. Please share your thoughts and idea's below dear friends. What do you think and why do you think it with or without a chart.I wish you all good luck with trading!Disclaimer Traders this is my view, no advice to buy or sell. Also always do your own research!--->> Traders please follow me for updates and give me support with a like 👍 if you like me to continue this work. Thanks 💚UpdateA zoomed-in view. An Important point is highlighted.ImportantDear Friends,Currently Bitcoin is still perfectly following the purple Rising wedge Beearflag. I expect it to break out downwards but only when the international markets reopen. If Bitcoin break upwards then that looks to me like yet another bulltrap! So beware of it because it happened several times and BTC is famous for it.When is it safe to go long? For that we first need to set a higher high and and higher low. So first of all above 35200. But then we need to set another higher low.In short.+34500 is a bullish signal but not to go long.+36000 is a clear improvement.+36800 The trend has reversed, after a re-test of 36800 Long positions are indicated but with a target of max 41-42000 USD.I don't expect BTC to go above +36800 and not even +36000 but if so we will follow charts. Why I don't expect it is because of the clear technical picture. The volume which is very low. There is absolutely no drive to be seen that people want to go full long. If there is a breakout upwards then as we have seen before it will come from a whale or large fund to manipulate again.Above 36800 with the close of at least a 4 hour candle is the signal and would mean we are heading towards 41000 /42000 again but unfortunately another huge resistance awaits there. Only above the trading range and after a pullback to retest it, the picture has changed completely to bullish and we can at least go to the old top. So step by step see what happens and don't act sooner or let yourself be lured into a trap is the message here.Happy trading dear friends and succes!UPDATEDear friends,I do not expect it but possible the price can still rise to a maximum of 34500 till 35200 usd. That does noet change the bearish picture at all and all the levels remain exactly the same.The volume has decreased again in the last rise so that is another bearish signal. All patterns are also still perfectly valid. Patience, patience, patience ;-)Tonight or tomorrow will bring clarity in my opinion. See you later friends!UpdateDear Friends,Bitcoin has already formed another bearish rising wedge. I think this time it is going down a little faster because of the price movements that were getting smaller and smaller. The volume is also ultra low so a rise has little support. The Rsi is not cooperating either.As I wrote earlier, a big move is coming and most likely not upwards. Here is also a chart showing a possible trajectory. Bitcoin should show movement but whether it happens right away we will have to wait and see. The chart here is how it could go and not a guarantee. The market is dynamic and if Bitcoin starts to rise again we will adjust the strategy as exactly described with the levels in the previous analyses still perfectly valid at this time!We will follow the chart and take it step by step without long term predictions which won't help you at this point anyway.Good luck and don't forget the stops dear friends!All patterns still valid and doing their job.Bitcoin has formed a new minor bearflag and is now testing its lower trendline. The HS formation has not yet been broken at this time. Volume is bearish due to drop in volume when price rises and vice versa. See the red arrows in the chart and compare it to the price above it.The overall picture of Bitcoin looks very bearish but we have seen that in the other charts I have posted.My previous analyses with various larger head shoulder formations are all still valid!Good luck dear friendsUpdateYes indeed, again a new small bearish rising wedge. We have now 3 of them and we see also 2 extra HS fromations besides the 3 from my previous analyse! The 3 bigger also valid. First targets in this chart 32226 - 31512 - 30492. + Targets from previous posts.Good luck dear friends!Target 1 has been met and target 2 has been met! and now on to target 3! Good day dear friends!The Last HS formations are slightly redrawn and still perfectly valid. Just like the 3 major HS formations from my previous analyses.Bitcoin is still in a downward trend channel. The neckline of the blue HS has already been retested, that of the orange could possibly be re-tested as well.I expect a further decline and only at 33400 where the new stoploss lies will things improve. Good luck and always trade with a stop loss.New bearish rising wedge.Good afternoon dear friends!Please look at the chart. Bitcoin formed a bearish rising wedge. IT is also at the point for the re-tests of the neckline again. BTC moves in the downward trendchannel.A break above the red trendline will probably trigger a move to the upper side of the green channel. If it bounce on the red trendline which is the expected move it will continue to decline.Wish you succes and profits!Diamond/ Inv HSGoodevening dear friends!A small update here from Bitcoin We see a small Inverted HS and a Diamond topping pattern.Watch out for the breakout. The bigger HS formations are still in play from my previous analysis.If green trendline is broken target we see probably the top of the channel in green.But look at the volume! No volume = no valid move! Keep an eye on the levels and wish you succes dear friends!The downward trend continues.As you all know from the analyses, I have no doubt about the direction of BTC, it is still short. Very first target is of course the low of last time at 28800 and there you can expect a rebound of the price but now the target of 25000 is fast approaching. Catching a falling knife can result in a big loss. Before going long you need confirmation.Good luck with trading dear friends!Important!Dear friends, We see Bitcoin made a bearish wedge and also a expanding triangle. I think the expanding triangle could transform to a diamond pattern but it is still very premature to say. It will be more clear with time. If Bitcoin break the trendchannel that could be a warning but to change the downtrend we need to look at the 4 hour chart and the last high need to be taken out = 33300. After that there need to be a higher low and that would be the signal to go long. That lower low can be confirmed with a bullish 4 hour candlestick, a double bottom and so on. I do not expect it but only price will tell. Succes with trading!Dear friends,We continue the uodates now on the newest post.
Disclaimer
Any content and materials included in Sahmeto's website and official communication channels are a compilation of personal opinions and analyses and are not binding. They do not constitute any recommendation for buying, selling, entering or exiting the stock market and cryptocurrency market. Also, all news and analyses included in the website and channels are merely republished information from official and unofficial domestic and foreign sources, and it is obvious that users of the said content are responsible for following up and ensuring the authenticity and accuracy of the materials. Therefore, while disclaiming responsibility, it is declared that the responsibility for any decision-making, action, and potential profit and loss in the capital market and cryptocurrency market lies with the trader.