
Peet_Serfontein
@t_Peet_Serfontein

What symbols does the trader recommend buying?
Purchase History
پیام های تریدر
Filter
Peet_Serfontein
AMZN: M-top pattern?
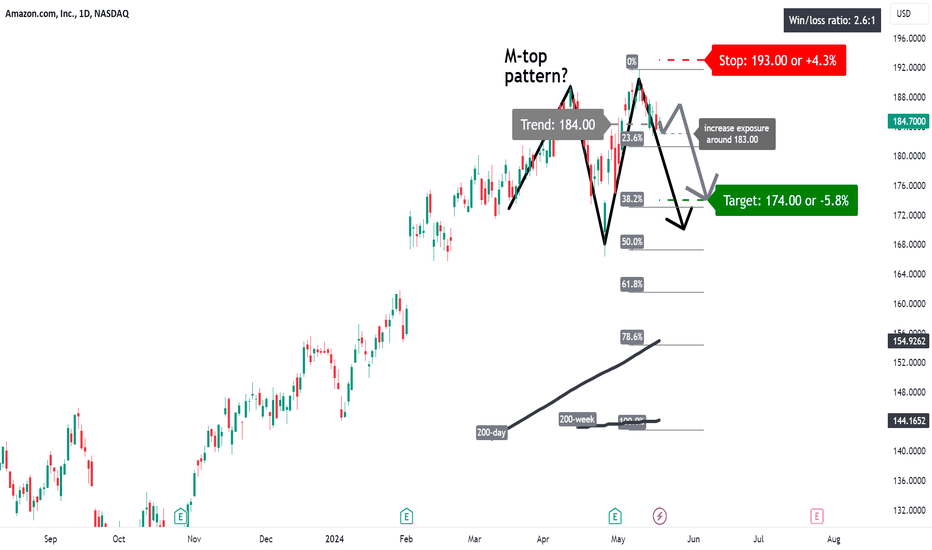
A price action below 184.00 supports a bearish trend direction. Increase short exposure for a break below 183.00. The target price is set at 174.00 (its 38.2% Fibonacci retracement level). The stop-loss price is set at 193.00 (the start of the retracement). It will appear that an M-top pattern is busy developing. Remains a risky trade.
Peet_Serfontein
XMRUSD: falling wedge pattern

A price action above 141 supports a bullish trend direction. Increase long exposure for a break above 150. This level is also the 61.8% Fibonacci retracement level. The target price is set at 163 (its 78.6% Fibonacci retracement level). The stop-loss level is set at 129 (just below its 38.2% retracement level). It will appear that a falling wedge pattern is busy developing. Such a pattern is bullish in nature.
Peet_Serfontein
XMRUSD: bounce-back price action?

A price action above 128.00 supports a bullish trend direction. Increase long exposure for a break above 139.00 (its 50% Fibonacci retracement level). The target price is set at 152.00 (just above its 61.8% retracement, which is also close to its 200-day simple moving average). The stop-loss is set at 117.00 (is 23.6% Fibonacci retracement level). Remains a risky trade.
Peet_Serfontein
ZEDUSD: remains above key support

ZEDUSD: remains above key support A price action above 29.00 supports a bullish trend direction. Increase long exposure for a break above 31.50. The target price is set at 33.50. The stop-loss price is set at 27.50. Remains above its 200-day simple moving average. Remaining above this key support will confirm a bullish long-term trend. Re-test of the 200-day also seems likely.
Peet_Serfontein
Bitcoin $: back to support?

Bitcoin $: back to support? 1. Trend Level - 26800: The chart showcases a significant trend level at the 26800 mark. This price point seems to be pivotal. 2. Moving Averages: Two noteworthy moving averages have been marked – the 200-day and the 200-week. The recent price action shows Bitcoin testing these moving averages, indicating they are acting as dynamic resistance levels. 3. Fibonacci Retracement Levels: Bitcoin appears to be trading around the 78.6% Fibonacci retracement level. This level can act as a strong resistance, and the price's behaviour around it is crucial for determining future momentum. 4. Downside Momentum: The momentum indicators at the bottom of the chart suggest a bearish momentum. The histogram bars are in the negative territory and show a potential downside bias, indicating that bears might have the upper hand in the short term. 5. Target and Stop Levels: A bearish target is set at 25300, pointing to a potential decline of -5.5%. Conversely, a stop level is placed at 28000, marking a risk of +4.3%. This presents a win/loss ratio of 1.5:1, suggesting that the potential reward is 1.5 times the risk. 6. Potential Return to Support: A note on the chart queries if the price might be heading "Back to support?" Given the current technical setup, it seems plausible that Bitcoin could retest previous support levels, especially with the prevailing bearish momentum.
Peet_Serfontein
Palladium $: another leg down?

Palladium $: another leg down? A price action below 1220 supports a bearish trend direction. Further bearish confirmation for a break below 1200. The target price is set at 1110. The stop-loss price is set at 1310. The start of downside price momentum (see the lower panel) remains a concern for further downside.
Peet_Serfontein
IOTA/USD: some upside potential?

IOTA/USD: some upside potential? Higher highs and higher lows remains of interest. A price action above 0.1905 supports a bullish trend direction. Further bullish confirmation for a break above 0.2030. One can increase exposure here. The target price is set at 0.2165, or the 78.6% Fibonacci retracement level. The stop-loss is set at 0.1800. Remains below its 200-day and is regarded as a risky trade.
Peet_Serfontein
ZECUSD: some correction?

ZECUSD: some correction? A price action below 29.35 supports a bearish trend direction. Further bearish confirmation for a break below 28.85. The target price is set at 25.45. The stop-loss price is set at 33.10. Fading upside price momentum (see the lower panel) supports the bearish trend.
Peet_Serfontein
BTCUSD (Bitcoin $): buy on a pull-back

BTCUSD (Bitcoin $): buy on a pull-back A price action above 27000 supports a bullish trend direction. The ideal entry price is on a pull-back as close to 28200. Increase long exposure for a break above 30000 (psychological level). The target price is set at 31500. The stop-loss price is set at 27800. Broke up through major resistance.
Peet_Serfontein
Litecoin: a correction back to its 200-day?

Litecoin: a correction back to its 200-day? A price action below 92 supports a bearish trend direction. Increase short exposure for a confirmed break below 90. The target price is set at 80 (just below its 200-day simple moving average). The stop-loss is set at 100 (its 200-week simple moving average). Negate the idea for a break above 94 (recent tops). Remains a risky trade.
Disclaimer
Any content and materials included in Sahmeto's website and official communication channels are a compilation of personal opinions and analyses and are not binding. They do not constitute any recommendation for buying, selling, entering or exiting the stock market and cryptocurrency market. Also, all news and analyses included in the website and channels are merely republished information from official and unofficial domestic and foreign sources, and it is obvious that users of the said content are responsible for following up and ensuring the authenticity and accuracy of the materials. Therefore, while disclaiming responsibility, it is declared that the responsibility for any decision-making, action, and potential profit and loss in the capital market and cryptocurrency market lies with the trader.