
Paradise_Noir
@t_Paradise_Noir
What symbols does the trader recommend buying?
Purchase History
پیام های تریدر
Filter
سولانا (SOL) در دام نزولی: هر اوجگیری، سقوط عمیقتر میشود!
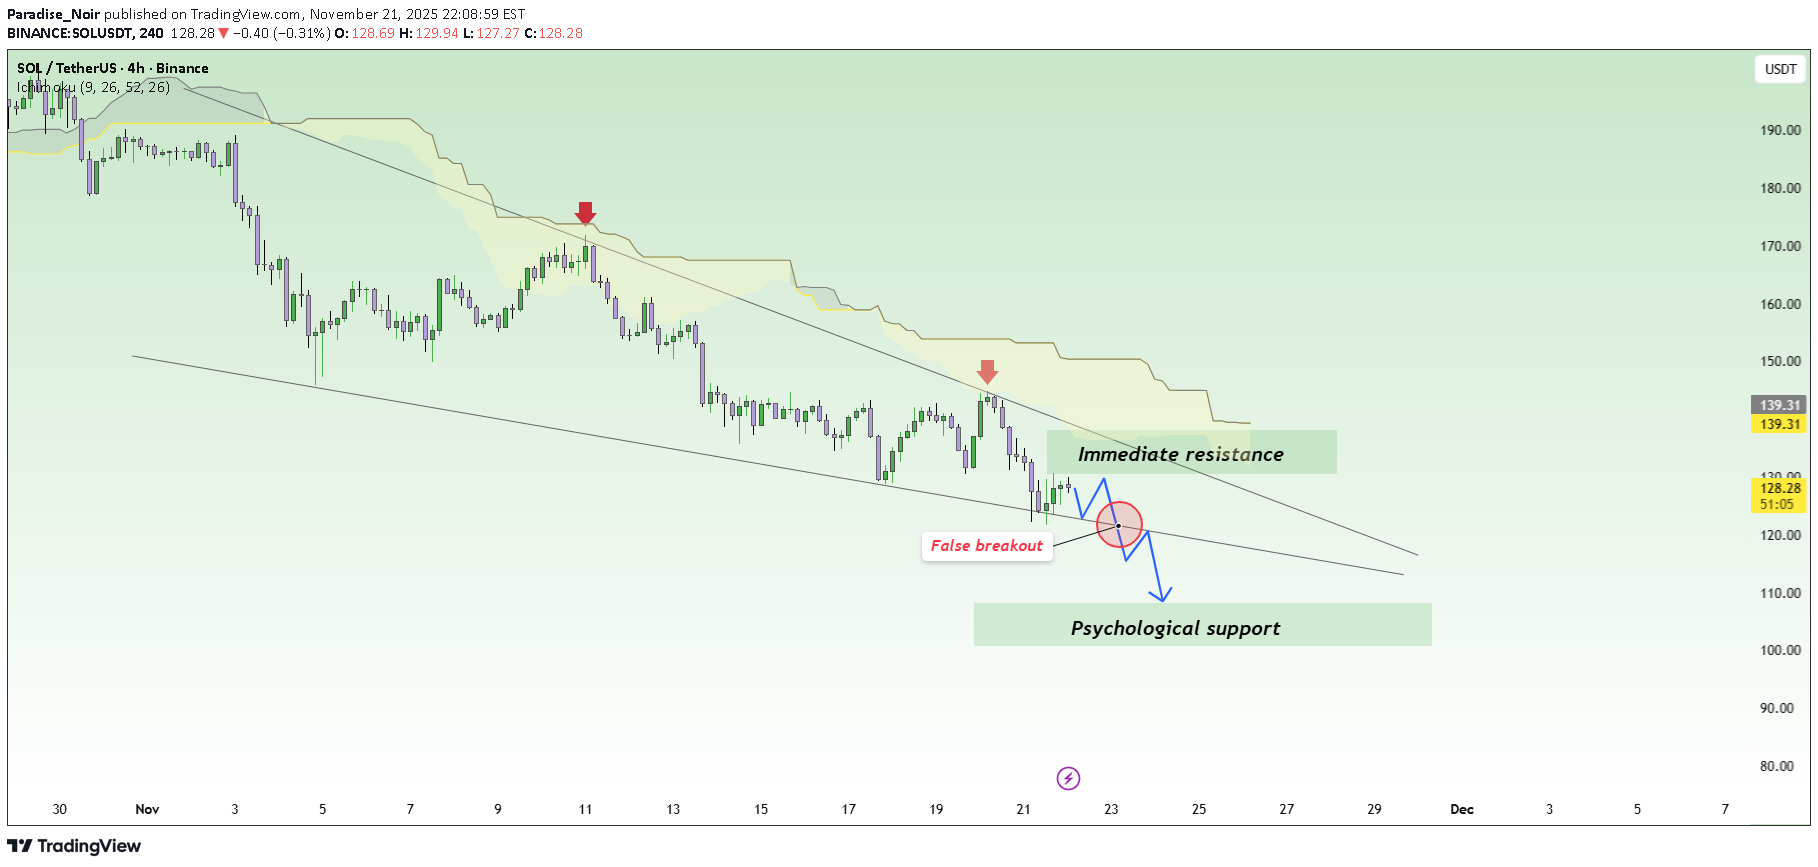
When talking about Solana right now, the clearest feeling is that the market is losing strength day by day . Recent news shows that SOL has dropped sharply in November, and large capital keeps exiting the market — turning every bounce into an excuse for holders to sell rather than a sign of reversal. On the H4 chart, SOL is trapped inside a descending wedge , repeatedly rejected by the Ichimoku cloud — an area that has consistently blocked every recovery attempt. Each previous bounce has only led to an even stronger downward leg. The $130 level is the nearest immediate resistance and also aligns with the descending trendline. If price pulls back to this zone, there is a high probability of fresh selling pressure emerging. When that happens, SOL could continue dropping toward the psychological support at $100 — the key target in the current bearish outlook. In summary, with both negative news and a weak technical structure, the most reasonable strategy now is to follow the downtrend , wait for price to pull back into resistance to find cleaner entries, and avoid catching bottoms when the market shows no clear reversal signals.
سقوط آزاد بیت کوین: هر جهش یک تله فروش است!
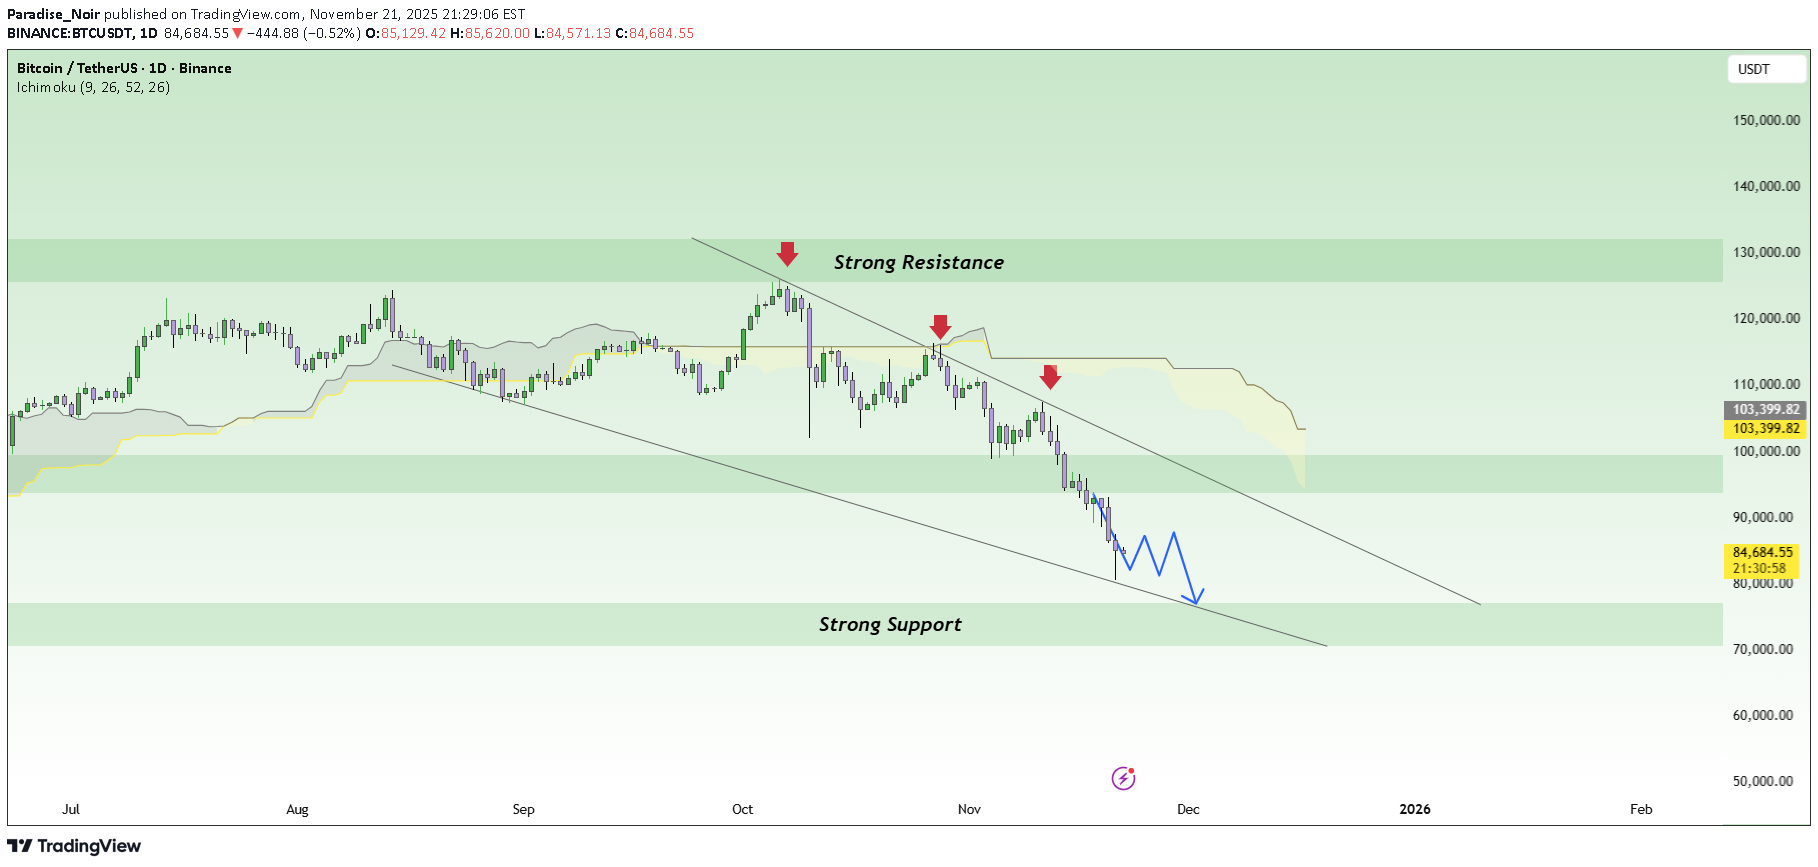
Bitcoin is currently entering a phase where every bounce is seen as a selling opportunity . Market sentiment has turned cautious as news continues to lean negative: BTC has broken its lowest level in six months around $86,000 , and reports indicate that a major whale has exited a position worth $1.3 billion . When big money pulls out, the market struggles to stay stable. Observing price action, BTC is moving steadily downward with lower highs forming continuously . Every time the price attempts to rise, it gets pushed down immediately, showing that sellers are fully in control of the market. Upper price zones are consistently rejected, proving that buying pressure is not strong enough to create any meaningful reversal. The most reasonable scenario now is that BTC may stage a technical bounce toward $93,700 , but it is likely to encounter strong selling again and continue falling toward the major target around $76,800. Any upward move during this period is just a pullback to sell , not a signal of a real trend reversal. In short, negative news + bearish technical structure are strongly aligned, so for short-term traders, it’s best to sell with the trend , wait for price to pull back before entering, and avoid catching bottoms when the market has no clear reversal signals yet.
ریزش سنگین XRP؛ آیا قیمت به سطح بحرانی 2.02 خواهد رسید؟
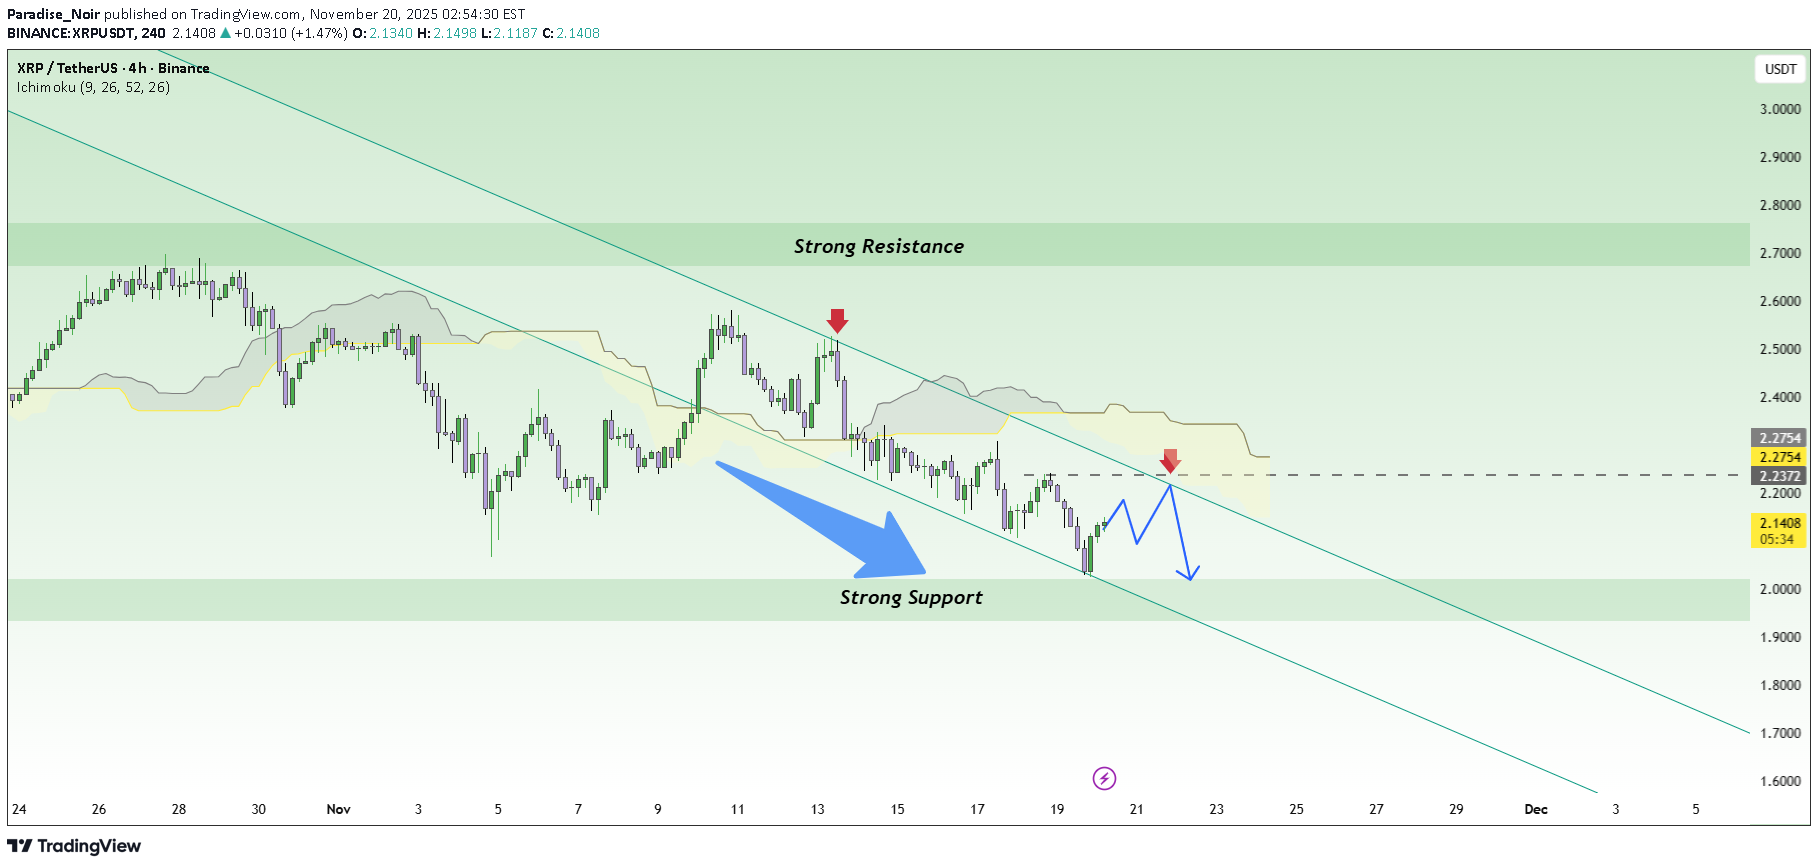
Over the past 24 hours, XRP has been under significant pressure as the key support level at 2.15 was broken. This breakdown happened alongside a broader “risk-off” sentiment across the crypto market, combined with Bitcoin’s shift into a bearish structure , adding more downward momentum to XRP. On the 4H chart, the bearish trend of XRPUSDT is very clear as price remains trapped inside a long-term descending channel . Each rebound has been capped at the channel’s resistance line, showing weak buying pressure while sellers continue to dominate . The 2.22 zone is now acting as short-term resistance. If price retraces to this level, there is a high probability of renewed selling pressure pushing the market back into the downtrend. The next bearish target lies at 2.02, a historically strong support area that has held price multiple times before. With a combined view of fundamentals and technicals, the overall trend for XRPUSDT remains bearish. Traders may look for sell setups if price retraces into the 2.20–2.22 region, aiming for the 2.02 target in the short term.
بیت کوین: آیا این اصلاح قیمتی، "بیداری" قبل از انفجار بزرگ است؟
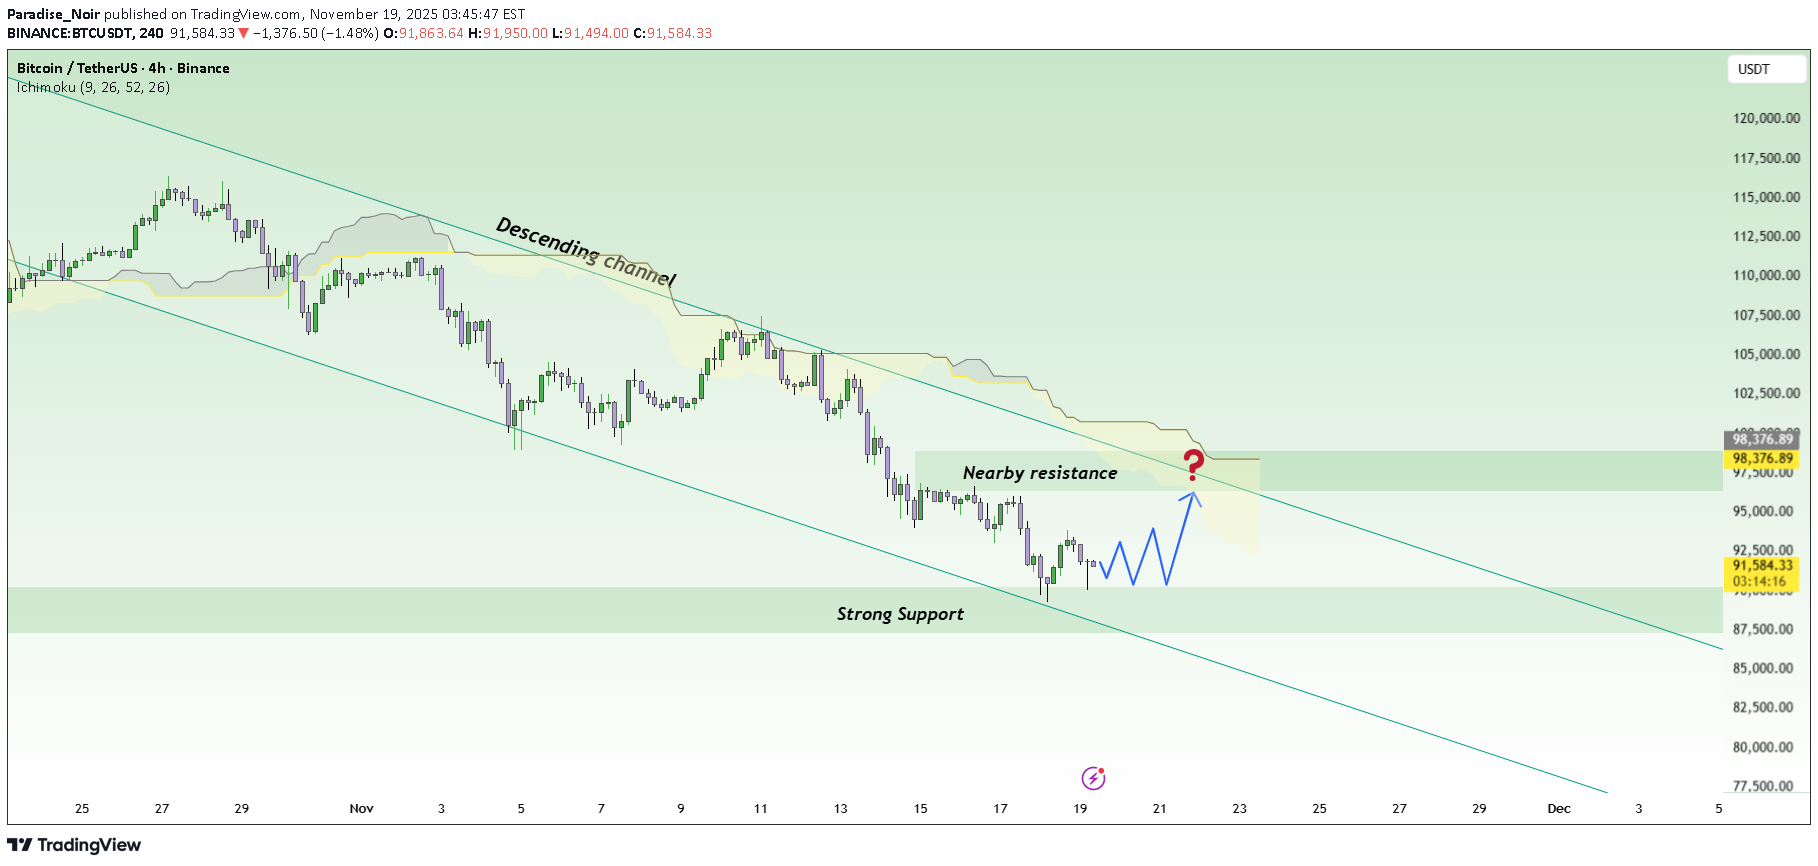
While the market was still doubting Bitcoin’s momentum, BTC suddenly pushed to its highest level in weeks , leading a strong recovery across the crypto space. And this rebound didn’t happen by luck — it came from a mix of macro sentiment and real buying pressure . On the news side, market sentiment is leaning toward the bulls as expectations grow that the Federal Reserve will soon end its rate-hike cycle . A softer Fed means less pressure on risk assets like Bitcoin, giving BTC more room to climb . Combined with rising institutional demand , the market is finding new reasons to believe in a potential recovery phase. Another major driver is the anticipation surrounding the Spot Bitcoin ETF . Even the prospect of approval has boosted Bitcoin’s legitimacy in the eyes of institutions, creating a long-term supportive force. This is the “fuel” that keeps buy-side interest steady even though the chart still sits within a short-term downtrend. On the 4H chart, BTC is reacting strongly at the major support zone around 90,300. Recent lows are no longer dropping deeper — a clear sign that selling pressure is weakening . If price continues to hold above this level and pushes toward the upper boundary of the descending channel, BTC could easily move up to the nearby resistance around 96,300. In summary, with positive news flow and stable price reactions, buyers still have a good chance of driving a short-term Bitcoin recovery. A sensible strategy is to wait for a retest around 90,300 before considering long positions in line with the bullish bias.
صعود دوباره سولانا (SOL) از کف؛ آیا ۱4۳ دلار در دسترس است؟
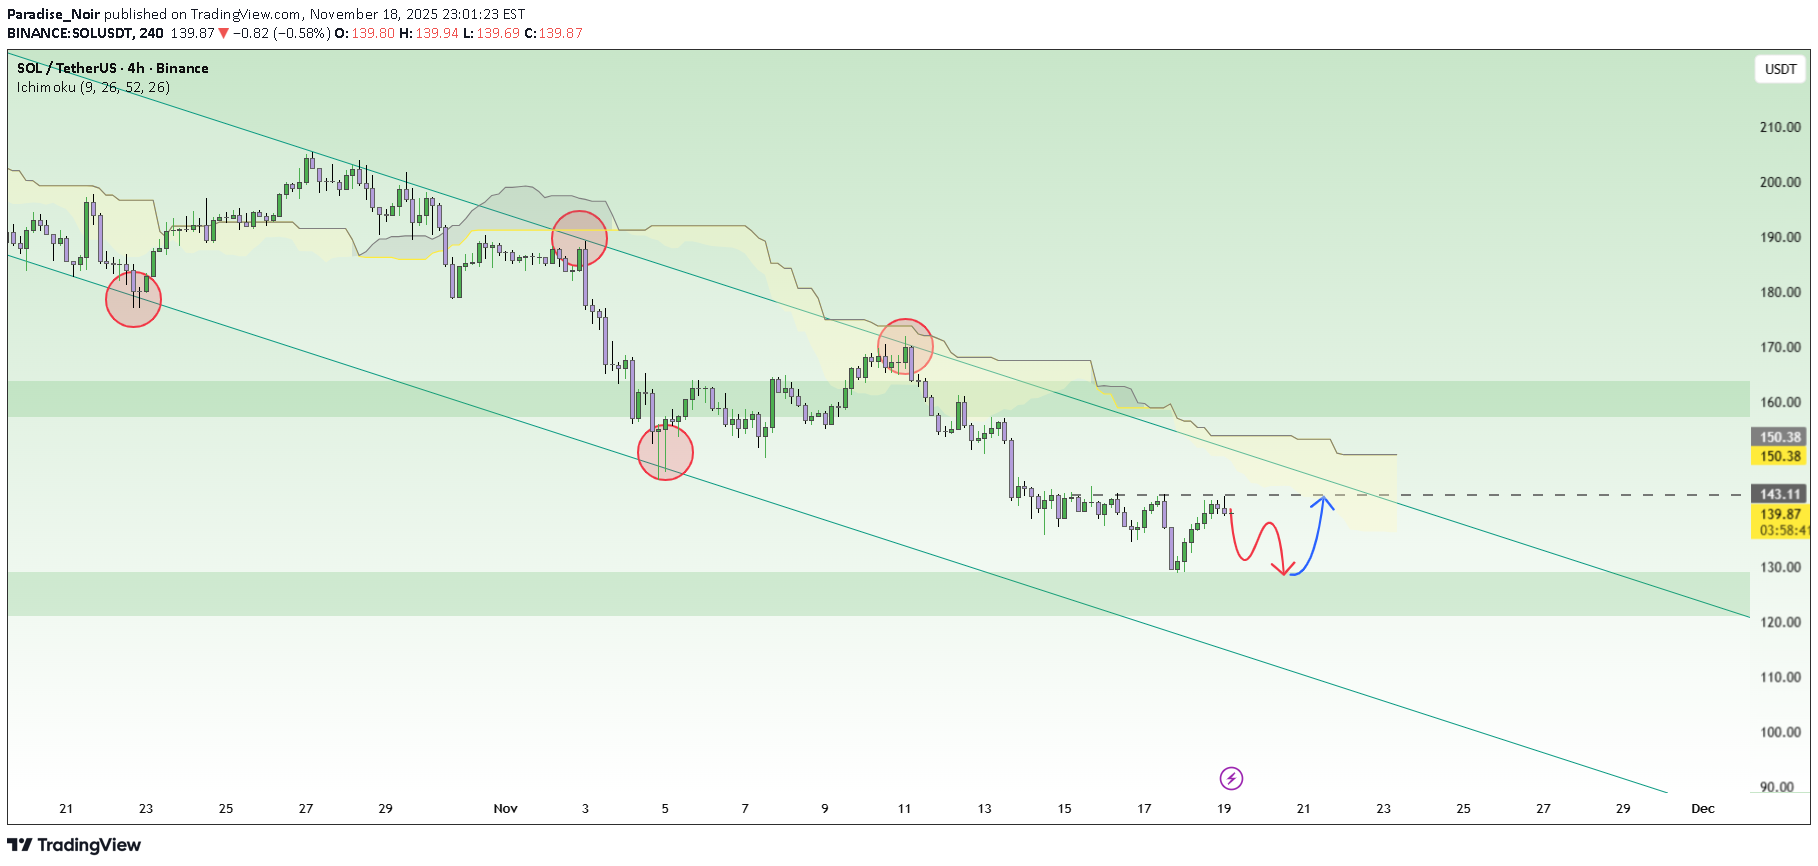
After a sharp decline, SOLUSDT is currently in the process of recovering and seems ready to return to strong upward momentum. Positive data from the Solana ecosystem is helping SOL regain momentum, and recent technical signals also support this trend. The 4H chart shows that the price is reacting well at the 128.00 support level and has the potential to bounce from here. SOLUSDT is trading within a descending channel, but if it breaks above 139.00, the next target will be 143.00. Additionally, the Ichimoku indicator shows positive signals, with the Ichimoku cloud beginning to thin out. The current trading strategy is to buy when SOLUSDT holds above 128.00 and breaks through 139.00, with a target of 143.00. Place a stop loss below 128.00 to protect your capital. However, if the price fails to hold the 128.00 support and falls below it, the upward trend will be invalidated, and the price may return to a downtrend.
نفت طلا سقوط میکند؟ سطوح حیاتی برای فروش و خرید XAUUSD اینجاست!
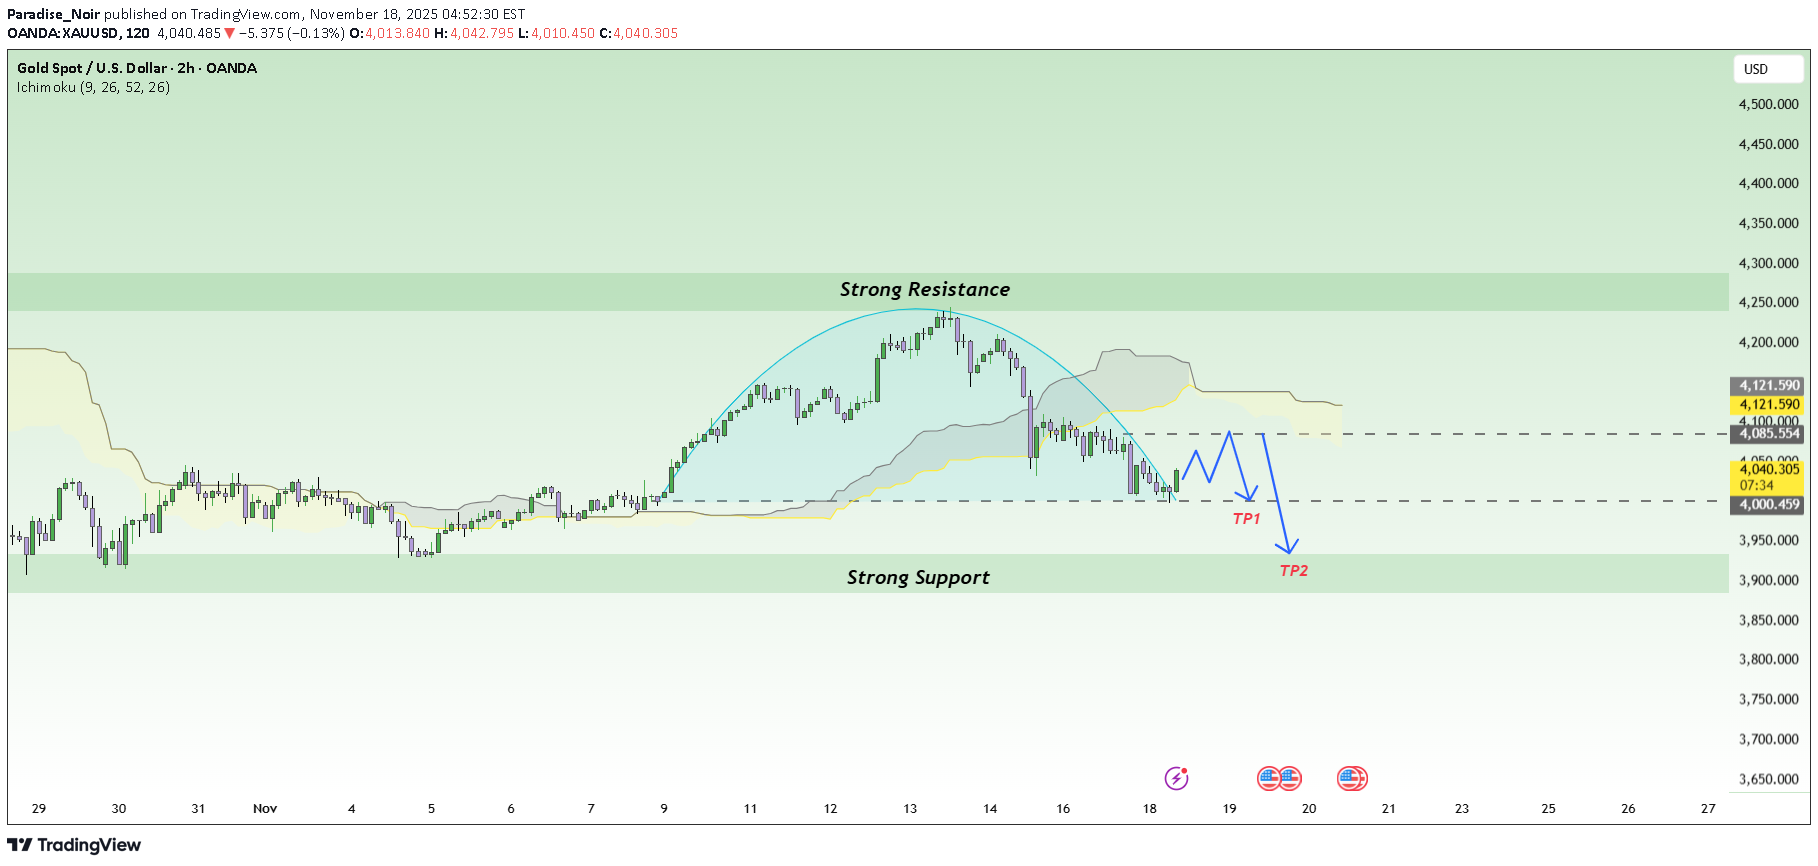
Gold prices declined during the Asian trading session on Tuesday, continuing the recent downtrend. The weakening confidence in the Federal Reserve's potential rate cut in December has provided strong support for the US dollar , putting pressure on gold and other non-yielding assets. Furthermore, the caution ahead of the delayed September non-farm payroll report, expected to be released this week, is also benefiting the US dollar and driving gold prices lower. On the chart, we can see that gold is currently moving within a mild downtrend, with a price structure forming a “cup and handle” pattern, setting up for a possible pullback. The resistance level at 4,120,000 USD is quite strong, and if the price fails to break this level, gold is likely to continue its decline toward the next support levels around 4,080,000 USD and 4,000,000 USD. In particular, the support zone near 4,000,000 USD is a key area to watch, where prices may bounce if selling pressure is not too strong. However, given the current downtrend, the potential for further declines below 4,000,000 USD is highly probable. Trade Strategy Recommendations: Sell: If gold fails to break the resistance at 4,120,000 USD and continues to decline, consider opening a sell position with targets near 4,080,000 USD and 4,000,000 USD. Buy Against the Trend: Consider short-term buy orders if gold rebounds from the 4,000,000 USD support zone, but only trade with low risk and within a short time frame. Be sure to closely monitor the important resistance and support levels , particularly around 4,080,000 USD and 4,000,000 USD, to make accurate trading decisions.
بیت کوین در سراشیبی سقوط: آیا مرز ۸۰,۰۰۰ دلار در انتظار است؟
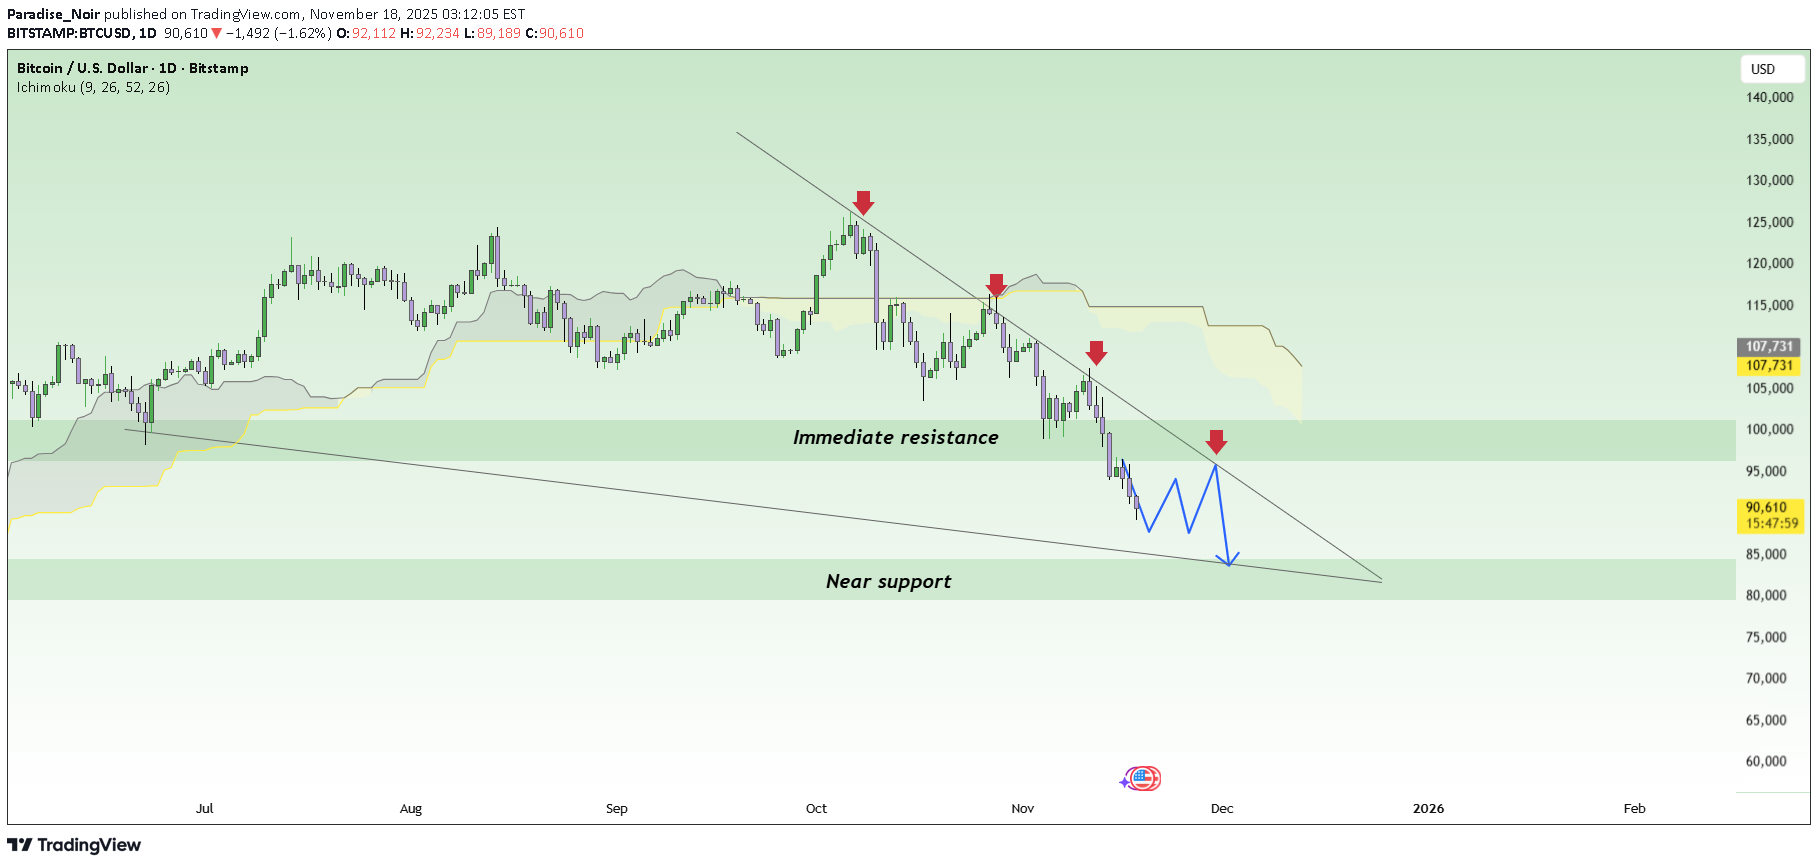
Bitcoin has dropped below $90,000 for the first time in nearly seven months, as uncertainty surrounding the Federal Reserve's interest rate path, coupled with delayed economic data, has reduced demand for riskier assets like Bitcoin. This has led to continued strong selling pressure on Bitcoin. On the chart, Bitcoin is moving in a clear downtrend, with consecutive lower highs and lows. Bitcoin has broken through previous support levels and is now testing lower price levels. In particular, the downward trendlines and the strong resistance at 90,000 USD are key factors in determining the trend. The current price is near an important support level at 84,200 USD. If Bitcoin fails to hold this level, the likelihood of further declines towards 80,000 USD is high, with the next support level in this range. Trade Strategy Recommendations: Sell: When Bitcoin faces resistance at 90,000 USD or 96,500 USD, with targets at 84,200 USD and 80,000 USD. Buy Against the Trend: Consider buying if the price drops significantly and shows signs of recovery from 80,000 USD, with short-term trades and low-risk exposure.
هشدار جدی برای تسلا (TSLA): آیا پایان روند صعودی فرا رسیده است؟
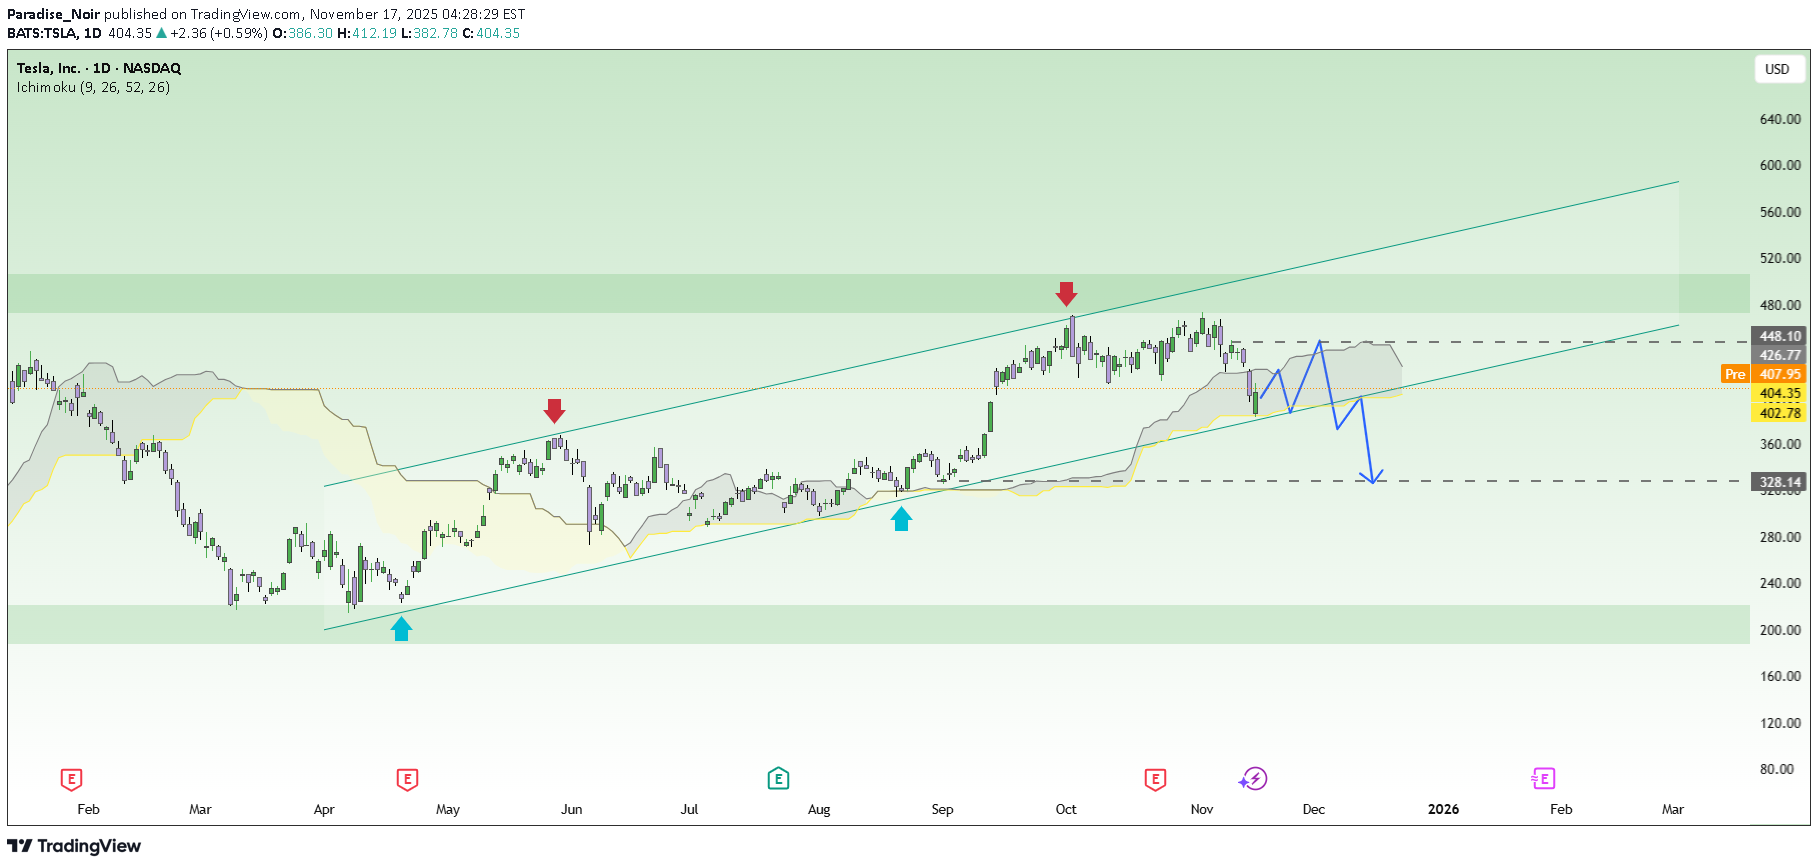
Looking at the current picture, both news flow and technical signals show that Tesla is entering a challenging phase. A series of recent negative developments — from large funds selling off, to declining sales in China, and Elon Musk potentially taking a loss on his latest share purchases — have clearly shaken market confidence. As a result, TSLA has been under continuous selling pressure, and its price action has weakened significantly compared to the previous bullish period. On the chart, the resistance area around $447 continues to act as a “steel ceiling”: every touch has been firmly rejected. The recent strong bearish candle pushed TSLA back into the Ichimoku cloud, breaking the short-term upward structure. More importantly, the price is now at risk of losing the uptrend line that has held since April, indicating that medium-term bullish momentum is fading. If TSLA fails to reclaim the $430–$447 zone in the next recovery attempts, a drop toward $329 becomes a very realistic scenario — this level has been a major support in the past and aligns with the lower boundary of the primary trend channel.
آیا قیمت طلا در آستانه سقوط بزرگ است؟ تحلیل فنی و اخبار مهم
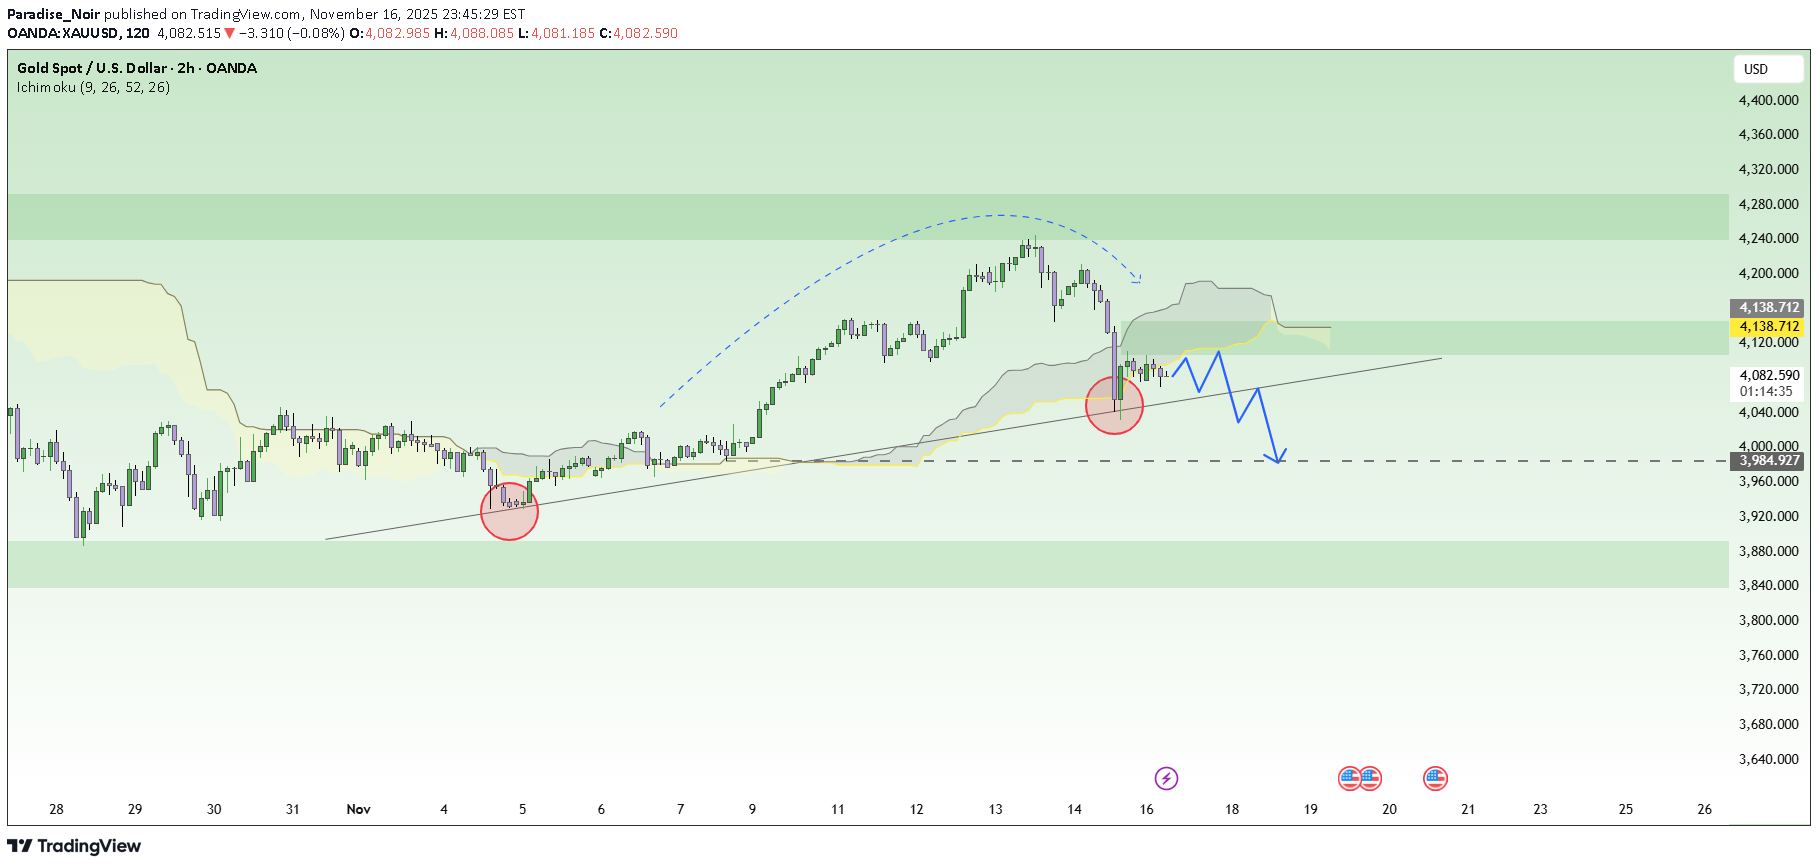
There are moments when the market doesn’t need to shout for us to sense that a storm is coming . Gold right now is the clearest example: after a wild surge of more than 245 USD in just a few sessions, the market has gone quiet — but it’s the kind of quiet that doesn’t feel safe. The news backdrop is working against gold . The U.S. government reopening after 43 days means critical data is about to be released, giving the USD room to recover. At the same time, Fed officials continue to deliver hawkish messages , emphasizing they are not ready to cut rates while inflation remains high. This immediately tightens market expectations and puts direct downward pressure on XAUUSD. Looking at the chart, the recent drop was no surprise: price has broken the ascending trendline and is now retesting the 4,100 resistance zone , where the Ichimoku cloud forms dynamic resistance. Each bounce is getting weaker, showing the bulls are running out of strength . If gold keeps getting rejected at 4,100, a deeper decline becomes almost certain, with the first target near 3,980 — a confluence of previous lows and horizontal support, and a prime area for liquidity sweeps before a potential bottom forms. In summary, with unfavorable news, weak retracements , and technical structure leaning strongly bearish , gold is facing a very real risk of continuing its downward slide.
سه رکن اصلی روند در بازار: شکسته شدن یکی، کل تحلیل شما را باطل میکند!

Most traders hear about Dow Theory but don’t truly understand that: A trend only truly exists when all three pillars agree. Break just one pillar, and the “trend” you see on the chart may be nothing more than an illusion. Here are the three “holy pillars” that determine every trend: 1. First Pillar: Price Trend – Price Action as the Foundation Dow made it very clear: “The market discounts everything.” Meaning every piece of news, expectation, fear, and sentiment is already reflected in price action. To identify the trend: Uptrend when: Higher Highs – Higher Lows (HH–HL) Downtrend when: Lower Highs – Lower Lows (LH–LL) If there’s no HH–HL or LH–LL? → No trend exists. → Any buy/sell decision is basically guessing. 2. Second Pillar: Volume – The Confirmation of a “Real” Trend A rising trend with weak volume → fake rally, pushed by “echoes,” not real money. A falling trend with exhausted volume → high risk of an aggressive reversal. Volume is the fingerprint of real capital flow. Strong uptrend → volume must rise Strong downtrend → volume must expand Weak trend → volume gradually decreases → early reversal warning If price moves one way but volume moves another → One of them is lying. And price usually ends up turning around. 3. Third Pillar: Inter-Market Confirmation – “No Market Moves Alone” This is the part most traders ignore. Dow believed: A trend is only valid when confirmed from multiple perspectives. In Dow’s era, this meant: – Transportation Index – Industrial Index Today, we interpret it more broadly: BTC rising? → Midcap altcoins or on-chain metrics must confirm. SP500 rising? → Nasdaq or the Dow Jones should move in the same direction. XAUUSD rising? → DXY or yields must show weakness. If one index rises while its “siblings” stay flat or move opposite →The trend is unreliable. WHY ALL 3 PILLARS MUST ALIGN Think of a trend as a house: - Price Action → the foundation - Volume → the steel structure - Cross-index confirmation → the supporting walls Missing 1 element → the house stands, but very weakly. Missing 2 → it collapses for sure. Have all 3 → the trend becomes strong, durable, and hard to break.
Disclaimer
Any content and materials included in Sahmeto's website and official communication channels are a compilation of personal opinions and analyses and are not binding. They do not constitute any recommendation for buying, selling, entering or exiting the stock market and cryptocurrency market. Also, all news and analyses included in the website and channels are merely republished information from official and unofficial domestic and foreign sources, and it is obvious that users of the said content are responsible for following up and ensuring the authenticity and accuracy of the materials. Therefore, while disclaiming responsibility, it is declared that the responsibility for any decision-making, action, and potential profit and loss in the capital market and cryptocurrency market lies with the trader.