
Paarham
@t_Paarham
What symbols does the trader recommend buying?
Purchase History
پیام های تریدر
Filter
Signal Type

Paarham
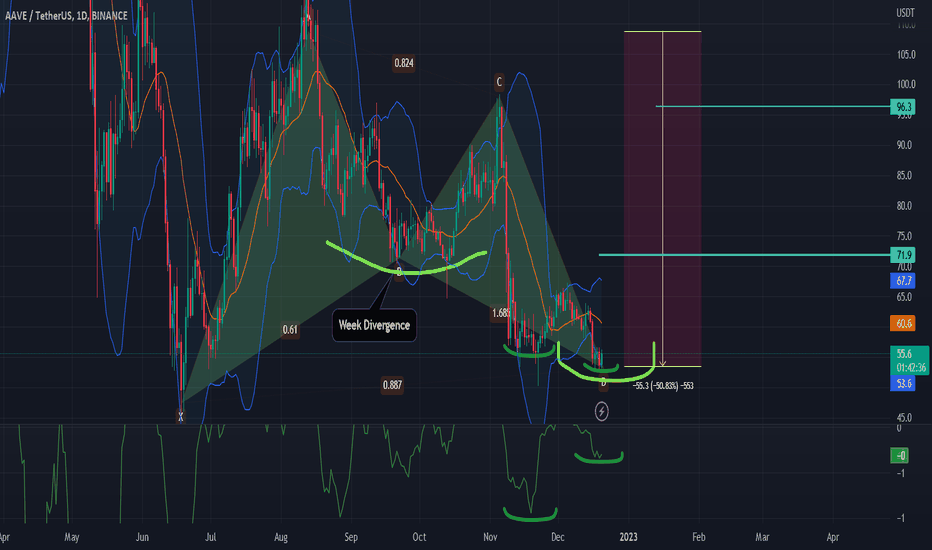
Hello everyone; This Idea is for AAVE/USDT, spot pair, BUT It's Tradable on AAVE's Laveraged token as well [AAVE3LUSDT] . So Aave has multi divergences at various Time frames, BuT we are Looking at ones on D and W charts, I Marked Them with brush, They are visible on RSI,AwsomeOS and... We are Also at 50% FIB Support, And of course a Giant BAT Pattern which is pretty much complete! -So You can open your orders NOW or after confirmation on spot or ETF . I Marked The First and second Targets on it,it may go Higher But .. GOOD LUCK!

Paarham
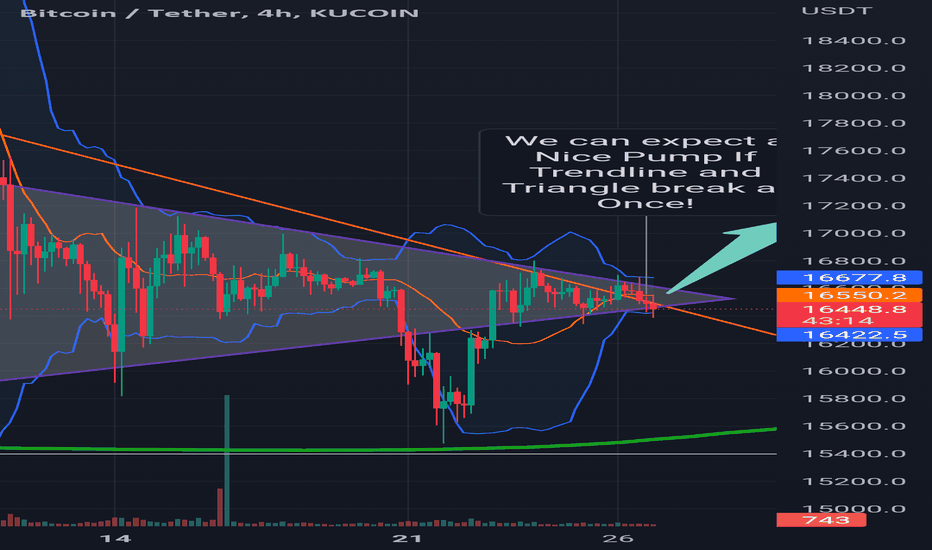
●We are at The same spot and same pattern In pretty much whole Market : _Recently we were trading in The Triangle and It kind of broke down, Now I don't know exactly it's a pullback (IDT) or a false break or whatever, charts acting crazy lately.. ▪︎Anyway, we are exactly in The very same Triangle we were couple days ago, and it's for altcoins too you can check. 🟡In The Bitcoin's case, we are right at The very important Trendline too! So If/when price breaks This trendline and The Triangle Together, BTC having a Real #Pump is Very Likely, And so The whole Market after It! 📎Just wanted to let you know and Heads up Good Luck!

Paarham
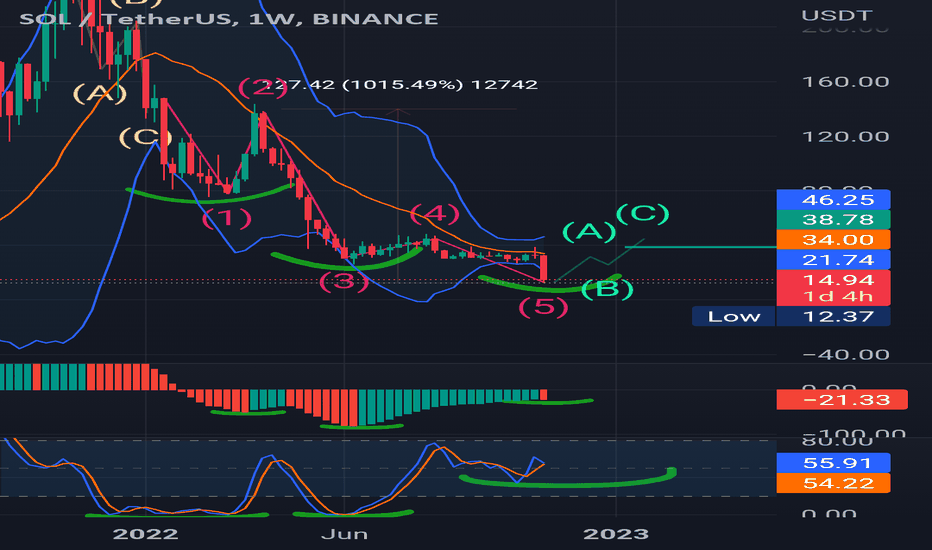
■As you know, The FTT stuff and whole Fake news about Solana made whole Market Red and sol wasn't exception. ●Now recording To Eliot waves, FIBONACCI Numbers and Multiple positive divergences in Day and Week Time frames Price should've Start to rise. ☆As you can see in The chart, Supports, RSI and OS oscillator all sending #Buy signals! Low bond of Bollinger Band at 22$ more and less, so when we turn back to 22$ Area,we Just back in The bond! ▪︎tp1: 22.3$ ▪︎tp2: 37.6$ We are good To go Even Higher soon as FUD sentiments Ends ;) Good Luck 🙌

Paarham
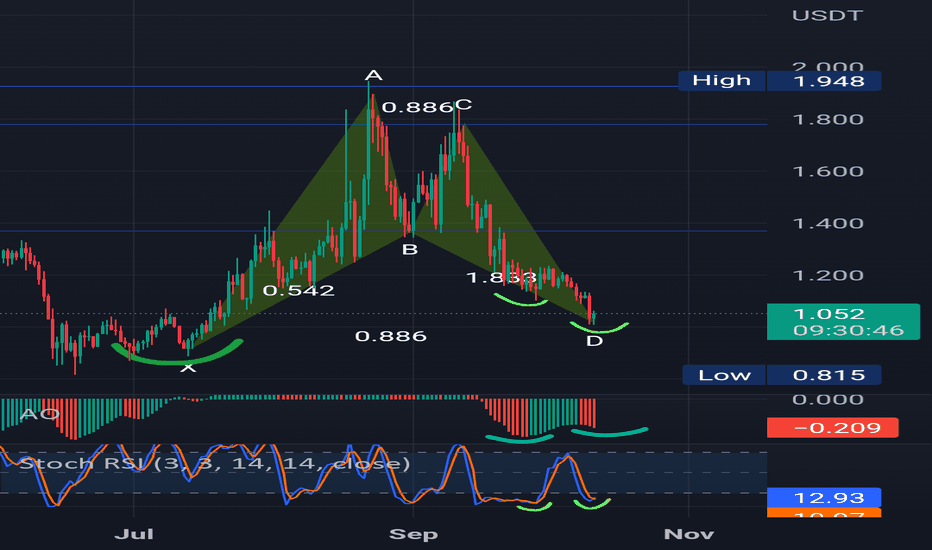
-EOS was in a downtrend for a While, But seems Like That is it! Price already Hit various supports Including FIBONACCI.. ▪︎we can see many positive divergences on The different Time frames, including day and W tf, I marked it with brush. (RSI--OS) ●MORE IMPORTANTLY we are at The end Of a The #BAT Pattern, It can break ANYTIME soon.. ☆I Marked The Proximate TP With blue line, sorry about tumbled explaining! 🙎♂️ GOOD LUCK🙋♂️

Paarham
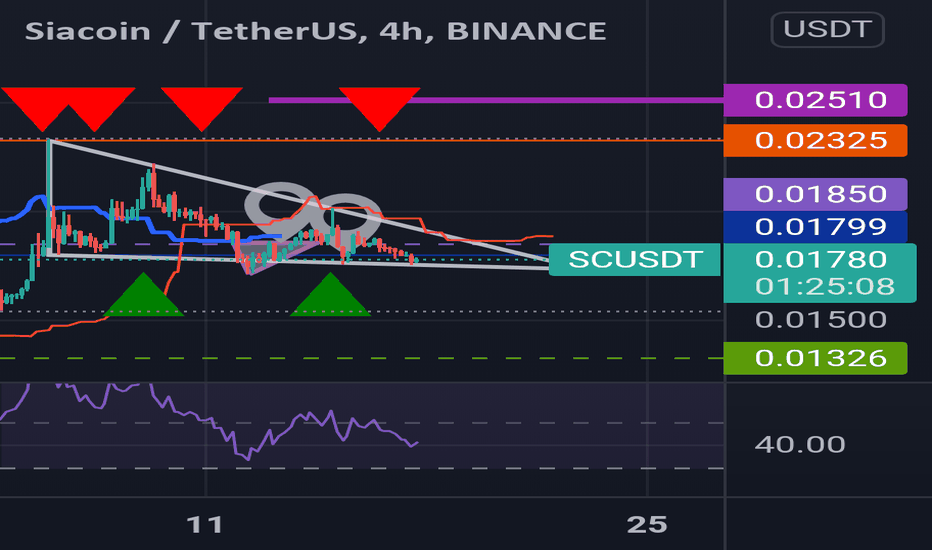
We are pretty strong on daily and price is on the bottom of a big triangle,and many golden crosses have been formed in different timeframes and most important of them Is daily chart which Just Crossed over! best time to buy✅💰 Target🚩 .0200 Target🚩 .0253 Target🏁 .0310 🛰🛰 .0372 🚀🚀🚀 .0420 .......to continue

Paarham
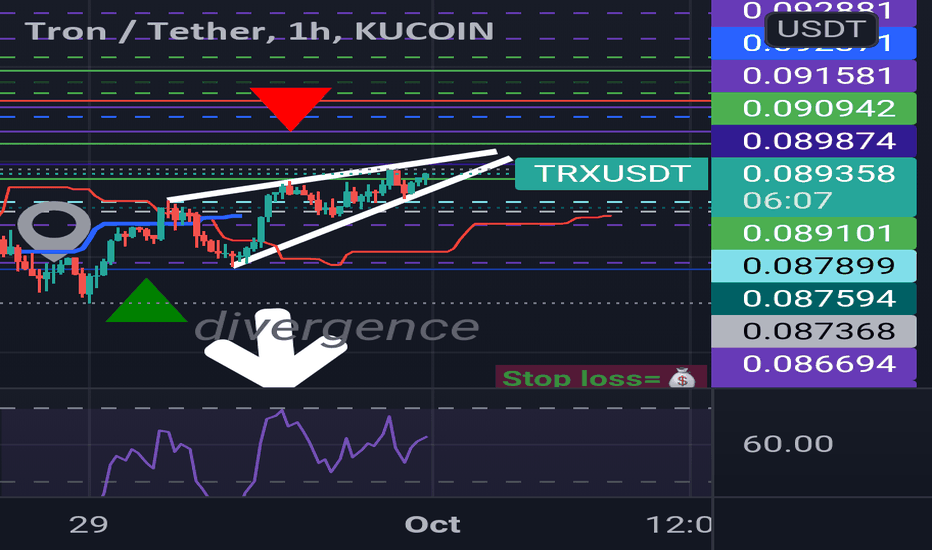
We have divergence on rsi in 1H chart and a rising wedge wich suggest That bulls should've wait a little longer before This rocket start over❇🆙️ until Then let's let the dear bears open a short position! Tik tok

Paarham
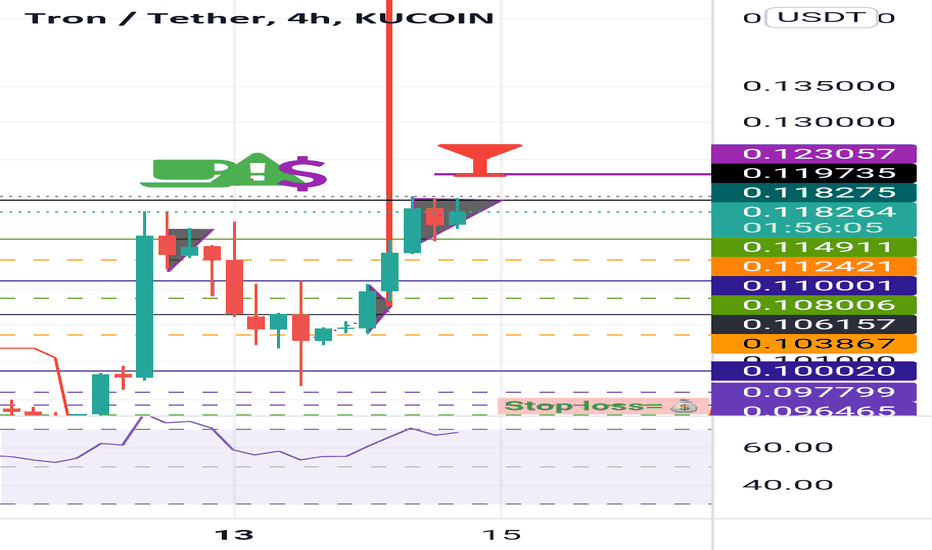
we have a tirangle and cup and handle here plus buying presure.. I guess we are pretty bullish.🔜
Disclaimer
Any content and materials included in Sahmeto's website and official communication channels are a compilation of personal opinions and analyses and are not binding. They do not constitute any recommendation for buying, selling, entering or exiting the stock market and cryptocurrency market. Also, all news and analyses included in the website and channels are merely republished information from official and unofficial domestic and foreign sources, and it is obvious that users of the said content are responsible for following up and ensuring the authenticity and accuracy of the materials. Therefore, while disclaiming responsibility, it is declared that the responsibility for any decision-making, action, and potential profit and loss in the capital market and cryptocurrency market lies with the trader.