
NoFomoCharts
@t_NoFomoCharts

What symbols does the trader recommend buying?
Purchase History
پیام های تریدر
Filter
NoFomoCharts
Bitcoin (BTCUSD) - Daily Price Uptrend, Resistance Breakout Test

Bitcoin (BTCUSD) has been in a recent Daily price Uptrend, rallying up from the $100,000 price support level. A SMA Golden Cross printed on May 21st, 2025. Bitcoin price is attempting a resistance zone test and has yet to breakout and hold above the $111,000 to $112,000 price zone. Resistance levels: $110,000 , $112,000 , $117,000 , $121,000. Support levels: $108,000 , $107,000 , $105,000 , $104,000 , $100,000. Recent crypto industry, government legislation news, and institutional crypto purchases have helped to keep Bitcoin price above $100,000 support. Stock market correlation volatility could also affect the crypto market and prices for the next 30 to 45 days.
NoFomoCharts
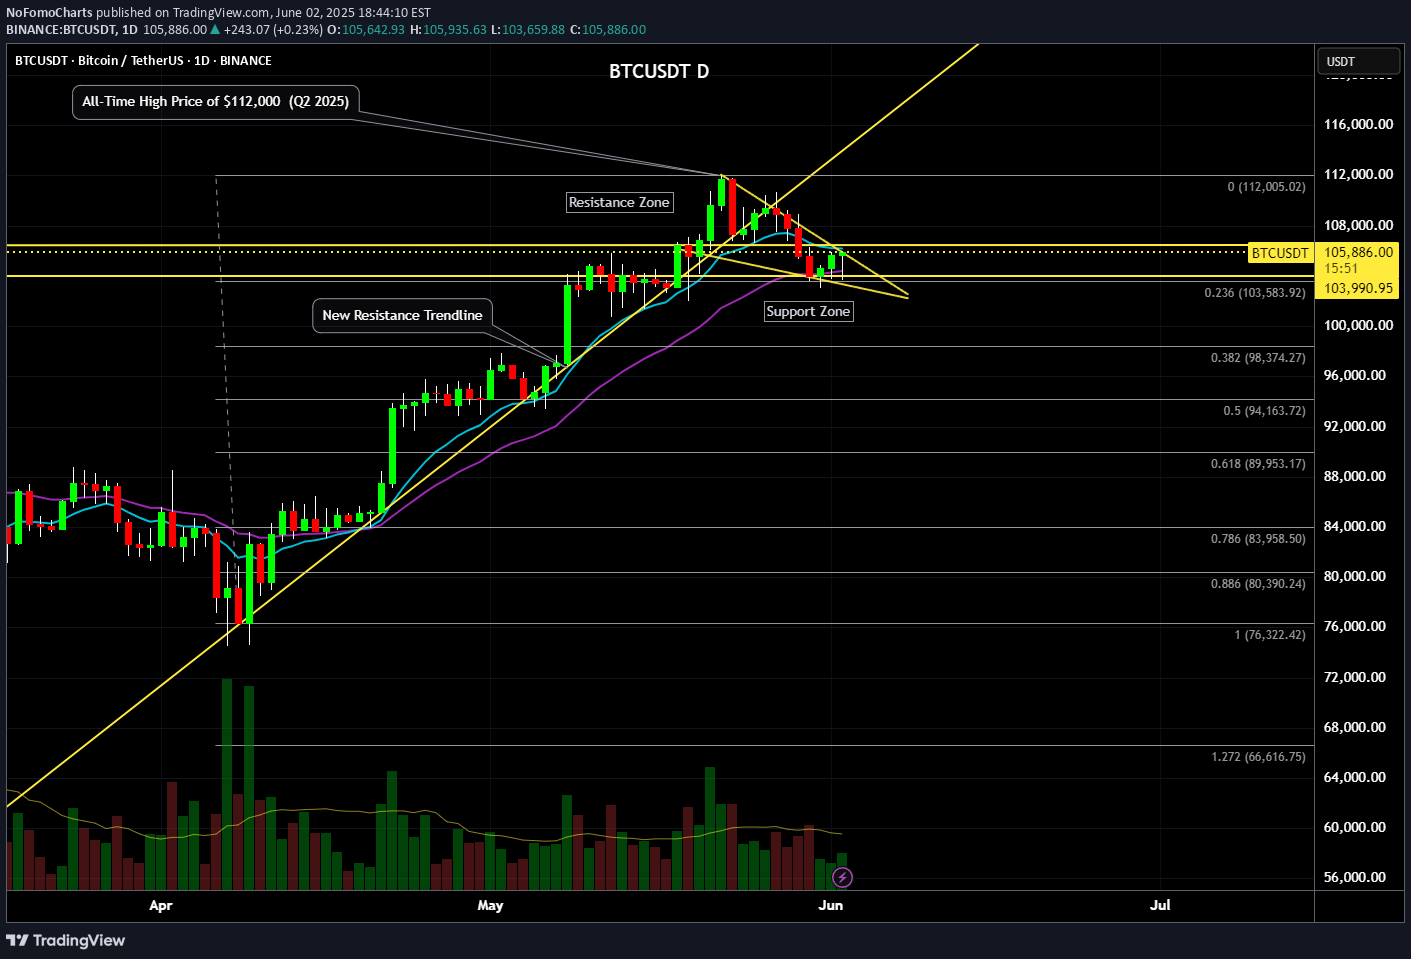
Bitcoin (BTCUSDT) - Price Testing Resistance after Morning Star

Bitcoin (BTCUSDT) price is currently testing the resistance zone of $105,000 to $110,000 (yellow lines). A morning star candle pattern has formed above the 100 ema (orange line), which is also $100,000 price support. Some bullish momentum is forming on the MACD Histogram, however, Bitcoin is still technically in a short-term downtrend for the past 30 days. Bitcoin price needs to create a new uptrend on the daily chart, a series of higher-highs and higher-lows in the price, which could take several months. At this time, Bitcoin is still reacting to global news and stock market correlations.Resistance levels: $106,000, $108,000, $110,000, $112,000. Support Levels: $100,000, $98,000, $95,000, $90,000.
NoFomoCharts
Bitcoin (BTCUSDT) - Price Consolidating Inside Sym. Triangle - D

BITCOIN (BTCUSDT) price has recently bounced up from above the 50EMA (yellow line). Since May 2025, price has been consolidating sideways and has now formed a symmetrical triangle (blue lines). 10% to 20% volatility could be incoming for Bitcoin this summer. The key resistance prices that Bitcoin has yet to breakout above are: $110000, $112000, $115000, and $120000+. Support prices are holding at this time, such as $105000, $104000, $102000, and $100000, $95000. If price holds above $100,000 to $105,000, there is still a chance that Bitcoin can continue to uptrend and rally higher this year in 2025. However, if $100,000 price and support levels are lost, a new downtrend could occur and price could possibly test the 200EMA zone (red line).
NoFomoCharts
HOOD (Robinhood) - Price Above Bollinger Band and Shooting Stars
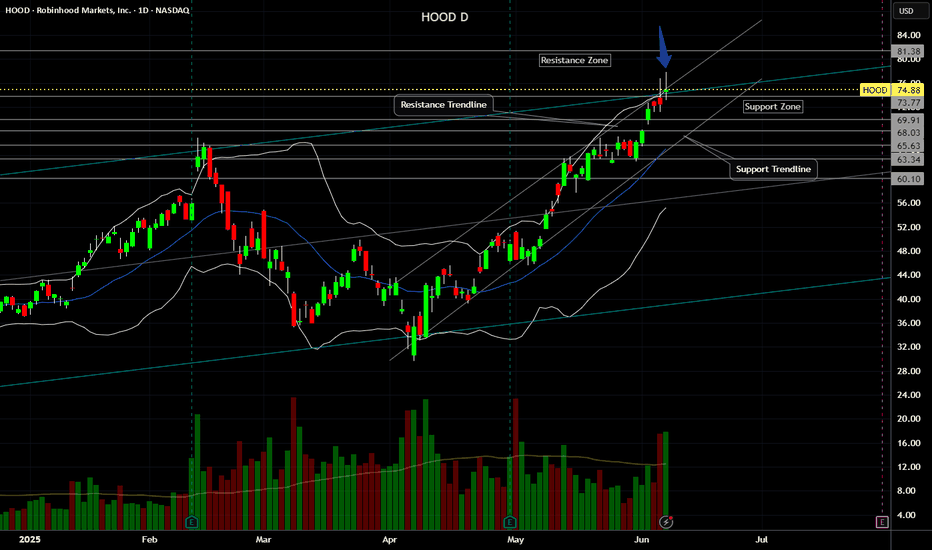
HOOD (Robinhood) stock price has been in an uptrend since May 2025. Recent fundamentals such as corporate earnings, EPS, Revenue, Acquisitions have been good in Q2 2025. However currently, HOOD price has printed 2 shooting stars above the upper bollinger band and linear regression lines (blue arrow). Potential selling and profit-taking could occur, especially if there is a significant bearish catalyst or news in the stock market. A -4% or -8% move selloff could occur over time if the price gaps up to an overextended level too fast, such as $80 to $85. Both the weekly and daily charts are starting to show bearish divergence so I am watching both the technicals and fundamentals this month.Resistance Levels: $80, $85, $90, $95, $100. Support Levels: $75, $70, $68, $65, $60.
NoFomoCharts
Bitcoin (BTCUSD) - Daily Price Consolidation Under Resistance

Bitcoin (BTCUSD) price has been in a short-term downtrend since June 2025. Price is currently consolidating under $106,000 resistance. Watching to see if an evening star candle pattern prints on the daily chart, for a very-short-term pullback. Support targets: $105,000, $104,000, $101,000, $100,000. Resistance targets: $107,000, $109,000, $110,000, $112,000. Bitcoin has been correlating with the USA stock market, tech stocks, consumer sentiment, and breaking news.
NoFomoCharts
Bitcoin (BTCUSDT) - Price Testing 26EMA and 12EMA - Daily Chart
Bitcoin (BTCUSDT) price is currently testing the 26EMA and 12EMA price levels on the Daily chart. Bitcoin price has been in a medium-term uptrend since April and May 2025. However, a short-term downtrend pullback has occurred and the price recently bounced up from the 26EMA zone ($104,000). A morning star candle price pattern printed above the 26 EMA support line. Large buyer volume could confirm the price candle pattern and Bitcoin price could rally up above 12EMA resistance ($106,000). If price continues to reject and fall below $106,000 the downtrend would likely continue into June 2025. Breaking news and stock market correlations could affect the price of Bitcoin and cryptocurrencies. Tariff news and trade deals are supposed to occur throughout June and July 2025.Resistance Targets: $106000, $107000, $110000, $112000. Support Targets: $105000, $103000, $102000, $100000.06/05/2025 - BITCOIN (BTCUSD) - Potential Head and Shoulders Pattern - Daily Bitcoin price has formed a potential head and shoulders pattern on the daily chart. If price rejects multiple times below the $104,000 resistance neckline, Bitcoin could sell off more in June 2025. Breaking news, stock market correlations and consumer sentiment can all affect the price of Bitcoin.
NoFomoCharts
Bitcoin (BTCUSDT) - Consolidation Above Support Trendline -Daily

Bitcoin (BTCUSDT) price is currently consolidating above a trendline support level (between $107,000 and $109,000). Bitcoin price has been in an uptrend throughout May 2025. If Bitcoin price closes below $106,000 a pullback could occur down to $104,000 and $100,000. Support Levels: $107K, $105K, $103K, $100K, $95K, $90K. Resistance Levels: $110K, $112K, $120K, $130, $136K, $150. Stock market correlations and corporate earnings could affect short-term price action for Bitcoin (e.g. S&P500, Nasdaq, Dow Jones, Nvidia, Dell, Marvell, etc). Breaking News, corporate earnings and announcements, presidential and government law changes, and consumer sentiment can all affect the price of Bitcoin.
NoFomoCharts
Bitcoin (BTC/USDT) - Support Trendline & Zone Price Test - Daily

Bitcoin (BTC/USDT) price recently rejected down from $107000 on May 19th, 2025.The yellow Support Trendline below is currently being tested ($103000 price level).Several candle body closes below the Support Trendline could signal weakness in the daily price trend (potential rising wedge pattern).The April inverse head-and-shoulders price pattern and targets have been completed (+12% and +24%).note: Breaking news, government law changes, corporate announcements, and crypto crime could affect the Bitcoin price and charts.
NoFomoCharts
BITCOIN (BTC/USD) - Testing Key Resistance Levels - Weekly Chart

Bitcoin (BTC/USD) is currently testing key resistance levels and potential all-time highs in 2025. BTC price bounced up from the April 7th 2025 support ($78000) and continues to rally. Price needs to hold above $95000 and $85000 support levels to maintain an uptrend in 2025. Resistance targets to the upside are: $105000, $110000, $117000, $128000, $142000. Support targets to the downside are: $100000, $90000, $83000, $75000, $70000. Tariffs and trade deal news, stock market corporate earnings, government law changes and announcements, and consumer sentiment can all affect the price of Bitcoin.
NoFomoCharts
Bitcoin (BTC/USDT) - End of 2024 - Daily Price Consolidation

Bitcoin (BTC/USDT) price is currently in a short-term downtrend and consolidation pattern (end of December 2024). Bitcoin price needs to hold above $92,000 to $90,000 to avoid a daily bearish head-and-shoulders resistance price pattern. Support Levels to the downside currently are: $92000, $90000, $87610, $85000, $81000, $76000. Resistance levels to the upside currently are: $96500, $100000, $105000, $108000, $110000, $120000. Daily and Weekly price consolidation is ongoing, and Bitcoin is seeking to establish the next higher-low support price. Note: breaking news, corporate news, government law changes, stock market correlations, and crypto events can affect and override technical chart patterns. Date: 12/30/2024 pm
Disclaimer
Any content and materials included in Sahmeto's website and official communication channels are a compilation of personal opinions and analyses and are not binding. They do not constitute any recommendation for buying, selling, entering or exiting the stock market and cryptocurrency market. Also, all news and analyses included in the website and channels are merely republished information from official and unofficial domestic and foreign sources, and it is obvious that users of the said content are responsible for following up and ensuring the authenticity and accuracy of the materials. Therefore, while disclaiming responsibility, it is declared that the responsibility for any decision-making, action, and potential profit and loss in the capital market and cryptocurrency market lies with the trader.