Technical analysis by NoFomoCharts about Symbol HOODX on 6/9/2025

NoFomoCharts
HOOD (Robinhood) - Price Above Bollinger Band and Shooting Stars
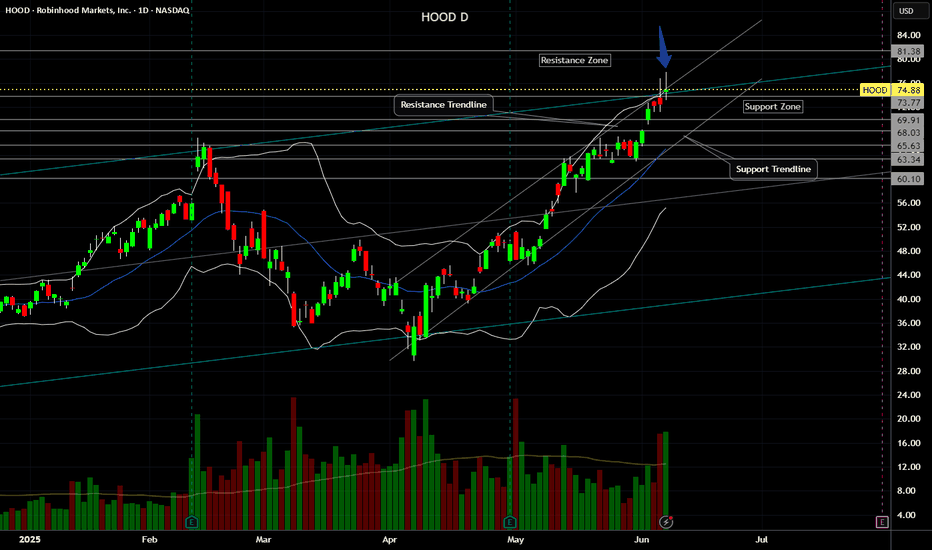
HOOD (Robinhood) stock price has been in an uptrend since May 2025. Recent fundamentals such as corporate earnings, EPS, Revenue, Acquisitions have been good in Q2 2025. However currently, HOOD price has printed 2 shooting stars above the upper bollinger band and linear regression lines (blue arrow). Potential selling and profit-taking could occur, especially if there is a significant bearish catalyst or news in the stock market. A -4% or -8% move selloff could occur over time if the price gaps up to an overextended level too fast, such as $80 to $85. Both the weekly and daily charts are starting to show bearish divergence so I am watching both the technicals and fundamentals this month.Resistance Levels: $80, $85, $90, $95, $100. Support Levels: $75, $70, $68, $65, $60.