
NexusTradesZone
@t_NexusTradesZone

What symbols does the trader recommend buying?
Purchase History
پیام های تریدر
Filter
NexusTradesZone
ETH/USD Range Strategy: Key Levels for Trading

The provided content appears to be a snapshot of a TradingView chart for the Ethereum (ETH) to U.S. Dollar (USD) pair, dated February 28, 2025. Here’s an analysis and a potential trading idea based on the information:### Analysis:1. **Price Levels**: The chart shows Ethereum's price ranging from a low of around 1,200.00 to a high of 3,800.00. The current price seems to be fluctuating within this range, indicating potential support and resistance levels.2. **Trend**: The chart spans several months, showing periods of volatility and consolidation. The price has experienced significant movements, suggesting that Ethereum is subject to strong market sentiment and external factors.3. **Support and Resistance**: Key support levels are visible around 1,500.00 and 2,000.00, while resistance levels are around 3,400.00 and 3,800.00. These levels are crucial for identifying potential entry and exit points.4. **Time Frame**: The data spans from March of one year to November of the next, indicating a medium to long-term analysis window.**Description**: - **Entry Point**: Consider entering a long position near the 2,000.00 support level with confirmation from bullish indicators. For a short position, consider entering near the 3,400.00 resistance level with bearish confirmation.- **Stop Loss**: Place a stop loss just below the 1,800.00 level for long positions or above the 3,600.00 level for short positions.- **Take Profit**: Aim for a take profit level near the 3,000.00 resistance for long positions or the 2,200.00 support for short positions.- **Risk Management**: Ensure proper risk management by not risking more than 1-2% of your trading capital on this trade.This strategy leverages the current range-bound movement of Ethereum, providing clear guidelines for entering and exiting trades based on key support and resistance levels. It also emphasizes the importance of risk management to protect your capital.
NexusTradesZone
XAU/USD Bearish Retest in Play – More Downside Expected?

### **Title: GOLD | Bearish Retest at Key Resistance – More Downside Ahead?** ### **Analysis & Description:** This **1-hour chart of XAU/USD (Gold vs. U.S. Dollar)** presents a clear **bearish structure**, with price currently testing a key **support-turned-resistance zone**. The downward trajectory suggests a **potential continuation to the downside** after a minor pullback. #### **Key Observations:** 1. **Break and Retest Pattern:** - Price has **broken below** a critical support level and is now **retesting it as resistance** (marked by horizontal lines). - This classic **bearish retest** setup suggests that sellers may step in to push prices lower. 2. **Two Possible Scenarios:** - **Scenario 1 (Primary Bearish Case):** - If price rejects this resistance, we could see **a strong continuation downward**, targeting **$2,820 – $2,780 levels**. - This aligns with the **trend structure of lower highs and lower lows**. - **Scenario 2 (Less Likely Bullish Case):** - If bulls manage to reclaim and break above **$2,860**, we may see a short-term reversal, with the next resistance near **$2,880 – $2,900**. 3. **Trading Strategy:** - **Short Setup:** - Look for rejection signals at resistance (**$2,850 – $2,860**), such as bearish engulfing candles or wicks. - Enter short positions with **stop-loss above $2,865**. - Target price zones around **$2,820 – $2,780** for profit-taking. - **Alternative Bullish Setup:** - A confirmed breakout above **$2,860** could open the way for a short-term rally. ### **Conclusion:** Gold remains **bearish**, and this current pullback into resistance could provide a **selling opportunity** if rejection confirms. However, traders should monitor key **economic news events** that could impact gold’s movement. 📉 **Do you think gold will continue dropping, or will bulls take control? Let me know in the comments!** 🚀
NexusTradesZone
XAU/USD Breakdown – Key Support Levels Tested After Major Drop!

### **Analysis & Description:** This 1-hour chart of **Gold (XAU/USD)** from **OANDA** presents a strong **bearish move** following a key **liquidity grab and rejection** from the 2,942–2,950 resistance zone. #### **Key Observations:** - **Fair Value Gap (FGV 4H)**: The price initially tapped into the imbalance before facing a strong rejection. - **Liquidity Sweep**: The sharp move up prior to the decline suggests that smart money may have induced liquidity before the major bearish move. - **Bearish Break & Retest**: The price has broken through significant **support levels** around 2,892 and 2,878 and is now approaching the next support at **2,834**. - **Fibonacci & Structure**: The Fibonacci retracement aligns with a deeper correction, with the price possibly targeting **2,820–2,800** if bearish momentum continues. - **Risk-Reward Setup**: The risk-to-reward ratio in this trade setup suggests a well-executed short position, capturing nearly **3.70% downward movement** (approx. **-108 points**). ### **Potential Scenarios:** 🔴 **Bearish Case:** If the price sustains below 2,844 and fails to reclaim key resistance zones, further downside is likely toward **2,820–2,800**. 🟢 **Bullish Case:** A strong bounce from current levels (2,834) could trigger a short-term retracement before resuming downward momentum. #### **Final Thought:** Gold remains in a **strong downtrend**, and traders should watch for price action confirmation around support levels before considering further positions.
NexusTradesZone
GOLD | Bearish Reversal Pattern – More Downside Ahead?

### **Analysis & Description:** This is a **1-hour chart of XAU/USD (Gold vs. U.S. Dollar)** from TradingView, highlighting a **bearish trend reversal pattern**. The price action forms a series of **lower highs and lower lows**, indicating a clear **downtrend formation**. #### **Key Observations:** 1. **Lower Highs & Lower Lows:** - The chart outlines a classic **bearish market structure** with multiple rejection points. - Each bullish rally is met with strong selling pressure, leading to a downward continuation. 2. **Momentum Weakness (MACD Indicator):** - The MACD at the bottom indicates **bearish momentum**, with both the MACD line and Signal line in negative territory. - This suggests that selling pressure dominates and further downside movement is likely. 3. **Price Projection:** - The final arrow suggests **further downside movement**, possibly breaking below key support zones. - If price breaks below the **$2,807 support**, it could accelerate selling toward **$2,780 – $2,750 zones**. 4. **Possible Trading Strategy:** - **Bearish Confirmation:** Traders should watch for a breakdown below **$2,807** for a short-selling opportunity. - **Bullish Reversal?:** If price forms a strong support at **$2,807**, we may see a bounce before further downside. ### **Conclusion:** Gold is currently in a **short-term downtrend**, and traders should be cautious of potential bearish continuation. However, **fundamental news events** could also impact price action, so it's essential to monitor economic data and market sentiment. #### **Key Levels to Watch:** - **Support:** $2,807 – $2,780 - **Resistance:** $2,846 – $2,880 📉 **What do you think? Will gold continue to drop, or will we see a reversal soon? Drop your thoughts below!** 🚀
NexusTradesZone
GOLD | BULLISH MOVEMENT & KEY NEWS AHEAD Will the Rally Continue

Gold at Critical Support – Will Bulls Hold or Breakdown?Chart Analysis & Trade Setup:This XAU/USD (Gold/US Dollar) 4H Chart highlights Gold trading within a well-defined rising channel, approaching a key support zone that could determine the next big move.Technical Breakdown:📌 Rising Channel Formation – Gold remains within an upward sloping channel, indicating an overall bullish trend.📌 Support Zone Retest – Price is testing a major support zone at the lower boundary of the channel, where bulls need to hold to maintain upward momentum.📌 Two Possible Scenarios:Bullish Scenario (Black Arrows): A bounce from support could lead Gold to retest the 2,935 - 2,955 ATH (All-Time High) resistance zone.Bearish Breakdown (Red Arrows): If support fails, we may see a drop toward 2,809 USD, with extended targets at 2,731 & 2,699 USD.📌 Key Demand Zone Below – The 2,559 - 2,633 USD range is a strong demand area, where buyers could step in if a major correction occurs.Trade Plan:🔹 Bullish Setup:Entry: Long at 2,880 USD on support bounce.Stop Loss: Below 2,860 USD (support breakdown).Take Profit: 2,935 / 2,955 USD.🔻 Bearish Setup (Breakdown Confirmation):Entry: Short below 2,860 USD after a confirmed break.Stop Loss: Above 2,880 USD.Take Profit: Scale out at 2,809 / 2,731 / 2,699 USD.
NexusTradesZone
Gold Breakdown from Rising Wedge – Bearish Correction Incoming?

Chart Analysis & Trade Setup:This XAU/USD (Gold/US Dollar) Daily Chart presents a bearish reversal pattern as Gold has broken down from a well-formed Rising Wedge, signaling potential downside momentum.Technical Breakdown:📌 Rising Wedge Formation – Gold followed a narrowing uptrend, indicating weakening bullish momentum.📌 CHoCH (Change of Character) – A significant bearish candle closed below the wedge structure, confirming a shift in market structure.📌 Wave Structure – The market completed a complex corrective WXYXZ pattern, aligning with exhaustion at the top.📌 Bearish Breakdown – The price has started declining, with strong bearish momentum suggesting further selling pressure.Key Levels & Trade Plan:📉 Bearish Target Zones:🔻 2,727 USD – First key support zone.🔻 2,655 USD – Strong historical demand zone.🔻 2,537 USD – Major swing low support.✅ Potential Trade Setup:Entry: Below 2,880 USD on breakdown confirmation.Stop Loss: Above 2,920 USD (wedge breakdown invalidation).Take Profit: Scale out at 2,727 / 2,655 / 2,537 USD.
NexusTradesZone
Gold/USD Wyckoff Distribution Breakdown – Trend Reversal or Buy
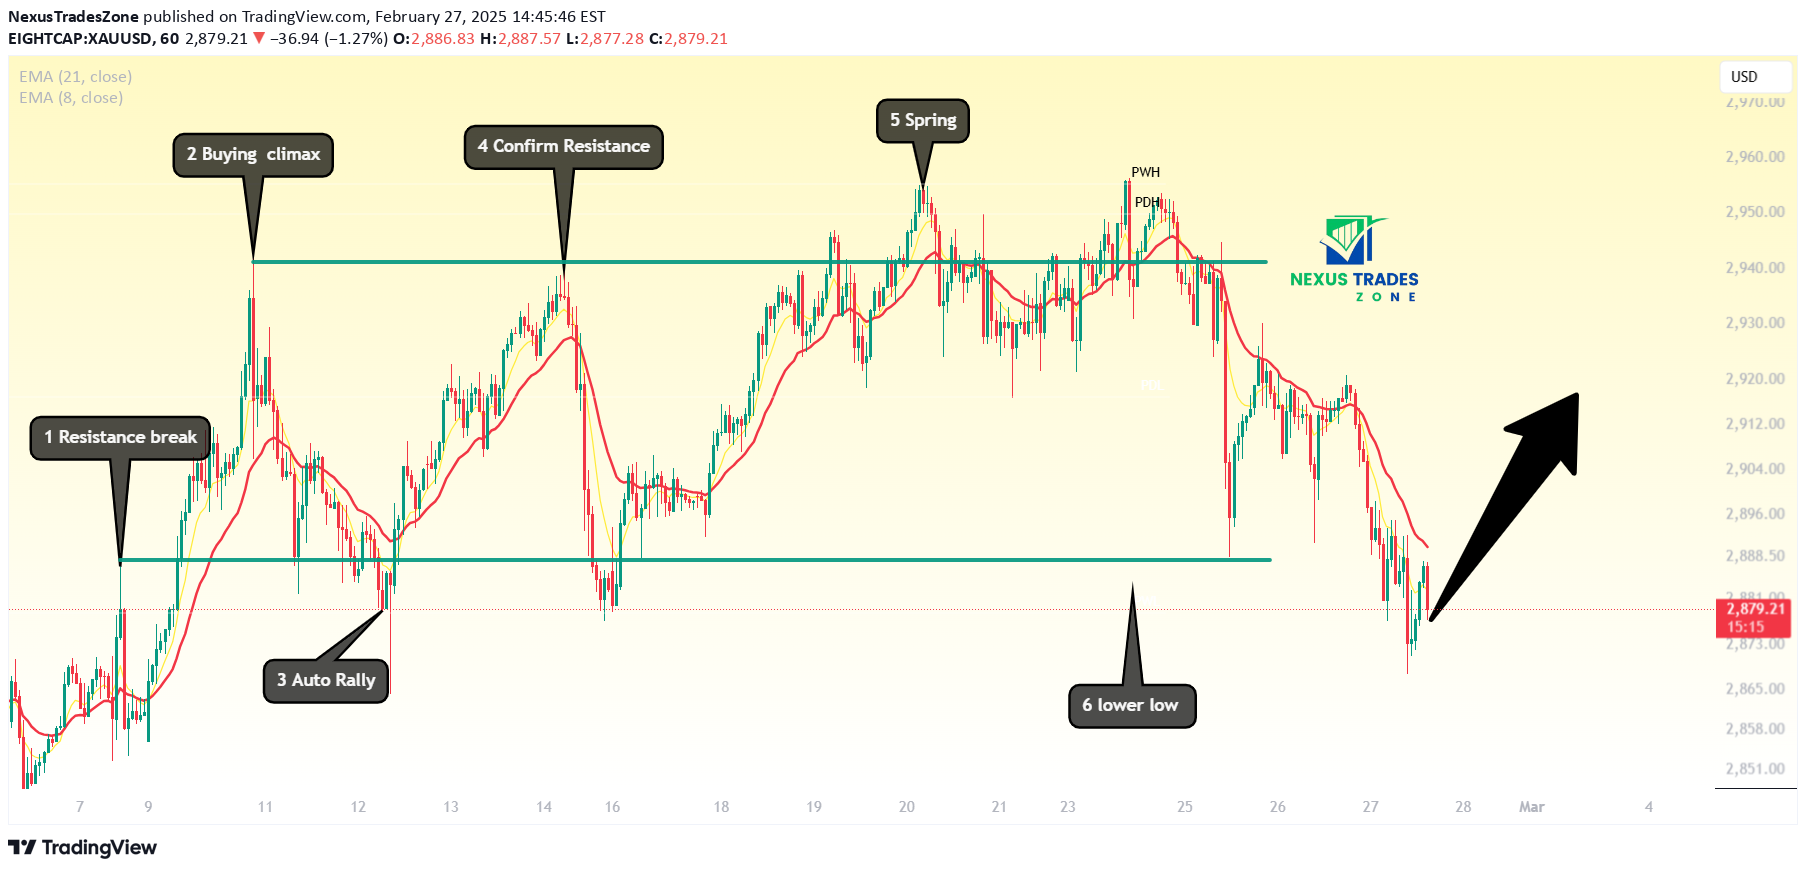
Chart Analysis & Trade Setup:This XAU/USD (Gold/US Dollar) 4H chart illustrates a classic Wyckoff Distribution pattern, signaling a potential trend reversal. After reaching a buying climax, Gold has broken below key support, forming lower lows, which suggests further bearish pressure.Wyckoff Structure Breakdown:1️⃣ Resistance Break – The initial bullish breakout created new highs.2️⃣ Buying Climax (BC) – A strong move up exhausted buyers.3️⃣ Automatic Rally (AR) – Price retraced but held above previous support.4️⃣ Resistance Confirmation – Price tested resistance again, forming a double-top pattern.5️⃣ Spring Formation – A false breakout attempt before distribution.6️⃣ Lower Low Formation – The price has now broken below major support, signaling potential further downside.Trade Plan & Key Levels:✅ Potential Long Entry: If price forms a bullish reversal pattern around 2,880 - 2,885 USD, traders may look for long positions targeting 2,920 - 2,940 USD.📉 Bearish Continuation: If Gold fails to reclaim 2,900 USD, the next downside target is 2,850 USD.🎯 Target 1: 2,920 USD (Short-term resistance).🎯 Target 2: 2,940 USD (Key swing high).🛑 Stop Loss: Below 2,865 USD to manage risk.
NexusTradesZone
Bitcoin (BTC/USD) – Double Channel Down with Potential Reversal!

Pair: BTC/USDTimeframe: 4HCurrent Price: $86,486 (-2.37%)🔍 Market OverviewBitcoin has been trading within a well-defined double downward channel, indicating a period of correction. The price is approaching a key support level, which could act as a potential reversal point.📊 Technical Analysis1️⃣ Double Channel Down FormationBTC has been moving within two parallel descending channels, confirming a short-term bearish trend.The price is currently at the lower boundary of the second channel, where buying pressure may emerge.2️⃣ Support & Resistance Levels🔹 Support Levels:$85,500 - $86,000 (Lower channel boundary)$83,800 (Key demand zone)🔹 Resistance Levels:$89,000 (Mid-channel resistance)$92,500 (Upper channel resistance)$96,892 (Major breakout target)3️⃣ Possible Trading Scenarios📈 Bullish Scenario:If BTC holds above the $85,500-$86,000 support zone, we could see a bounce back towards the mid-channel resistance (~$89,000).A confirmed breakout above $92,500 would signal a trend reversal toward the $96,892 target.📉 Bearish Scenario:If BTC fails to hold the $85,500 support, we could see a further drop toward $83,800 or even lower.A confirmed breakdown would extend the bearish momentum, possibly towards $80,000.📌 Trading Plan✅ Long Entry:Around $86,000 - $85,500 (Support Retest)Stop Loss: Below $83,800Target 1: $89,000Target 2: $92,500Target 3: $96,892🚨 Short Entry (If Breakdown Occurs):Below $85,500Stop Loss: Above $88,000Target 1: $83,800Target 2: $80,000
NexusTradesZone
GOLD (XAU/USD) – Breakdown from Flat Range?

Hello traders💰 Gold Spot (XAU/USD) - 2H Chart Analysis🔍 Market Insights:🔹 Uptrend Channel Breakout: Gold was trending in a bullish channel but broke out and transitioned into a flat consolidation.🔹 Flat Price Action: After multiple rejections at the top, price has failed to continue the bullish momentum.🔹 Potential Breakdown: The price is now showing bearish momentum and could test the $2,880 support level.📉 Key Levels to Watch:✅ Resistance: $2,950 - $2,960 (Flat Range Top)✅ Support: $2,880 (Key Support) & $2,760 (Major Support)📊 Possible Scenarios:📌 Bearish Continuation: If the price fails to reclaim $2,925, we may see a drop to $2,880, and potentially $2,760 if bearish pressure continues.📌 Reversal Opportunity: A bounce from $2,880 could lead to a retest of the upper range near $2,950.💬 Will gold break down further or find support for another push higher? Let me know in the comments! 🔥👇#gold #xauusd #forex #trading #priceaction #technicalanalysis
NexusTradesZone
GOLD (XAU/USD) – Breakout or Deeper Pullback?

Hello, Traders! 👋What are your thoughts on gold?Gold remains in a robust uptrend, with each downturn providing a buying opportunity inside the trend.The ideal strategy at this point is to wait patiently for a price pullback to support levels before starting a buy position.Another method is to wait for a break above the most recent high before buying on a pullback to the broken level.The bullish trend continues, but trades must be performed with correct risk management and confirmation indications.What is your opinion on gold? Do you anticipate further growth?🚀 GOLD (XAU/USD) – Breakout or Deeper Pullback? 🔥💰 Gold Spot (XAU/USD) - 8H Chart Analysis🔍 Market Insights:🔹 Strong Uptrend: Gold continues to hold its bullish momentum, respecting the ascending trendline.🔹 Key Resistance Zone: The $2,945 - $2,960 area has been acting as a supply zone (black box).🔹 Fibonacci Support: Price recently tested the 0.236 Fib levels ($2,902 & $2,871), which align with a key demand zone (yellow box).📈 Two Potential Scenarios:📌 Bullish Breakout: If price holds above the trendline & reclaims resistance, we may see a breakout towards $2,980 - $3,000 🚀.📌 Deeper Pullback: If support breaks, we could see a correction to $2,875 - $2,850 before a stronger reversal.📊 Key Levels to Watch:✅ Support: $2,902 - $2,871 (Fib Levels & Trendline)✅ Resistance: $2,945 - $2,960 (Supply Zone)💬 Do you think gold will break out or dip before the next leg up? Drop your thoughts below! 🔥👇#gold #xauusd #forex #trading #priceaction #technicalanalysis
Disclaimer
Any content and materials included in Sahmeto's website and official communication channels are a compilation of personal opinions and analyses and are not binding. They do not constitute any recommendation for buying, selling, entering or exiting the stock market and cryptocurrency market. Also, all news and analyses included in the website and channels are merely republished information from official and unofficial domestic and foreign sources, and it is obvious that users of the said content are responsible for following up and ensuring the authenticity and accuracy of the materials. Therefore, while disclaiming responsibility, it is declared that the responsibility for any decision-making, action, and potential profit and loss in the capital market and cryptocurrency market lies with the trader.