Technical analysis by NexusTradesZone about Symbol PAXG: Buy recommendation (2/27/2025)

NexusTradesZone
Gold/USD Wyckoff Distribution Breakdown – Trend Reversal or Buy
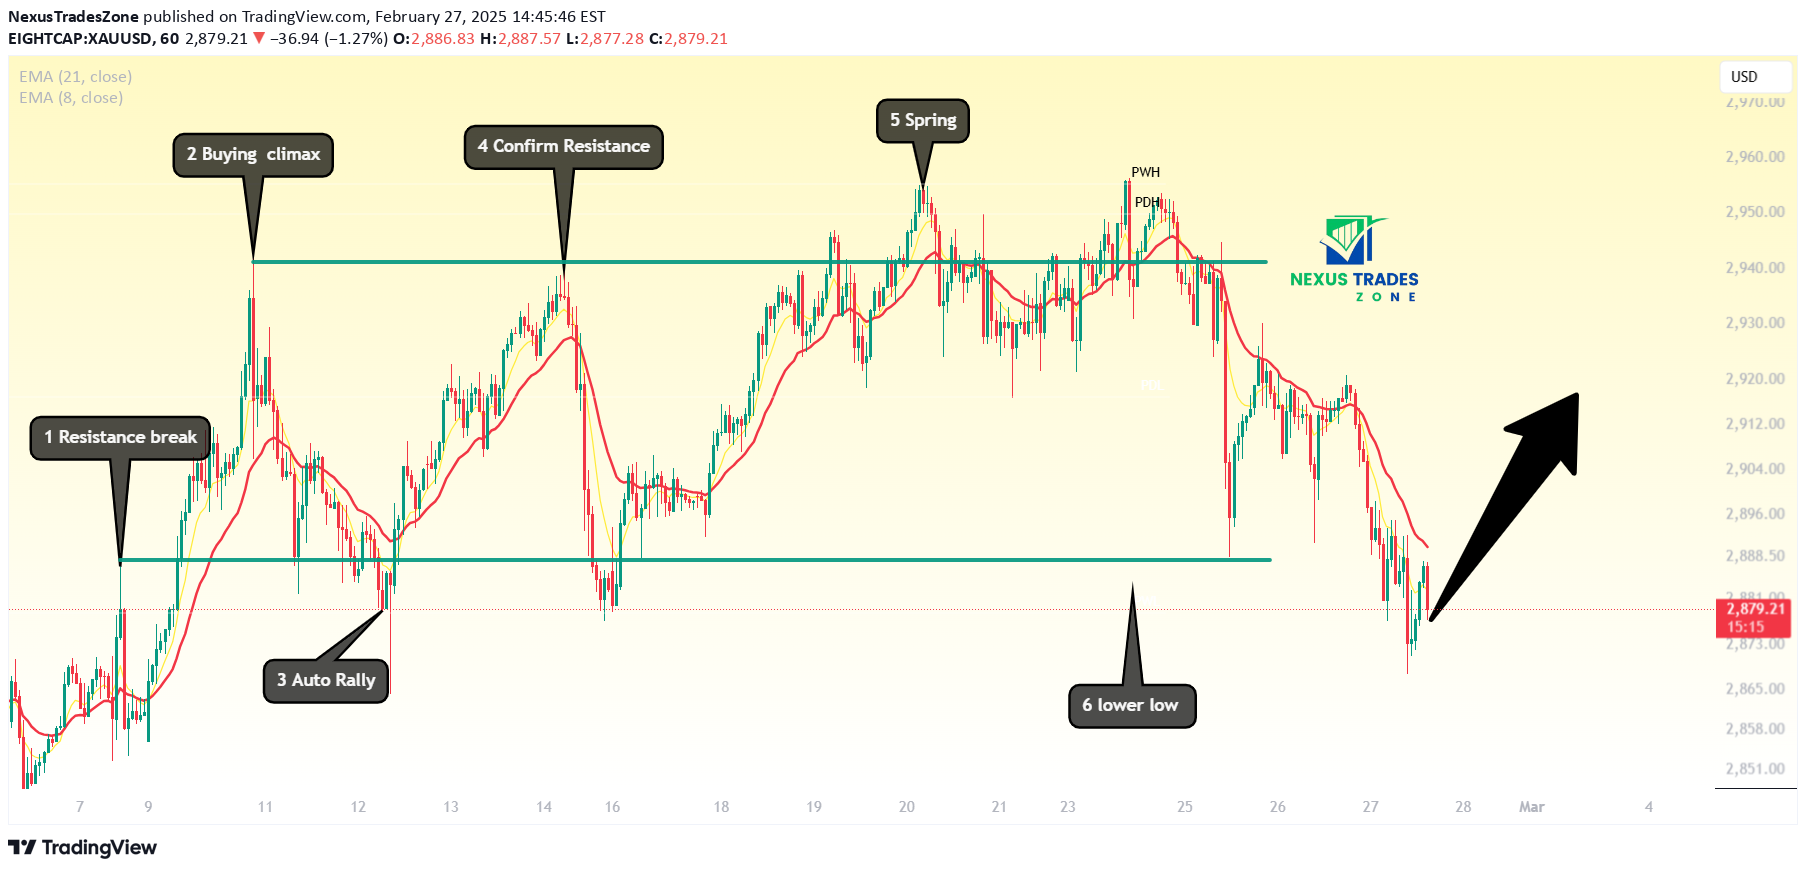
Chart Analysis & Trade Setup:This XAU/USD (Gold/US Dollar) 4H chart illustrates a classic Wyckoff Distribution pattern, signaling a potential trend reversal. After reaching a buying climax, Gold has broken below key support, forming lower lows, which suggests further bearish pressure.Wyckoff Structure Breakdown:1️⃣ Resistance Break – The initial bullish breakout created new highs.2️⃣ Buying Climax (BC) – A strong move up exhausted buyers.3️⃣ Automatic Rally (AR) – Price retraced but held above previous support.4️⃣ Resistance Confirmation – Price tested resistance again, forming a double-top pattern.5️⃣ Spring Formation – A false breakout attempt before distribution.6️⃣ Lower Low Formation – The price has now broken below major support, signaling potential further downside.Trade Plan & Key Levels:✅ Potential Long Entry: If price forms a bullish reversal pattern around 2,880 - 2,885 USD, traders may look for long positions targeting 2,920 - 2,940 USD.📉 Bearish Continuation: If Gold fails to reclaim 2,900 USD, the next downside target is 2,850 USD.🎯 Target 1: 2,920 USD (Short-term resistance).🎯 Target 2: 2,940 USD (Key swing high).🛑 Stop Loss: Below 2,865 USD to manage risk.