
MyNewTrading
@t_MyNewTrading

What symbols does the trader recommend buying?
Purchase History
پیام های تریدر
Filter
Signal Type
MyNewTrading
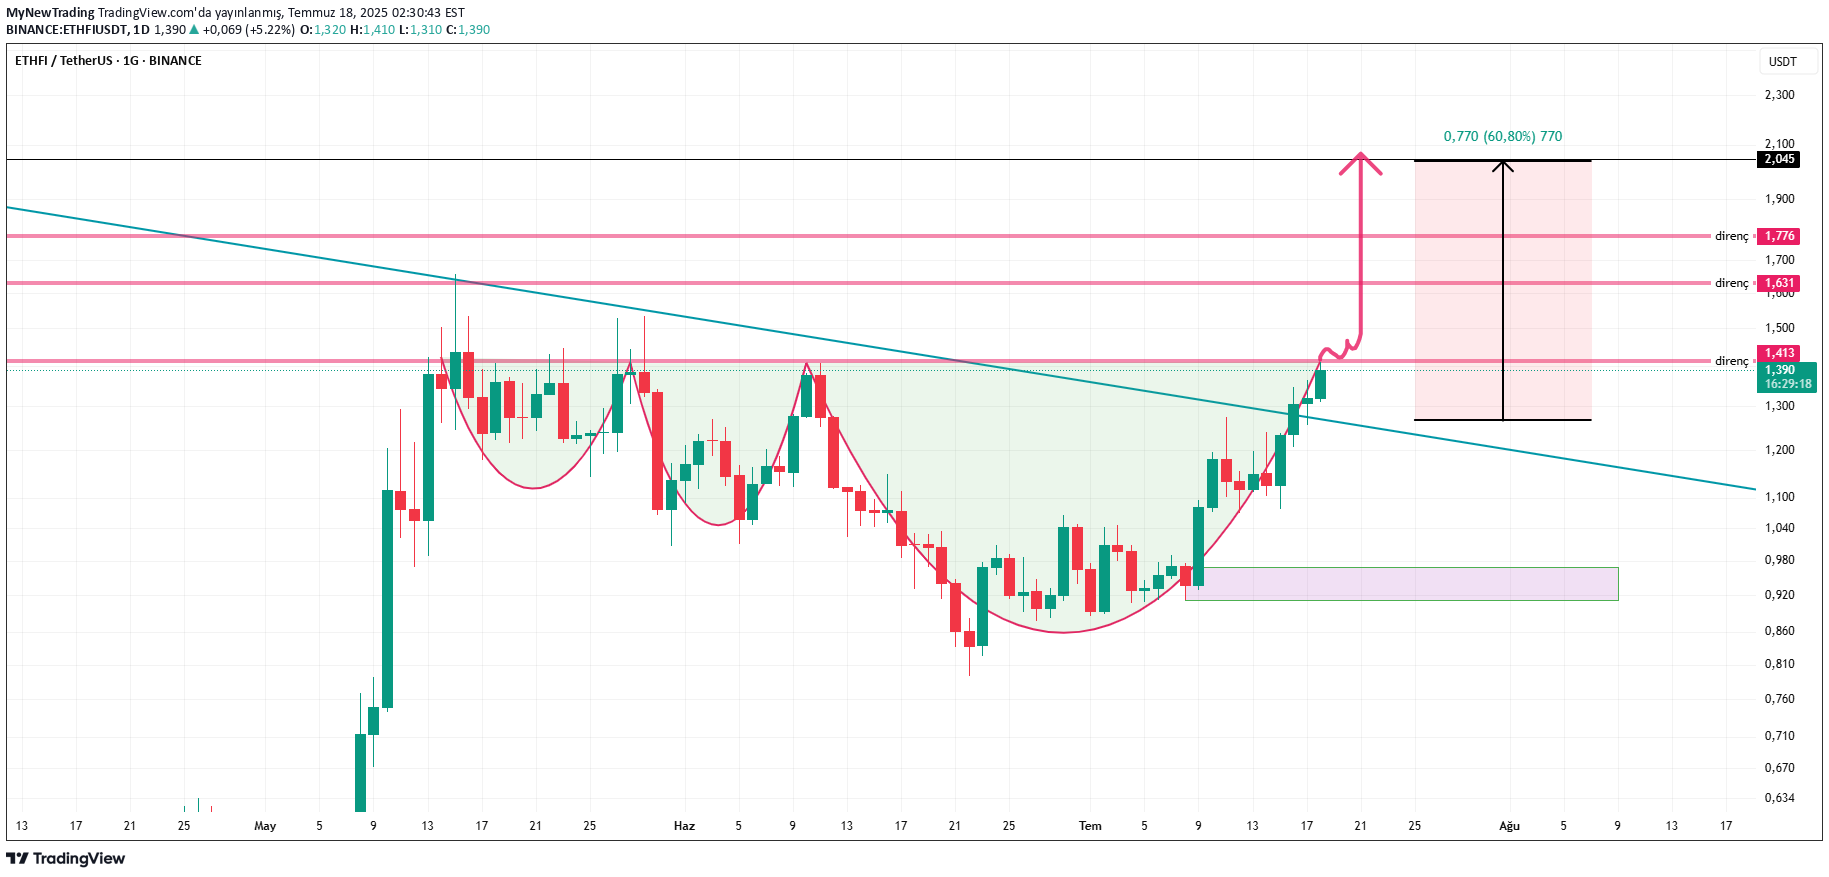
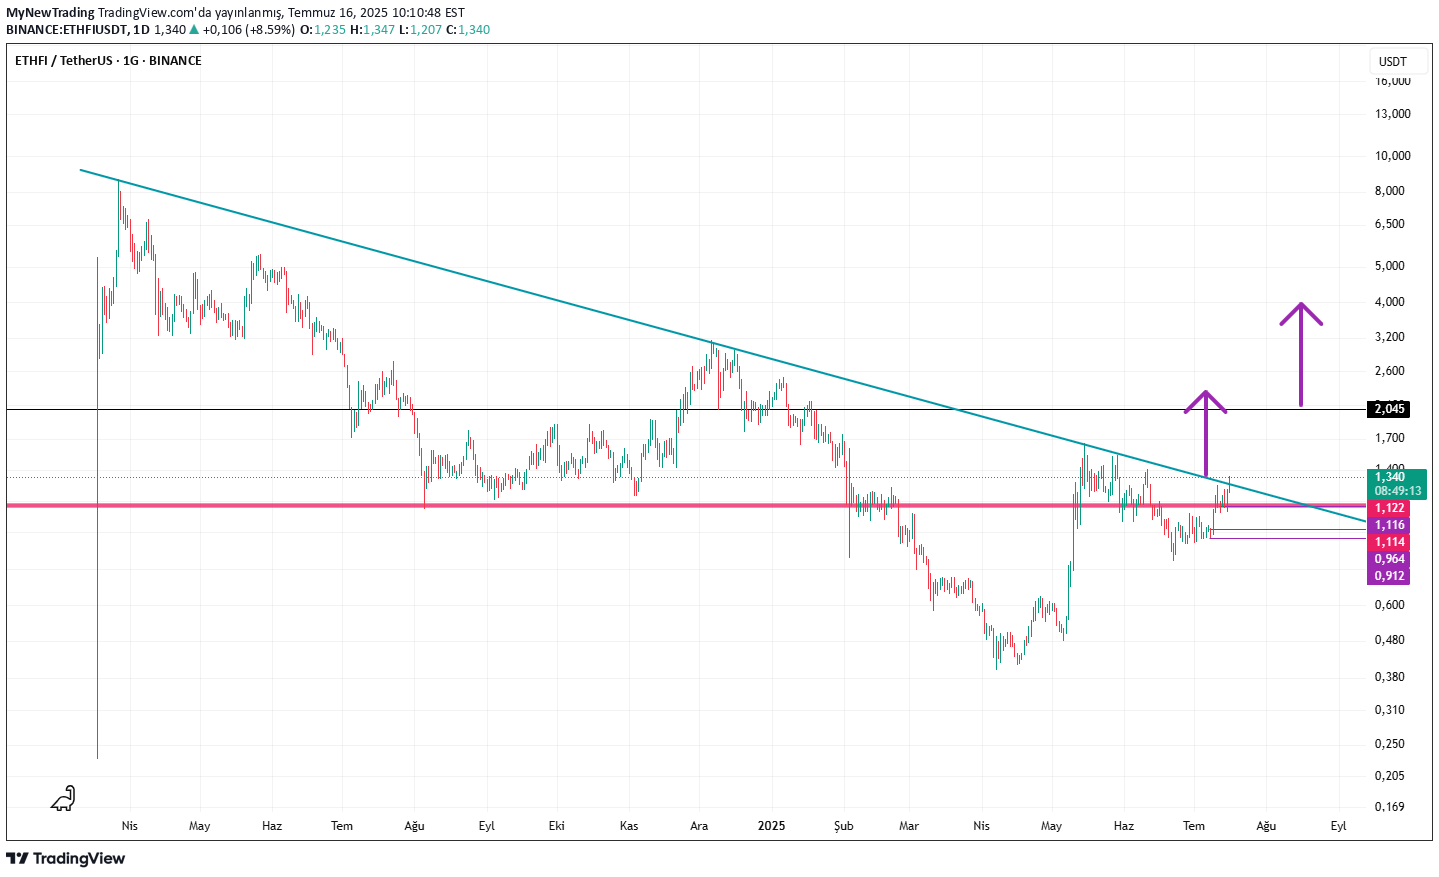
Formation: man & home Status: The neckline (1,413) is tested after falling frustration. Condition: Permanence over 1.413 Target: 2.045 YTD. ENGLSIH: Formation: man & home Status: testing the neckline (1,413) After the Downward Breakout. Condition: Staying Above 1,413 Target: 2,045. Note involve advice.
MyNewTrading
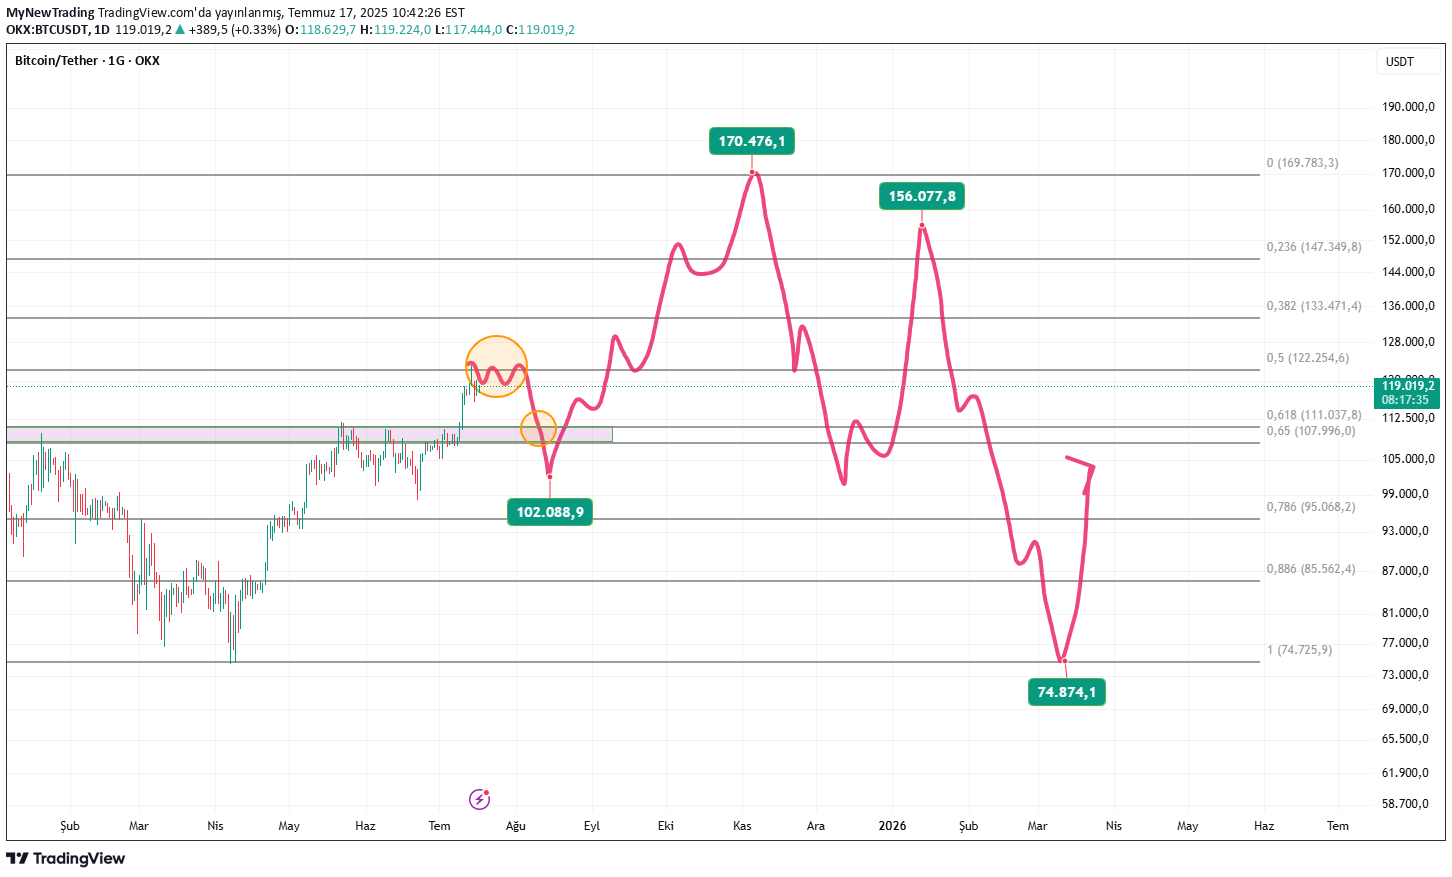
Turkish: 📉 BTCUSDT Technical Scenario, until March 2026. BTC, which faces strong resistance in the 118,000-122.000 band, may show horizontal cruise in this region for a while. In this process, the head - shoulder - head (BOB) formation may be deep. It is likely to withdraw the price after this retest to 102,000 levels. In the medium term, a new summit attempt can be seen up to 170,000 levels by re -power. However, with long -term sales pressure, the possibility of harsh correction up to 75,000 levels is maintained. 🔄 High volatility, risk management is critical. 📌 It is not an investment advice. English: 📉 BTCUSDT Technical Scenario, Until March 2026. Encountering Strong Resistance in the 118,000-122,000 Range, BTC May trend sideways in this region for a when. The Head-Shoulders-Head (BOB) Formation that formation this period may have a tedeep retratement. Following this retraction, The Price is likely to retreat to 102,000. In the Medium Term, it may regain strength and attempt a new peak of 170,000. Howver, in the Long Term, A Sharp Correction to 75,000 Remains Possible Due to Selling Pressure. 🔄 Volatility is high, and Risk Management is Critical. 📌 Not Investment Advice.
MyNewTrading
MyNewTrading
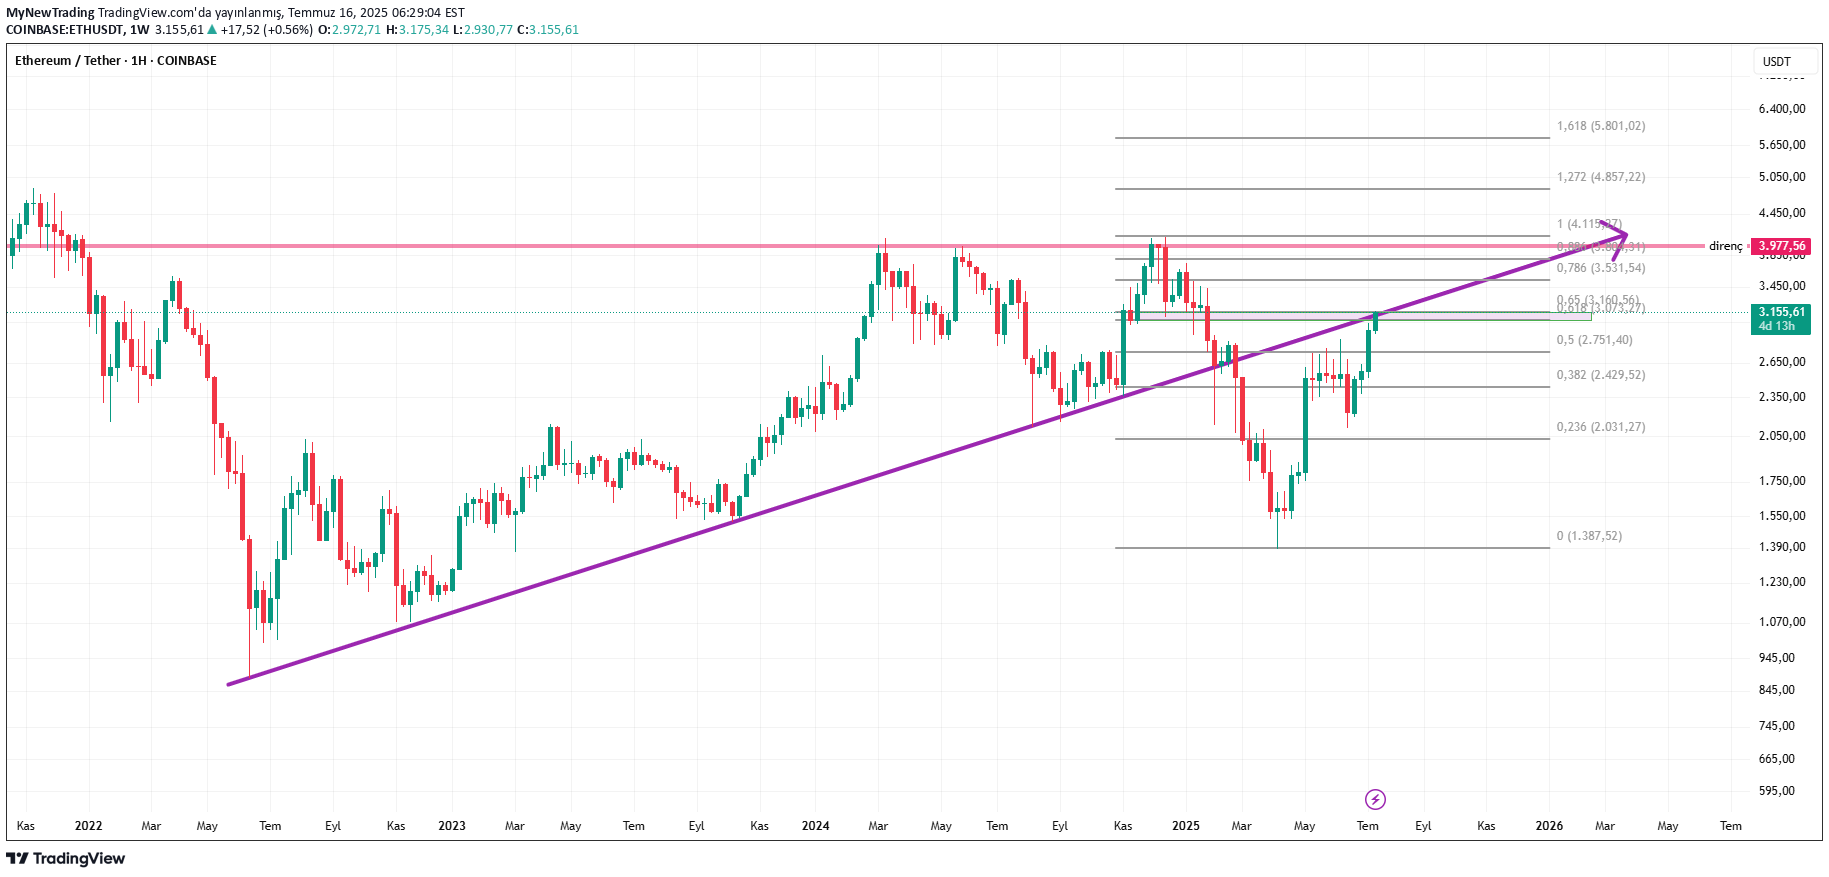
TURKISH: In the weekly graph, the Retest area is expected to increase in the case of closing weekly candles. When Fibonacci attracts from top to bottom (ie the decline): Golden Pocket level: 0.618 - 0.65. If the price rises, these levels work as resistance. In other words, the price can go back to this level and there is a high probability of rejection there. ENGLISH: IF The Weekly Candles Close Above the retracement zone on the weekly chart, a rise is expired. WHEN there is a fibonacci retracement from Above (i.e., Bearish): Golden Pocket Level: 0.618 - 0.65. IF The Price Rises, these levels act as Resistance. In other Words, The Price Cult Rise to this Level on a retraction, and Rejection is likely.
MyNewTrading
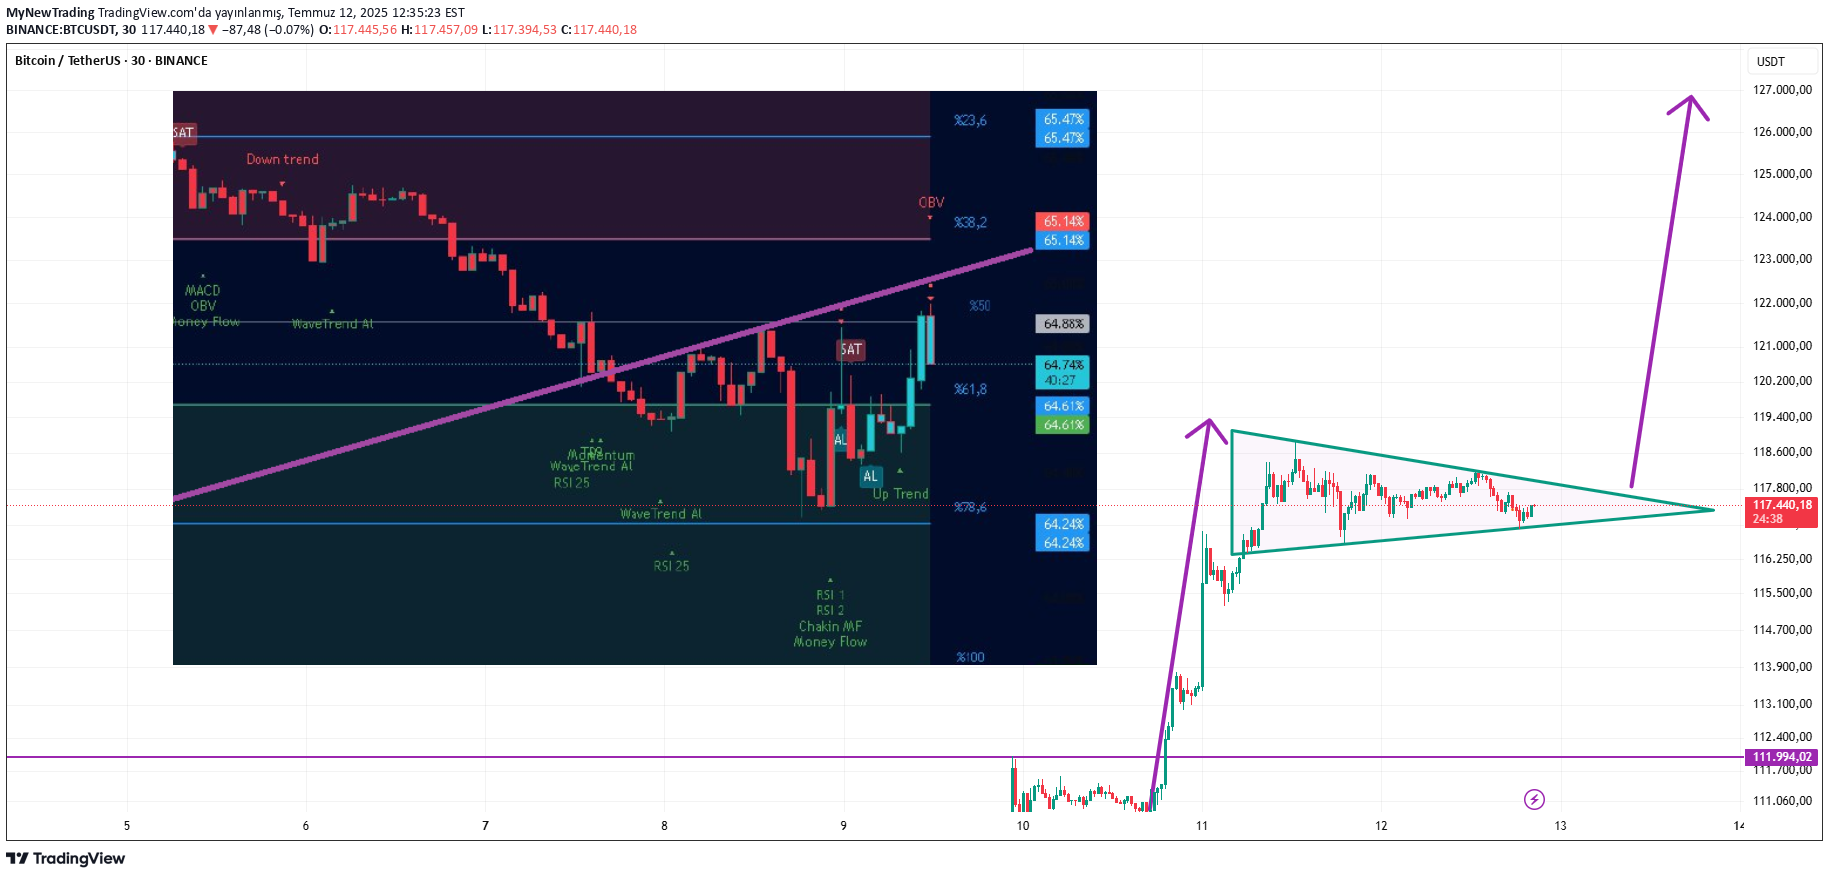
Turkish: 📈 Current Bitcoin Analysis and Dominance Interpretation The graph is observed in a short -term bull flag formation in Bitcoin. The technical goal of the formation is approximately 126,000 USDT level. If the formation frustration on the right side is upward, a strong movement towards the target can be expected. Sol The top graph is the 1D (1 -day) appearance of Dominance. Dominance is currently an important resistance area. If a horizontal cruise in this area is followed and a downward break occurs, this creates a positive scenario for subcoins and we can see serious premiums in subcoins. However, if the Dominance rises by breaking the resistance zone while continuing the rise of Bitcoin, the possibility of crushing the subcoins against Bitcoin is reduced. This scenario means a balanced rise in the market. 🚨 The most negative scenario to consider: < In this case, both Bitcoin decreases and subcoins can be much deeper retreats. This is the most unwanted scenario for us. English: 📈 Current Bitcoin Analysis and Dominance Commentary The Chart Shows a Short-Term Bull Flag Formation For Bitcoin. The Technical Target of the Formation is Approximately 126,000 USDT. IF The Formation on the Right Breaks to the Upside, Astrong Move Towards the Target Can Be Expected. The Upper Left Chart is the 1D (1-DAY) View of Bitcoin Dominance. Dominance is Currently in A Key Resistance Zone. IF it Continues Trading Sideories in this Cult Creat Create A Positive Scenario For Altcoins, and We Cult See Signification Gains in Altcoins. Howver, if Bitcoin Continues its Rise and The Dominance Breaks Through The Resistance Zone, The Likelihood of Altcoins Being Crushed by Bitcoin Decreases. This Scenario Suggests a Balanced Rise for the Market. 🚨 The Most Negative Scenario to Conside: Bitcoin Price Declines Who the Dominance Breaks Above The Resistance Zone. In this case, both Bitcoin and Altcoins Could See a Muche Pullback. This is the Most Undesirable Scenario For Us.
Disclaimer
Any content and materials included in Sahmeto's website and official communication channels are a compilation of personal opinions and analyses and are not binding. They do not constitute any recommendation for buying, selling, entering or exiting the stock market and cryptocurrency market. Also, all news and analyses included in the website and channels are merely republished information from official and unofficial domestic and foreign sources, and it is obvious that users of the said content are responsible for following up and ensuring the authenticity and accuracy of the materials. Therefore, while disclaiming responsibility, it is declared that the responsibility for any decision-making, action, and potential profit and loss in the capital market and cryptocurrency market lies with the trader.