
Mr_Expert7-
@t_Mr_Expert7-

What symbols does the trader recommend buying?
Purchase History
پیام های تریدر
Filter
Mr_Expert7-
XAUUAD NEXT WEEK TARGET

This is a 2-hour candlestick chart for Gold Spot against the U.S. Dollar (XAU/USD), published on TradingView. Here's a breakdown of the technical details and indications:Chart OverviewCurrent Price: $3,325.390Change: +19.410 (+0.59%)Technical Patterns & Analysis1. Uptrend Channel (Early May):A bullish channel was formed between May 3–6.Price moved steadily upwards within this channel, supported by higher lows and higher highs.2. Descending Channel (Correction):Starting around May 6–7, a descending parallel channel appeared, indicating a correction or consolidation phase.3. Wedge & Breakout Zone:Within the descending channel, a falling wedge pattern was identified, potentially a bullish reversal pattern.The breakout of the wedge to the upside indicates a bullish signal.4. Support & Resistance Zones:Support Zone: Around the $3,200 mark—highlighted by a purple box, suggesting a strong demand area.Immediate Resistance: Just above the $3,325 price level.Target Resistance Zone: Around $3,400—highlighted with an arrow, suggesting the next major target if the bullish move continues.5. Potential Price Path:The chart suggests two potential scenarios:A bullish continuation toward $3,400 after consolidating around current levels.A possible pullback to the $3,200 support zone before resuming upward momentum.Would you like an interpretation of this chart from a trader’s perspective (e.g., possible entries, stop-loss, targets)?
Mr_Expert7-
What is today BTC market update?
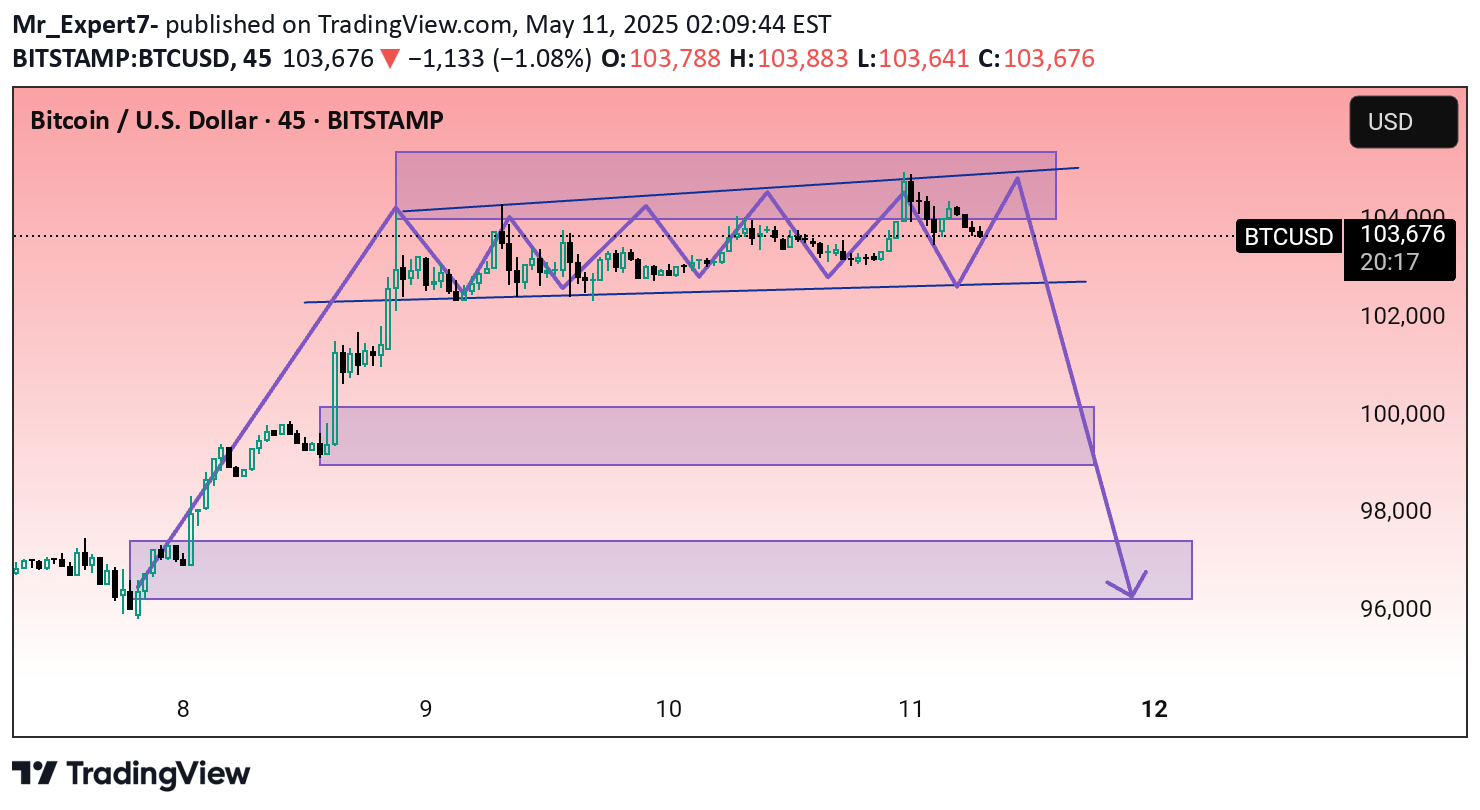
This chart shows the Bitcoin (BTC/USD) trading pair on a 45-minute timeframe from the BITSTAMP exchange. It appears to be a technical analysis chart predicting a potential bearish breakout from a consolidation pattern.Here are the key details and interpretations:1. Current Price: $103,667 (as of the chart timestamp).2. Price Action:BTC has been trading inside a rising wedge or channel (marked in purple).A series of lower highs and higher lows indicate consolidation and decreasing momentum.The breakout to the downside suggests bearish pressure.3. Bearish Target Zones:The chart includes three horizontal purple rectangles marking potential support zones:Around 100,000 USDAround 98,000 USDFinal target near 96,000 USDA long downward arrow suggests a forecasted move toward these lower support levels.4. Pattern & Strategy:The purple zigzag lines show the price fluctuation within the pattern.A possible descending move is anticipated after the breakdown from the wedge/channel.This suggests a bearish short-term outlook unless BTC regains and holds above the upper boundary of the channel.Would you like help identifying possible entry/exit points or risk management tips based on this chart?
Mr_Expert7-
XAUUAD MARKET NEW

Thanks for clarifying! Based on the chart you shared, here are the signal details:Instrument: Gold Spot (XAU/USD)Timeframe: 15-minute chartCurrent Price: Around 3,230 USDTrend: Bearish continuationKey Levels (Fibonacci Retracement):0%: 3,23923.6%: 3,22738.2%: 3,21950%: 3,21461.8%: 3,20878.6%: 3,199100%: 3,189Projected Move: After a minor retracement up to the 0.236 or 0.382 level (~3,227 to 3,219), the price is expected to resume downward, targeting deeper Fibonacci levels.Risk Area: The grey-shaded box indicates the potential retracement zone where sellers may re-enter.Take-Profit Zone: Likely near 3,199 or lower, as suggested by the arrow targeting the 0.786 to 1.0 Fibonacci zone.Stop-Loss Consideration: Above the swing high (~3,239) to manage risk.Would you like a written trading plan based on this, or deeper analysis of the market context?
Mr_Expert7-
ETHUSD NEW UPDATE CHART

This chart shows a technical analysis for Ethereum (ETH/USD) on the 45-minute timeframe, posted on May 1, 2025. Here's a breakdown of the chart elements and what they suggest:Key Observations:Current Price: $1,809.5, up by $15.5 (+0.86%).Chart Pattern: Descending channel or bearish flag.The upper trendline (resistance) is sloping down, touching recent highs.The lower trendline (support) is also slightly sloping downward or flat.Bearish Setup:Price is approaching the resistance zone (orange shaded area).A potential rejection is illustrated by the downward arrow, targeting a drop toward the $1,725–$1,730 support area.Projection:After the slight bullish move to retest the upper boundary, a sharp drop is anticipated—likely a continuation of a broader downtrend.Support Level: Around $1,725, where the price may find demand or consolidate.This setup indicates a possible short opportunity if the price gets rejected at the upper trendline and fails to break above it decisively.Would you like help identifying an entry/exit strategy based on this analysis?
Mr_Expert7-
XAUUAD NEW Update Chart

The chart you shared is a technical analysis of Gold (CFDs on Gold, US$/oz) on the 45-minute timeframe, as published on TradingView. Here are the key details:Current price: $3,237.55, down 51.485 (-1.57%).Resistance zone: around $3,370 - this level is marked with a blue line and an orange-red box indicating pre-selling pressure.Support zones:Intermediate support: around $3,197.41.Lower support: around $3,124.54, shown with a green box indicating a buy zone.Pattern analysis: The chart appears to illustrate a potential bearish setup:A rising wedge breakdown followed by a retest.An expected minor pullback (blue arrow path forecast) before continuing downwards. Price Prediction:If the $3,197 level fails to hold, bearish momentum could push the price to $3,124 or lower.A temporary bounce or pullback is expected after hitting support before further declines.Would you like analysis for a different timeframe or a fundamental view along with this technical one?
Mr_Expert7-
XAUUAD PPI NEWS TARGET

This is a technical analysis chart for CFDs on Gold (USD/OZ) using a 10-minute timeframe with the Line Break [3] chart type on TradingView.Here's a breakdown of the key elements visible:1. Current Price:Buy: 3,303.036Sell: 3,302.786Market Price Label (GOLD): 3,305.0302. Key Levels (marked on the right):Support Zones: 3,054.178, 3,082.328, 3,089.191, 3,201.561, 3,284.214Resistance Zones: 3,356.485, 3,516.906, 3,618.3813. Technical Pattern:There's a bullish projection drawn with a blue arrow, suggesting a potential breakout above the 3,356.485 resistance level.The price action shows a correction or consolidation pattern following a sharp drop, indicating a possible bullish flag or inverse head-and-shoulders formation.4. Indicators:Highlighted colored zones (orange, red, green) likely represent supply and demand areas or Fibonacci retracement zones.A horizontal blue line at around 3,356.485 is marked as a key resistance level.5. Projected Move:The chart anticipates a bullish breakout to possibly the 3,516 or 3,618 zone if the price breaks and closes above 3,356.485.Would you like help analyzing the potential entry/exit points or setting stop-loss and take-profit levels?
Mr_Expert7-
BITCOIN TODAY MARKET PLAN

Here's the analysis of the BTCUSD (Bitcoin to USD) chart from Bitstamp, using a 45-minute Line Break [3] chart:---Key Observations:1. Chart Type:This is a Line Break [3] chart, which filters out small price fluctuations.It only forms a new line when price breaks the high or low of the previous three lines, offering a clearer trend view.2. Current Price Levels:Price: Around 93,848 USDSell Price: 94,537 USDBuy Price: 94,543 USD3. Structure & Zones:Resistance Zone (orange shaded): Around 94,556 to 95,324 USD.Support Zone (yellow shaded): Around 84,000 to 88,000 USD.Price recently rejected the resistance area and is showing a downward movement.4. Bearish Breakdown Indicated:The blue arrow suggests a potential drop to the lower support zone.The horizontal blue line at around 94,556 could have acted as previous support, now turned resistance.---Trading Insight:Bias: Bearish unless price reclaims and holds above 95,324 USD.Entry Idea: Short below 93,800–94,000 USDTarget: 88,000–84,000 USD zoneStop-loss: Above 95,300 USDWould you like me to help you create a full trade setup or backtest a similar pattern?
Mr_Expert7-
XAUUAD MARKET

The chart you've shared is a Renko chart for Gold CFDs (US$/OZ) using ATR(14), 3 settings on a 5-minute timeframe. Here's a detailed analysis based on the visual:Key Observations:1. Sideways Consolidation:Price is currently moving in a horizontal channel between approximately 3,280 and 3,360 USD.The yellow-shaded boxes mark this range-bound zone, suggesting indecision in the market.2. Support and Resistance:Support zone: Around 3,280–3,290 USD.Resistance zone: Around 3,360–3,370 USD.3. Buy/Sell Levels:Sell price: 3,310.710Buy price: 3,310.940Current spot price is around 3,306 USD.4. Arrows Suggest a Breakout:Blue arrows indicate potential breakout directions:If price breaks above resistance → Potential bullish trend continuation.If price breaks below support → Possible bearish movement.5. ATR-based Renko Chart:This chart type smooths out noise, focusing only on price movement, ignoring time.ATR(14), box size 3 means each Renko block forms when price moves 3 USD, filtered by 14-period ATR.What This Means for Traders:Neutral/balanced sentiment: No strong trend—wait for breakout confirmation.Trading idea:Buy above 3,370 with a stop-loss below breakout point.Sell below 3,280 with a stop-loss above the breakdown.Would you like me to generate a trading plan or provide historical context on similar setups?
Mr_Expert7-
"Bullish Reversal Setup for XAU/USD with Targeted Take Profits"

📈 Technical Analysis Summary✅ Trend ContextPrior Trend: Strong bullish rally (uptrend from April 17–22).Current Move: Sharp pullback, testing potential support zone (~$3,366).Market Sentiment: Appears to be anticipating a bullish reversal for continuation of the uptrend.🔍 Chart Breakdown🟢 Entry ZoneAround $3,366–$3,375 – current price is consolidating near this level.This zone is potentially a support level after the recent sell-off.🎯 Take Profit (TP) LevelsTP 1 – ~$3,405: Initial resistance level; minor structure.TP 2 – ~$3,435: Stronger resistance zone; mid-range consolidation level.Final TP – ~$3,490: Full target; retest of the previous swing high.These levels act as both profit-taking zones and potential reversal zones for partial exits.🔻 Risk ManagementImplied Stop Loss: Likely placed below the swing low (~$3,365 or slightly lower), minimizing downside risk.Risk-to-Reward (R:R): Appears favorable – roughly 1:2 to 1:3 depending on exact entry.🔄 Expected Price PathChart shows a V-shaped recovery with stair-step targets.Blue arrows indicate bullish progression through resistance levels.📊 Volume InsightNotably high volume on the recent sell-off suggests:Possible capitulation or stop-hunting before a reversal.Smart money accumulation could be underway.🧠 Trading Plan (Based on Chart Idea)StepAction🔍 EntryBuy near $3,366–$3,375🎯 TP1Close partial at ~$3,405🎯 TP2Close more at ~$3,435🎯 Final TargetExit rest at ~$3,490🛡️ Stop LossBelow $3,365 (e.g., $3,360 or $3,355)
Mr_Expert7-
"BTC/USD Testing Key Resistance – Watch for Bullish Breakout

This chart is a technical analysis of Bitcoin (BTC) vs. US Dollar (USD) on a 45-minute timeframe, 🔍 Key Observations:Resistance Zone (Red Highlighted Area):The red shaded area marks a strong resistance zone where price has been rejected multiple times (highlighted with orange circles).This zone is roughly between 85,000 - 86,400 USD.Support Level:There's a clear horizontal support line around 84,714 USD where price has bounced off before.This support level is crucial to maintain the current structure.Bullish Breakout Attempt:The chart indicates BTC has recently tested the resistance zone again and pulled back slightly.The blue arrow suggests a possible bullish scenario, where price may retest the support and then break upward toward the resistance and potentially through it.Volume Analysis:Volume seems to be increasing slightly with each attempt to push higher, which could signal accumulation and a potential breakout if the momentum holds.Chart Setup:The grey rectangle shows the potential risk-to-reward zone, favoring a bullish move toward the upper end of resistance (~86,441 USD).The arrow implies a buy-the-dip strategy around the current support level, targeting a move upward.📈 Bullish Bias If:Price holds the 84,700 support and forms a higher low.Breakout above 86,000–86,400 resistance with strong volume.⚠️ Bearish Scenario If:Price breaks below 84,700 with volume, invalidating the setup.This could lead to a deeper retracement or consolidation below resistance.
Disclaimer
Any content and materials included in Sahmeto's website and official communication channels are a compilation of personal opinions and analyses and are not binding. They do not constitute any recommendation for buying, selling, entering or exiting the stock market and cryptocurrency market. Also, all news and analyses included in the website and channels are merely republished information from official and unofficial domestic and foreign sources, and it is obvious that users of the said content are responsible for following up and ensuring the authenticity and accuracy of the materials. Therefore, while disclaiming responsibility, it is declared that the responsibility for any decision-making, action, and potential profit and loss in the capital market and cryptocurrency market lies with the trader.