Technical analysis by Mr_Expert7- about Symbol BTC on 5/11/2025

Mr_Expert7-
What is today BTC market update?
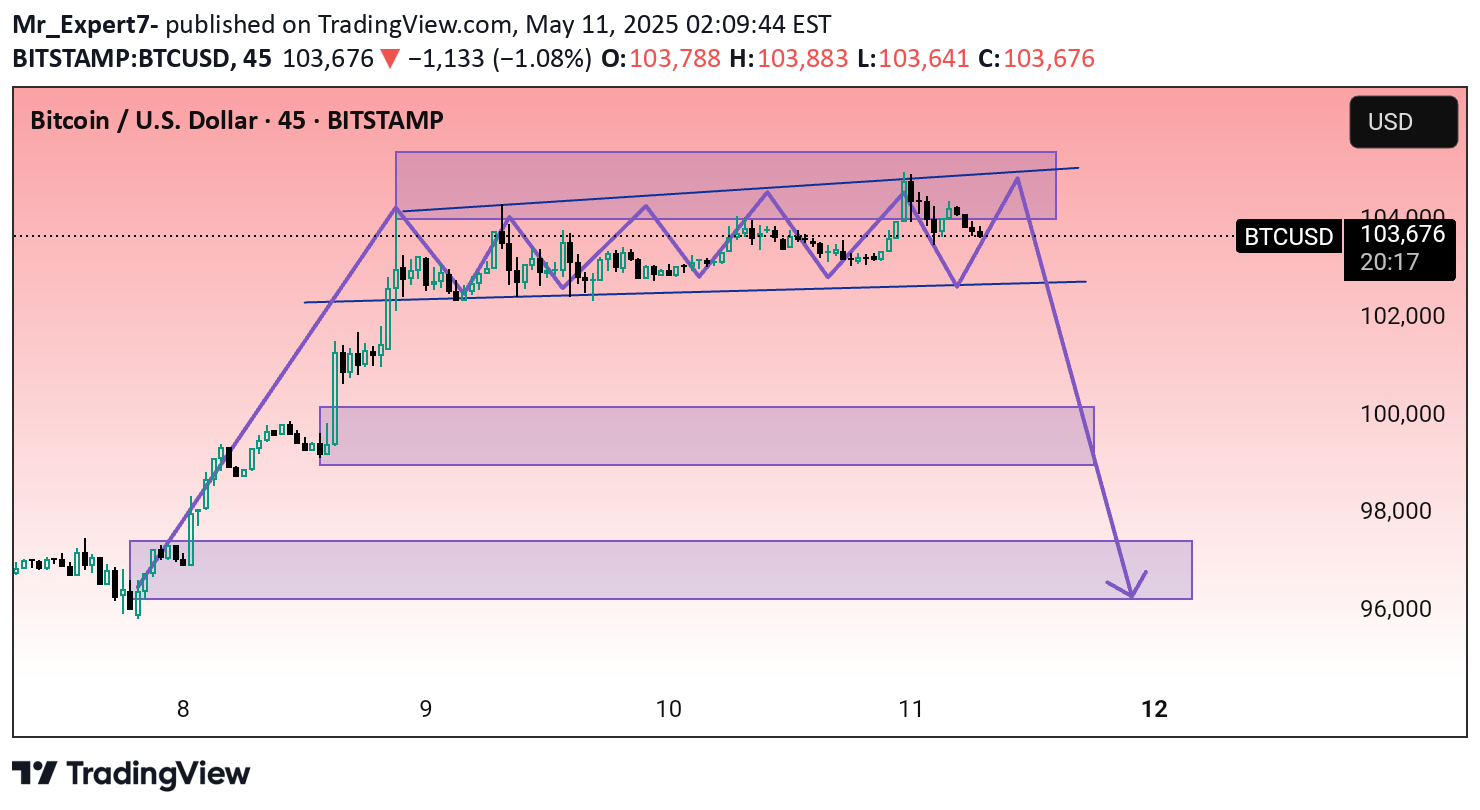
This chart shows the Bitcoin (BTC/USD) trading pair on a 45-minute timeframe from the BITSTAMP exchange. It appears to be a technical analysis chart predicting a potential bearish breakout from a consolidation pattern.Here are the key details and interpretations:1. Current Price: $103,667 (as of the chart timestamp).2. Price Action:BTC has been trading inside a rising wedge or channel (marked in purple).A series of lower highs and higher lows indicate consolidation and decreasing momentum.The breakout to the downside suggests bearish pressure.3. Bearish Target Zones:The chart includes three horizontal purple rectangles marking potential support zones:Around 100,000 USDAround 98,000 USDFinal target near 96,000 USDA long downward arrow suggests a forecasted move toward these lower support levels.4. Pattern & Strategy:The purple zigzag lines show the price fluctuation within the pattern.A possible descending move is anticipated after the breakdown from the wedge/channel.This suggests a bearish short-term outlook unless BTC regains and holds above the upper boundary of the channel.Would you like help identifying possible entry/exit points or risk management tips based on this chart?