
MollyRonaldFx
@t_MollyRonaldFx

What symbols does the trader recommend buying?
Purchase History
پیام های تریدر
Filter
Gold Price Breakout: Bullish Momentum Targets 3250
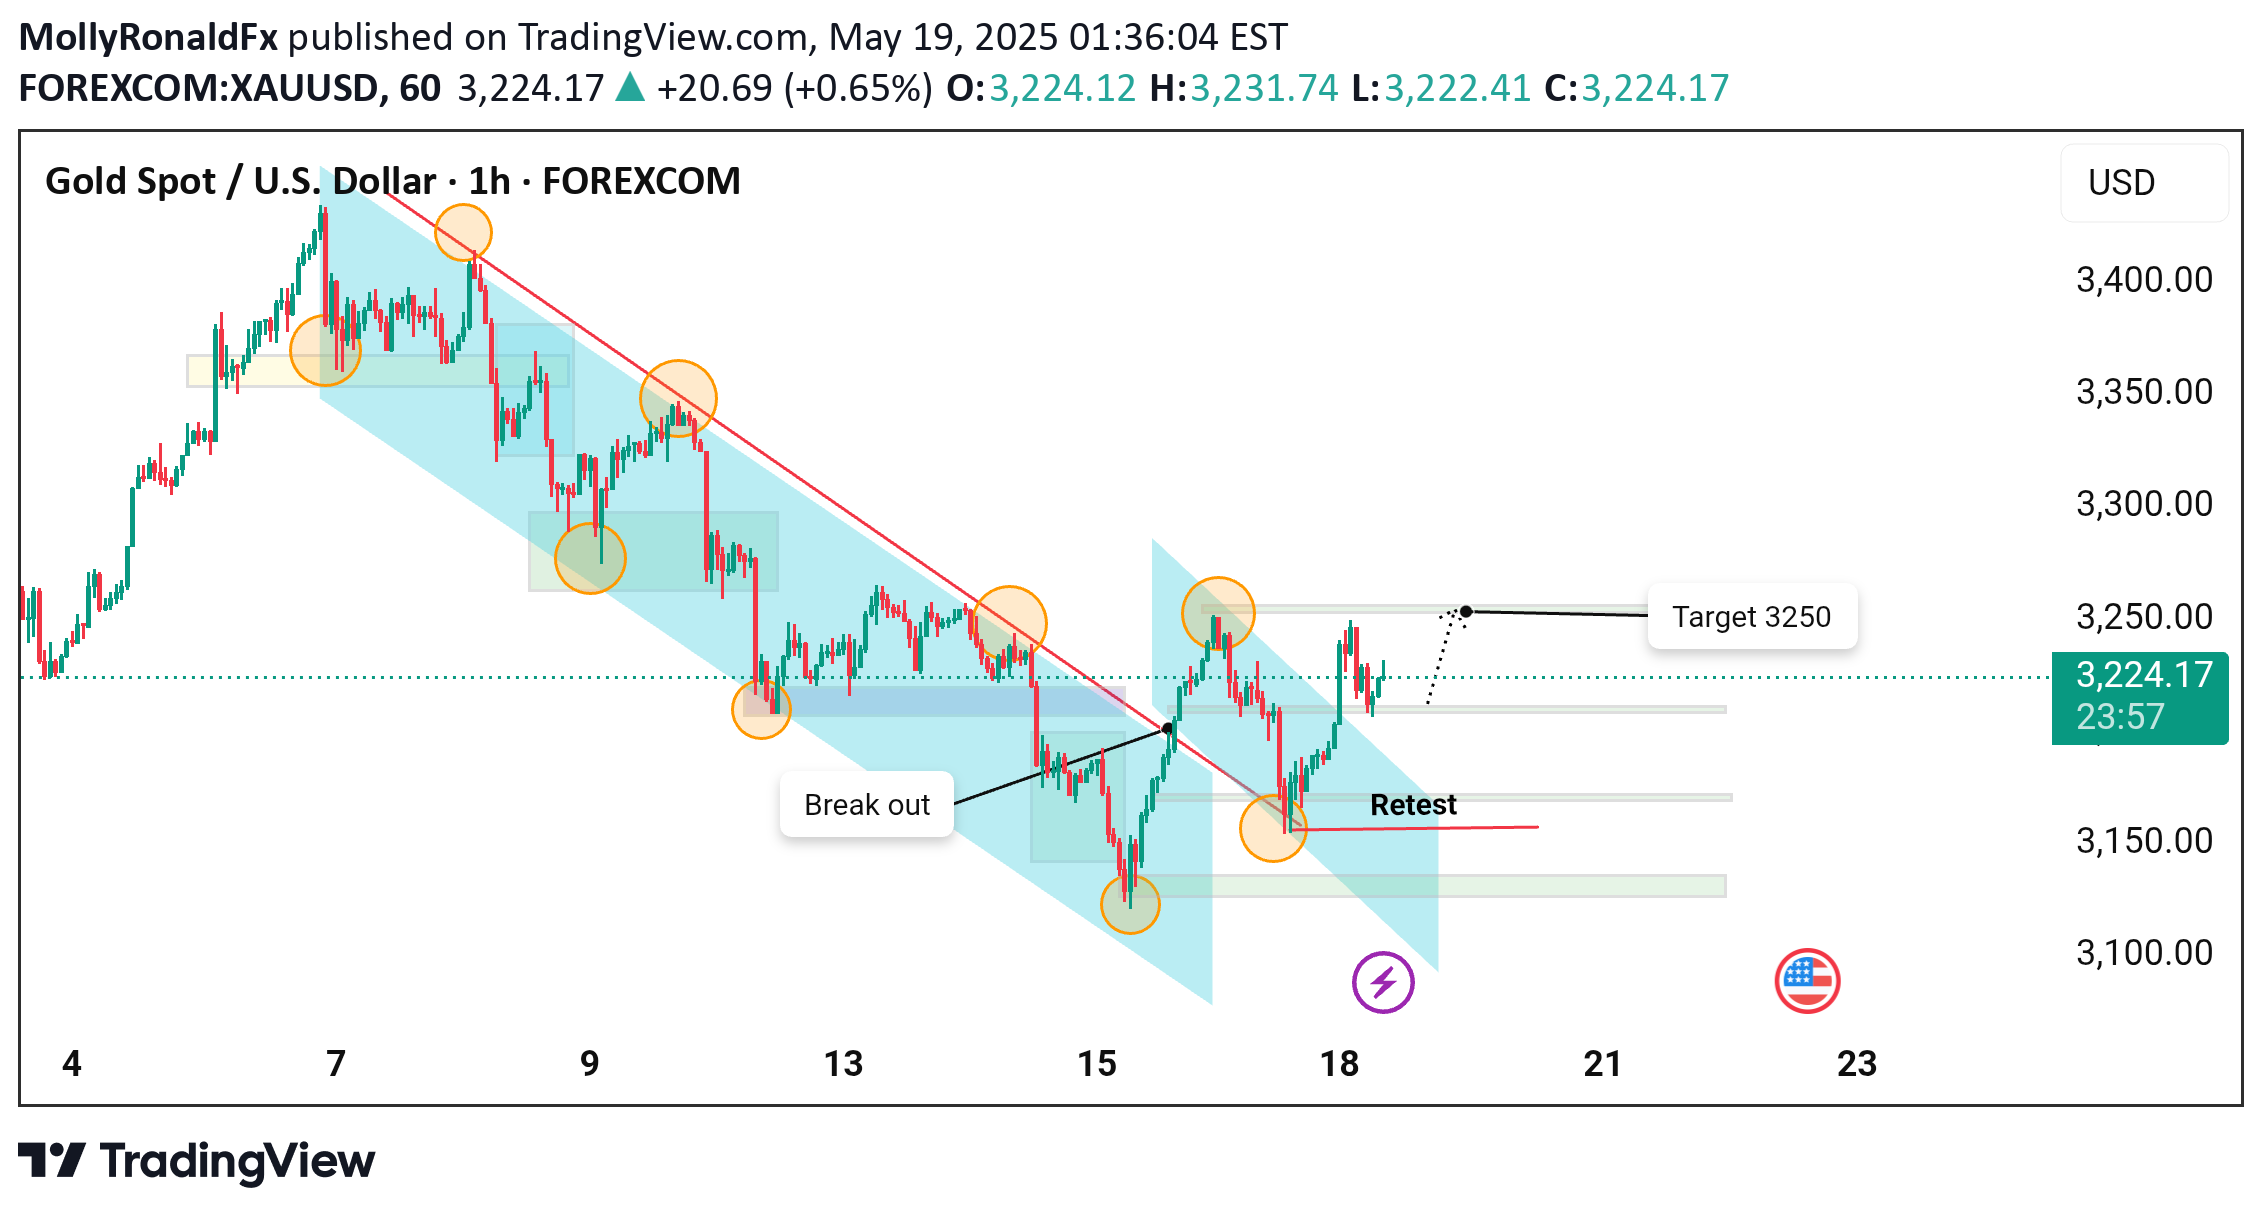
Chart Analysis:1. Downward Channel: The chart initially displays a well-defined descending channel, marked by a series of lower highs and lower lows. The price follows a bearish trend within this channel.2. Breakout: A breakout is evident as the price pierces through the descending resistance line, signaling a potential trend reversal or bullish momentum. This breakout is marked as a critical point on the chart.3. Retest: Following the breakout, the price pulls back to retest the previous resistance level, now acting as support. This is a classic confirmation that the breakout is likely genuine.4. Bullish Momentum: After the successful retest, the price shows upward momentum, targeting the 3,250 USD mark, indicating a potential bullish move.5. Target and Prediction: The chart points to a short-term target of 3,250 USD, with the current price around 3,228.19 USD, reflecting a positive sentiment (+0.77%).Visual Markings:Yellow Circles: Indicate key points of resistance and support within the channel.Blue Shaded Area: Highlights the descending channel structure.Red and Green Lines: Represent significant support and resistance levels.Arrows and Text: Illustrate critical actions like breakout, retest, and target.Conclusion:This technical setup suggests a potential bullish continuation, with the breakout and retest confirming the strength of the upward move. Traders might consider buying opportunities around the retest area, aiming for the 3,250 USD target.
Gold Spot Price Breaks Downtrend: Bullish Momentum Towards 3,250
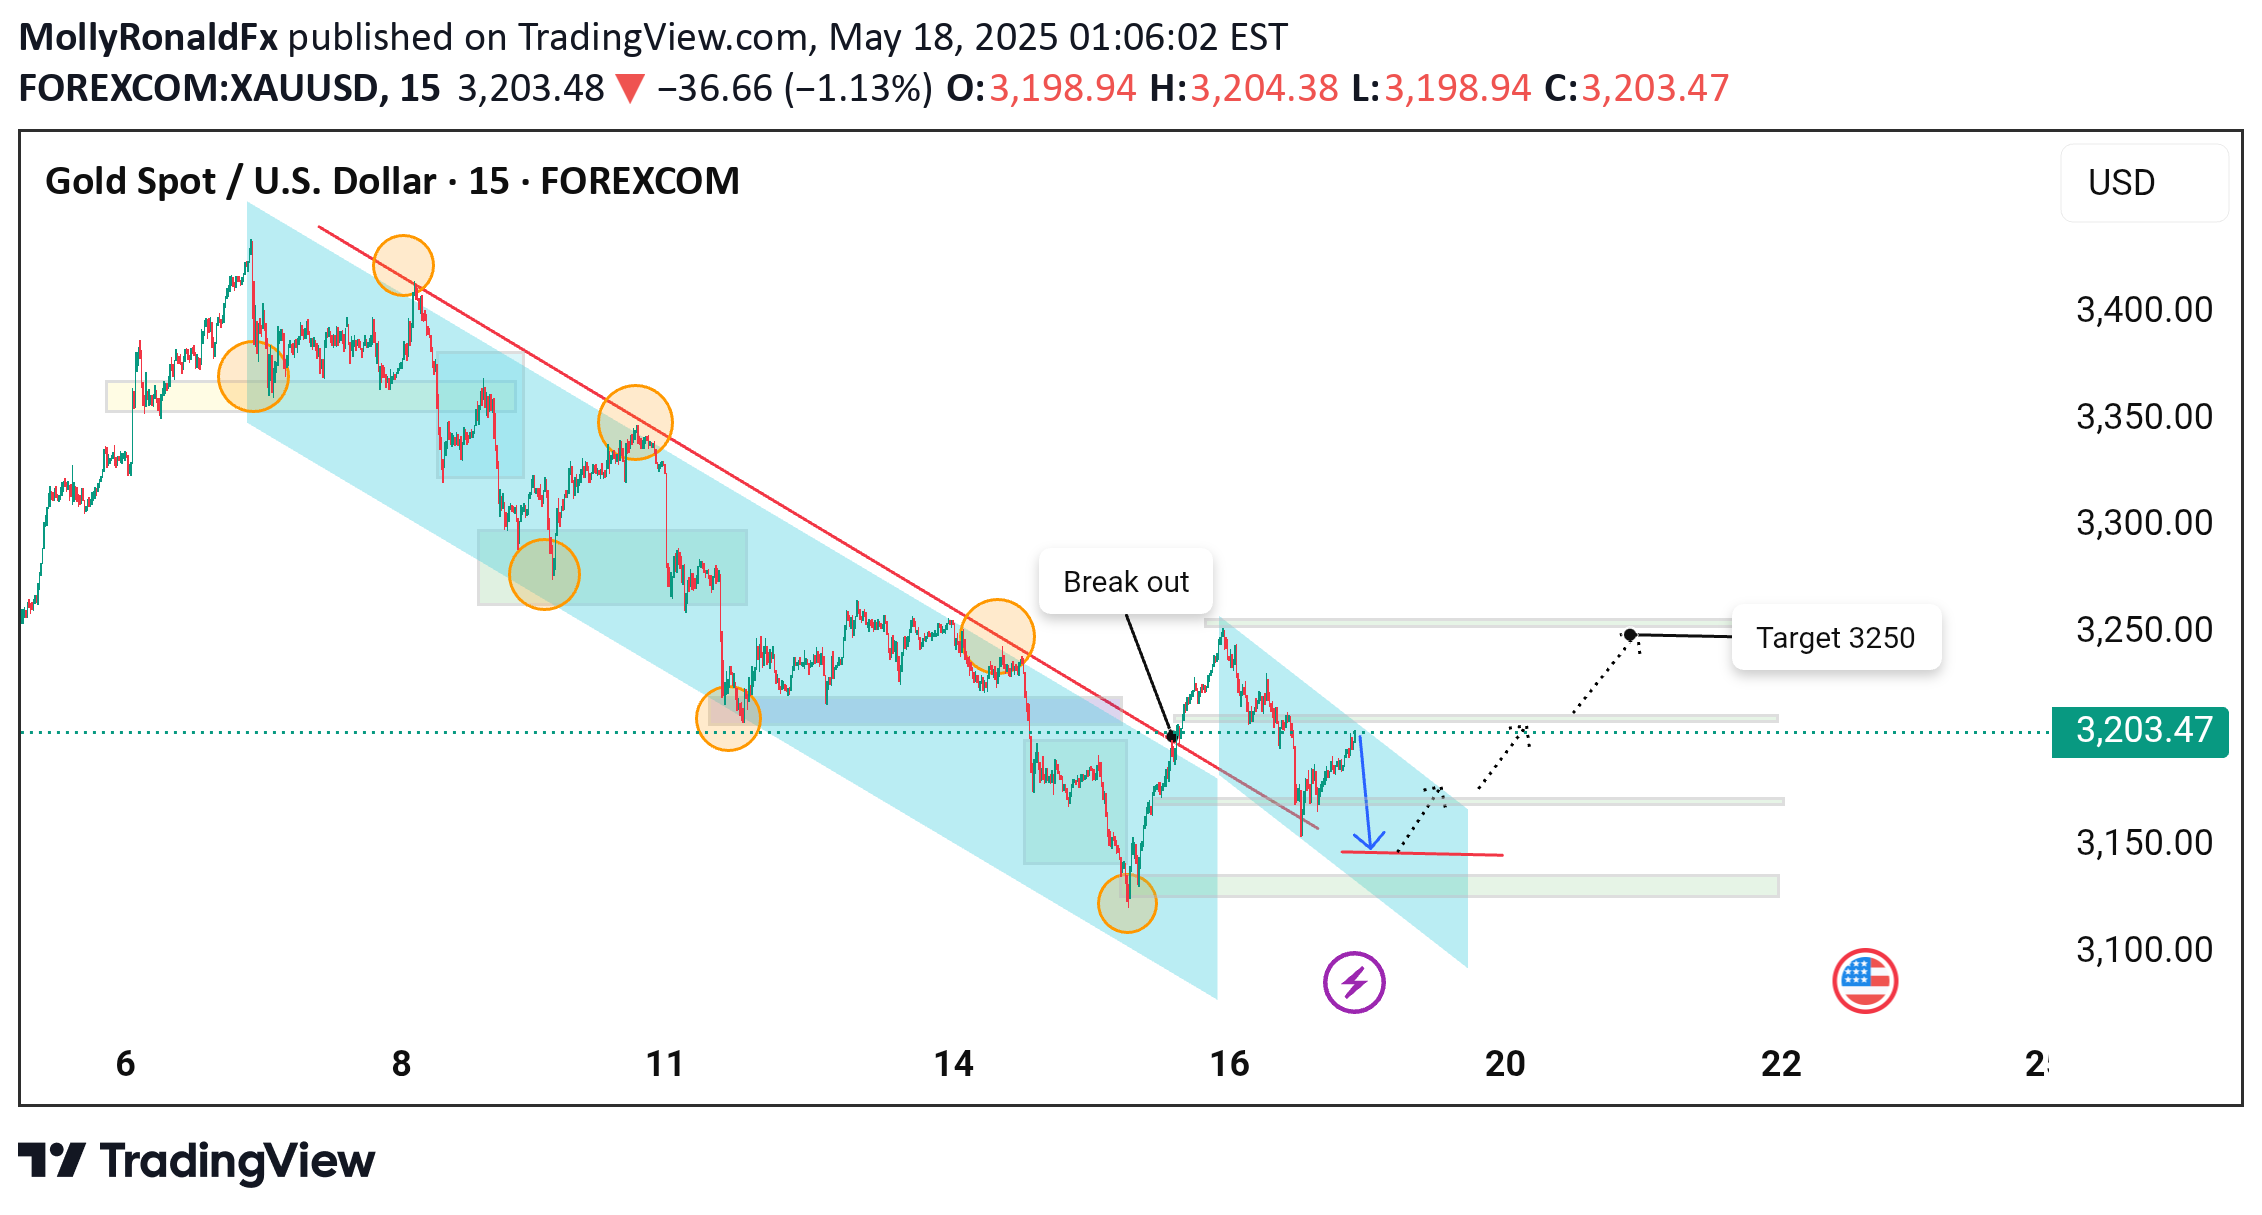
Gold Spot against the U.S. Dollar (15-minute timeframe) shows a prevailing downtrend, highlighted by a descending channel (blue) and a series of lower highs and lower lows. Yellow circles indicate key resistance points along the trendline, while the red downward arrow suggests a potential continuation of the bearish movement.However, the chart also hints at a potential rebound toward the 3,250 USD target, as indicated by the dotted path. Key support levels are marked around 3,100 USD. The analysis suggests that breaking the resistance could signal a shift in trend, while holding within the channel may indicate further declines. Traders should watch for confirmation signals before taking positions.
Gold Spot Price Analysis: Potential Reversal from Downtrend
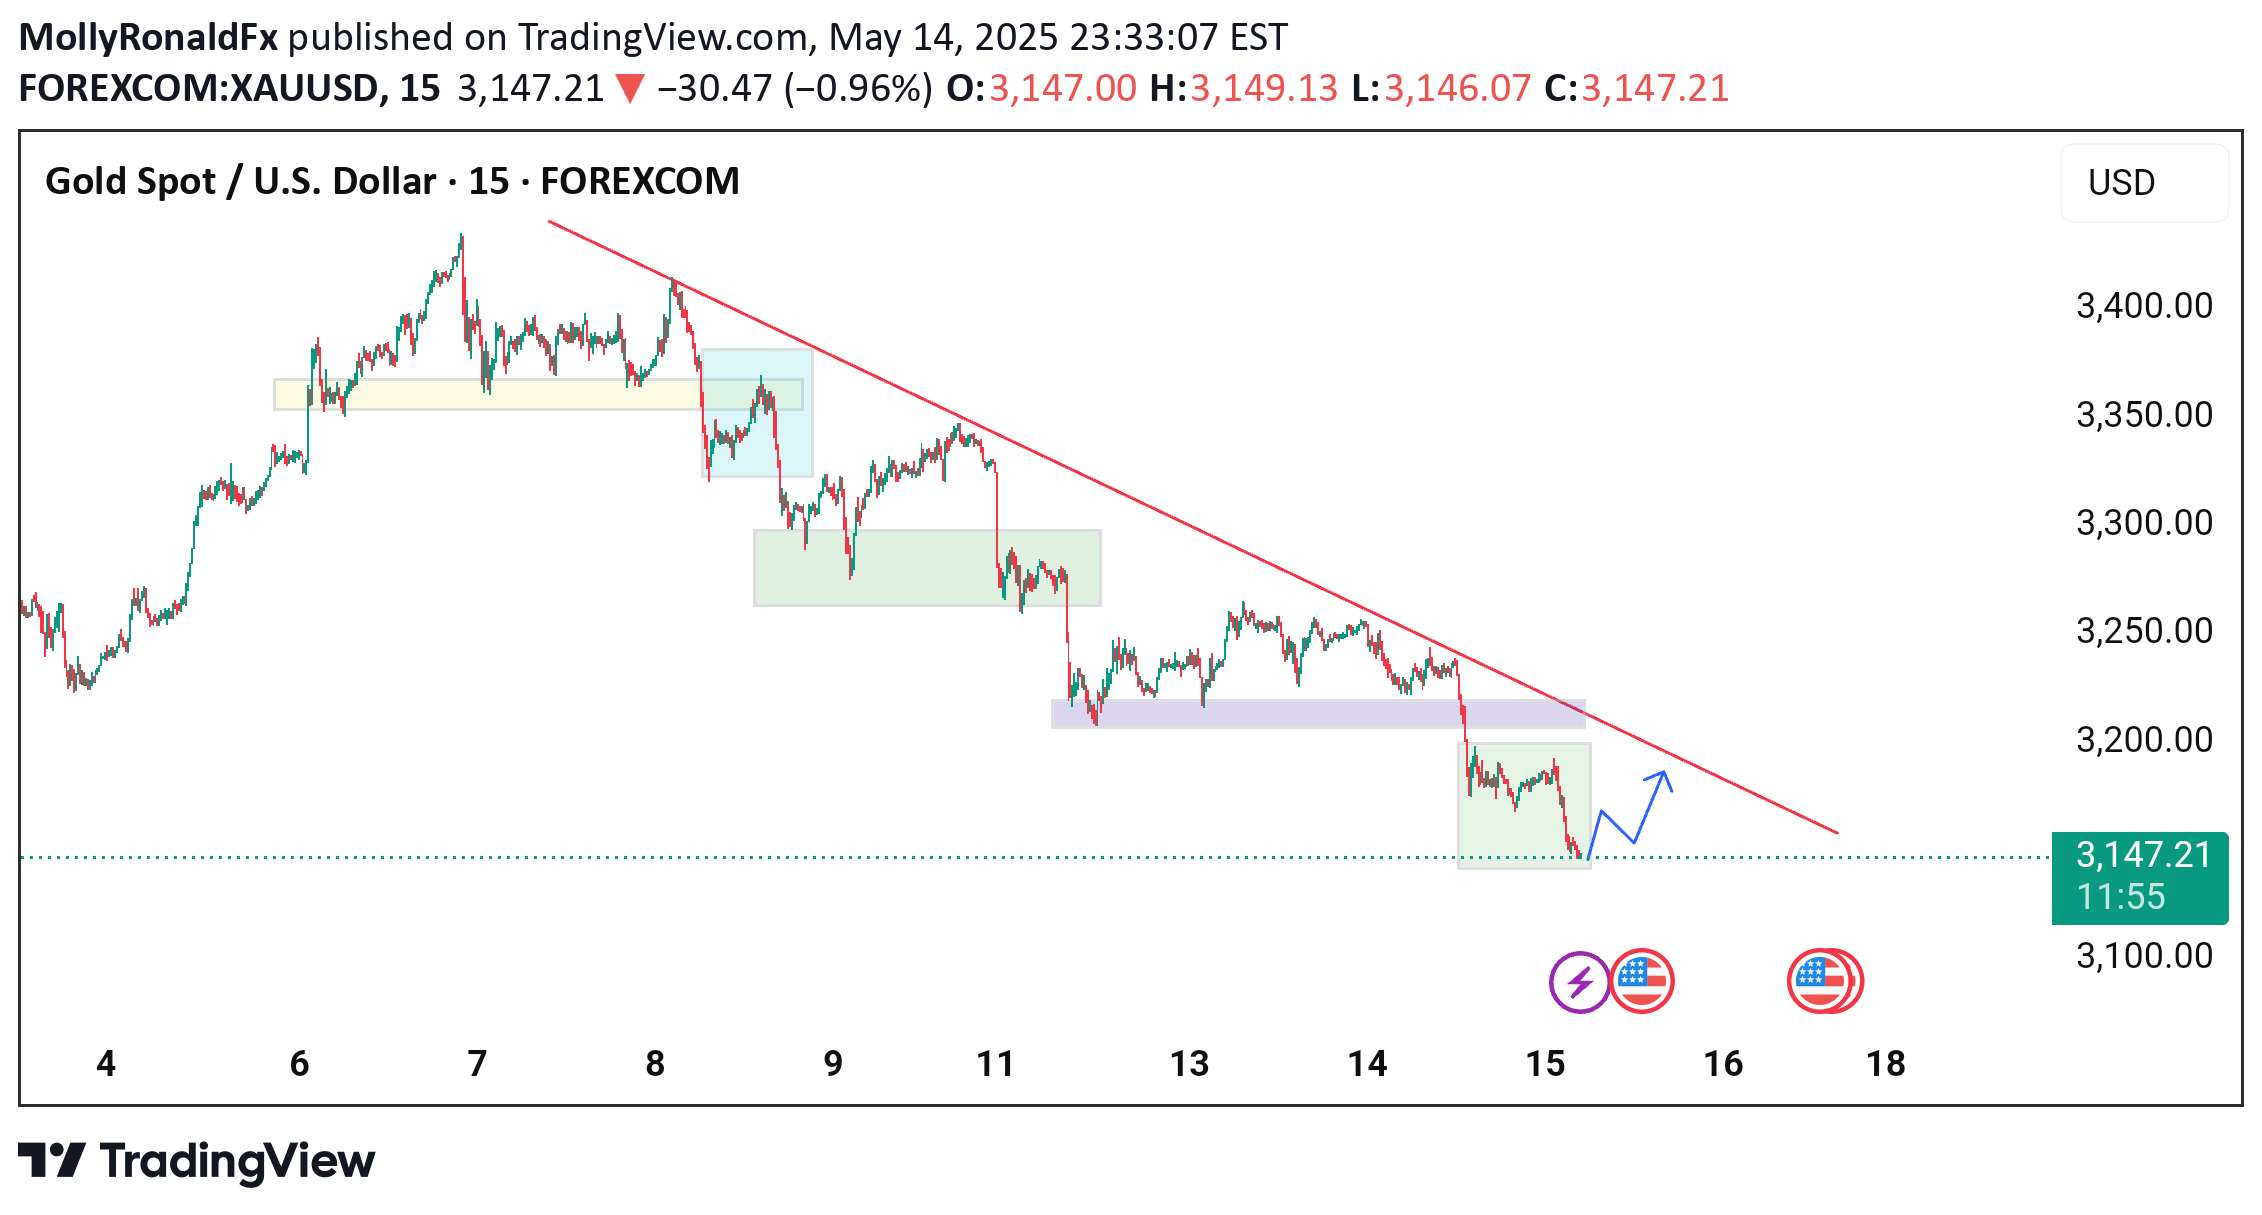
price movement of Gold Spot against the U.S. Dollar on a 15-minute timeframe, published on TradingView by MollyRonaldFx. The gold price has been trending downward, marked by a series of lower highs, forming a descending resistance line. Significant support zones are highlighted, with the price recently breaking below the latest support area. The chart indicates a possible bullish reversal, as suggested by the projected upward arrow, signaling potential buying opportunities near the 3,148.71 USD level. Key upcoming economic events could influence price movement.
Gold Price Analysis: Bullish Breakout Above Symmetrical Triangle

a bullish breakout above a symmetrical triangle pattern. The price surged past the resistance, moving within an upward channel. Key resistance levels are noted at 3,430 and 3,470, indicating potential bullish targets. The current price is 3,392.10, reflecting a -1.15% decline. Traders should watch for consolidation before the next upward move.The chart shows that gold prices recently broke out of a triangle pattern, moving upwards in a channel. The price is currently around 3,392, with possible targets at 3,430 and 3,470. This breakout suggests that gold may continue to rise after some consolidation.
BTC Breakout: Symmetrical Triangle Formation Near Key Resistance

Bitcoin highlights a symmetrical triangle pattern forming just below a descending trendline and key resistance zone around $96,000–$96,600. The price action is consolidating within narrowing support and resistance lines, suggesting a potential breakout. A bullish breakout above the red trendline and consolidation above $96,000 could lead to a strong upward move toward the resistance zone. Traders should watch for volume confirmation and breakout retest opportunities for optimal entry points.
Gold Eyes Recovery as Price Targets $3,260 Resistance

Gold is showing signs of a potential rebound on the 15-minute chart. After finding support around the $3215–$3225 zone, price action is starting to climb again. If this upward momentum continues, we could see gold make a push toward the $3260 resistance level. Keep an eye on price behavior near support—any strong bounce could be a signal for further upside.
Gold Price Analysis (XAU/USD) – Potential Bullish Breakout Setup

Gold shows a consolidation pattern forming within a symmetrical triangle. Price action is currently testing the lower support of this triangle. A potential bullish breakout is anticipated if price bounces from the minor demand zone and breaks above the triangle resistance. The upper resistance target lies near the $3320 level. Key support levels are highlighted at $3280 and $3260 Watch for confirmation signals near the breakout zone for potential long entries.Price Hits ResistancePrice Action: Gold successfully broke out of the symmetrical triangle and reached the projected resistance zone at $3,230, completing the bullish move.Market Behavior: Price is showing signs of hesitation or consolidation near this resistance, indicating a potential reaction.Next Steps:If holding longs: Consider taking partial profit or moving stop-loss to break-even to secure gains.Watch for reversal signals (e.g., bearish candlestick patterns) for a possible short-term pullback.If breakout continues: A clean break above $3,220 with volume may open up room toward $3,240–3,260 zone.Key Levels to Watch:Resistancr $3230, next possible at $3,240–3,260Support: Recent breakout level near $3,200–3,210
ICP/USDT Breakout Potential: Descending Trendline Under Pressure

This is the 4-hour chart for ICP/USDT, and it’s showing some interesting action. Over the past few months, ICP has been stuck in a downtrend with a clear descending trendline acting as resistance. However, each time it formed a falling wedge pattern, we saw a breakout to the upside, followed by short rallies.Right now, the price is hovering around $5.10 and seems to be testing that same long-term trendline again. If it breaks above this level with strong volume, it could be the start of another bullish move. Definitely a chart to keep an eye on for a potential breakout in the coming days.
Bitcoin Analysis Anticipated Bullish Rebound Toward $95,000!

This 15-minute Bitcoin (BTC/USD) recent price action around key support and resistance zones. After a sharp dip to the lower green support area (~$92,500), the price is showing signs of a bullish reversal. The forecasted trajectory (highlighted in yellow) anticipates a corrective move before resuming an upward climb toward the $95,000 resistance target. Previous consolidation phases and a breakdown from a rising wedge pattern are also noted, suggesting a technical recovery is underway. Traders are watching for confirmation of this bullish setup.
Gold Eyes $3370 After Bullish Breakout and Consolidation Pattern

This chart analysis showcases a bullish breakout in the Gold Spot vs USD (XAU/USD) on the 15-minute timeframe. After a significant downtrend, a breakout above the descending trendline occurred, signaling a potential reversal. Price is now consolidating within a rising wedge, aiming for the key resistance zone around $3,370.Explanation:Breakout Confirmation: The chart highlights a clear breakout from a descending trendline, marked by a circle. This breakout is a key signal that bearish momentum has weakened and bulls are gaining control.Bullish Structure: Post-breakout, the price has formed a bullish continuation pattern, indicated by a wedge (or triangle). This pattern often precedes upward moves.Target Zone: The marked resistance zone around $3,370 is a previous supply area. The chart suggests this is the next key level bulls might aim for.Projected Move: The blue arrow outlines a possible price path toward this target, assuming continued buying pressure.This setup provides a potential buying opportunity, but traders should watch for confirmation and manage risk with appropriate stop-loss levels below recent support zones.
Disclaimer
Any content and materials included in Sahmeto's website and official communication channels are a compilation of personal opinions and analyses and are not binding. They do not constitute any recommendation for buying, selling, entering or exiting the stock market and cryptocurrency market. Also, all news and analyses included in the website and channels are merely republished information from official and unofficial domestic and foreign sources, and it is obvious that users of the said content are responsible for following up and ensuring the authenticity and accuracy of the materials. Therefore, while disclaiming responsibility, it is declared that the responsibility for any decision-making, action, and potential profit and loss in the capital market and cryptocurrency market lies with the trader.