Technical analysis by MollyRonaldFx about Symbol PAXG: Buy recommendation (5/19/2025)

MollyRonaldFx
Gold Price Breakout: Bullish Momentum Targets 3250
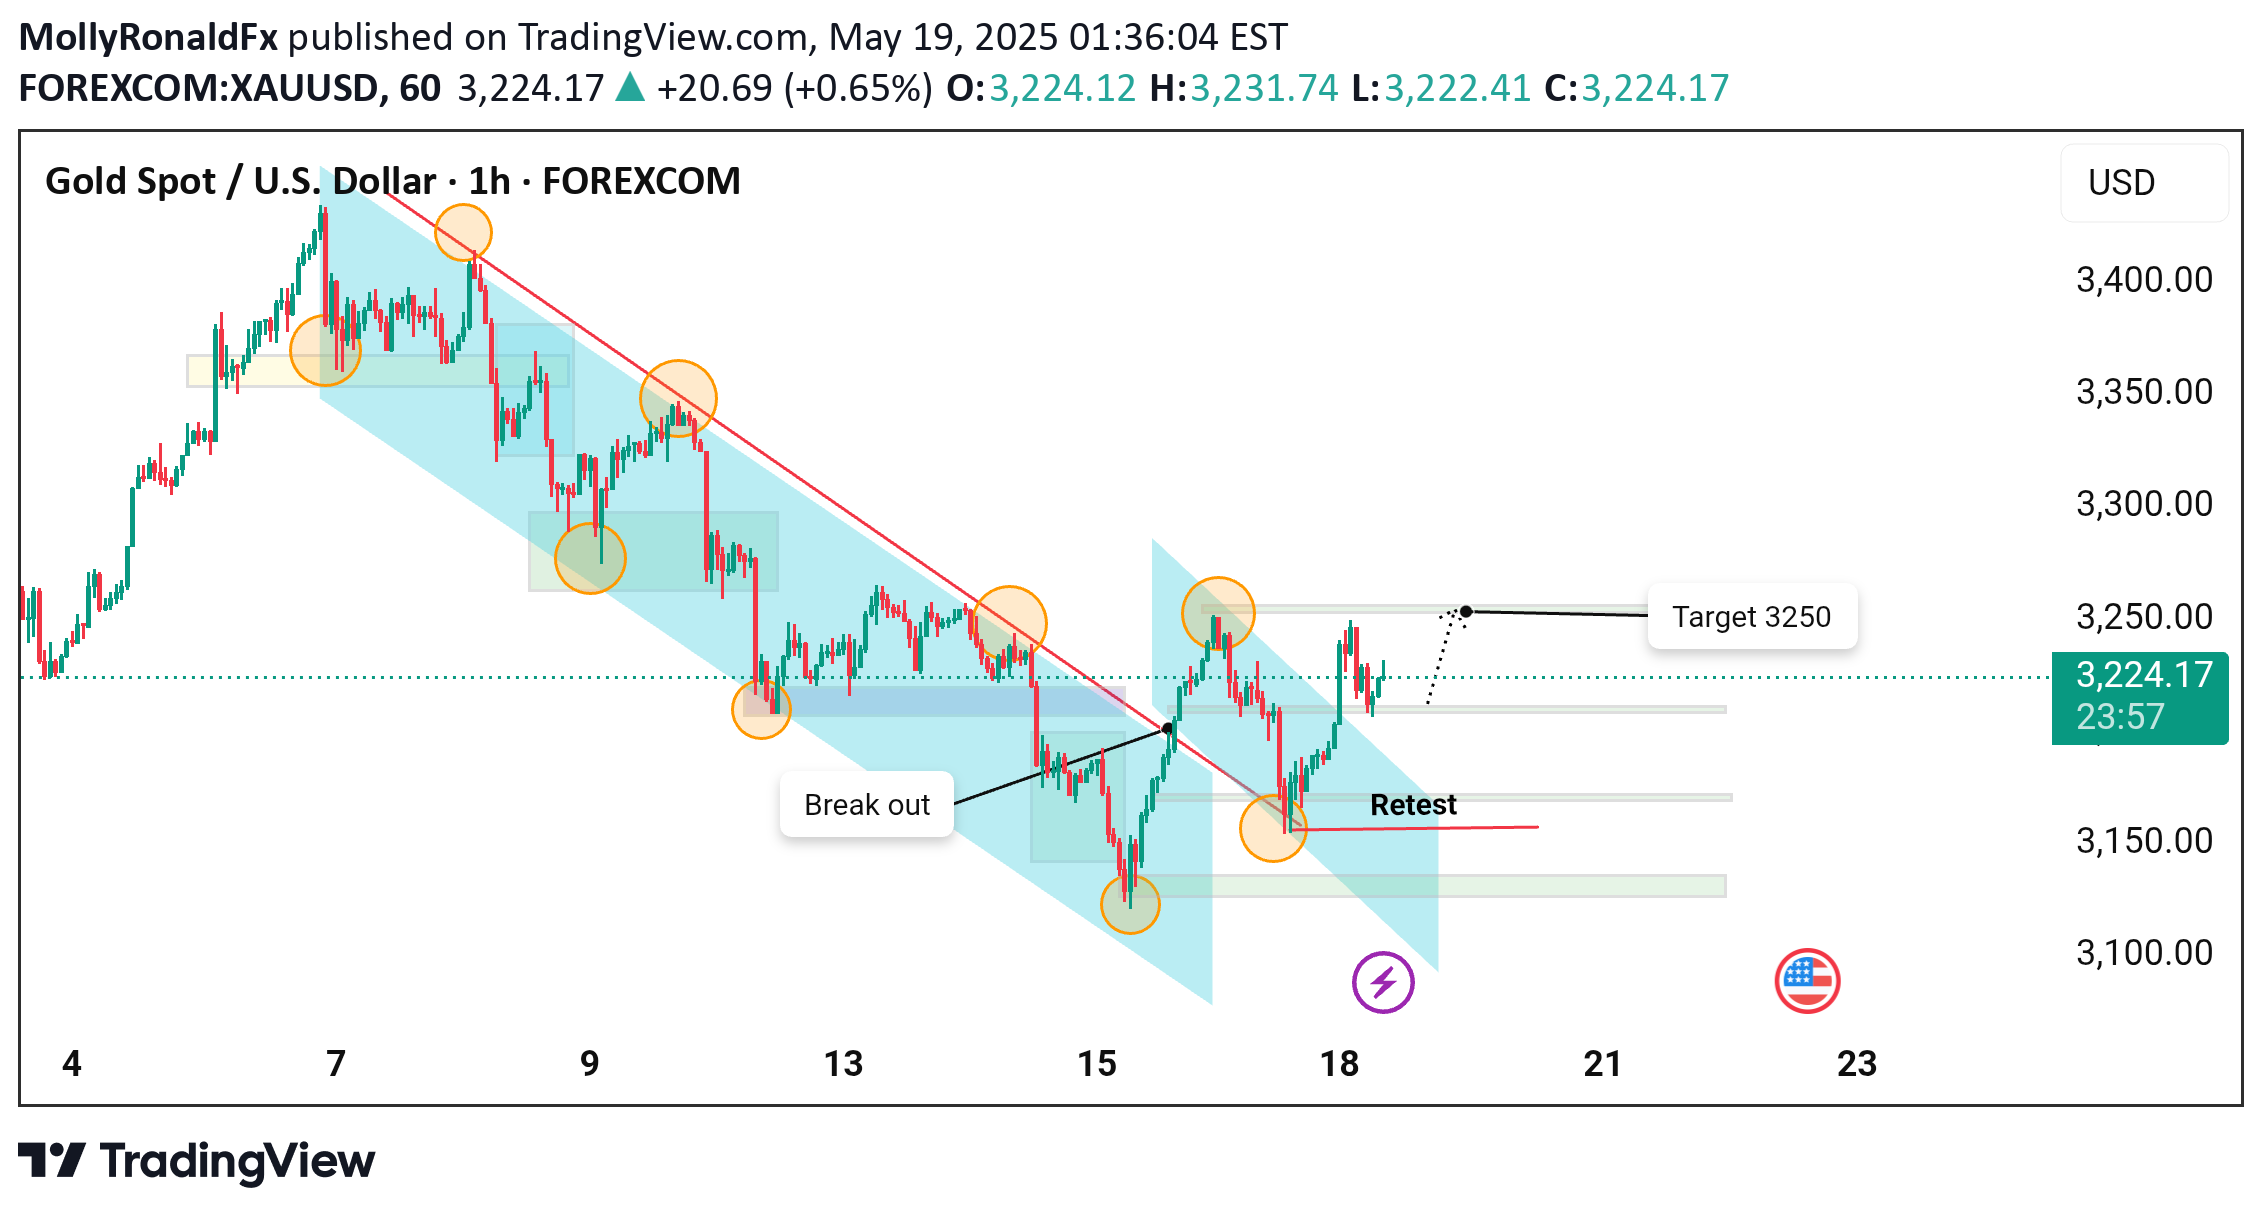
Chart Analysis:1. Downward Channel: The chart initially displays a well-defined descending channel, marked by a series of lower highs and lower lows. The price follows a bearish trend within this channel.2. Breakout: A breakout is evident as the price pierces through the descending resistance line, signaling a potential trend reversal or bullish momentum. This breakout is marked as a critical point on the chart.3. Retest: Following the breakout, the price pulls back to retest the previous resistance level, now acting as support. This is a classic confirmation that the breakout is likely genuine.4. Bullish Momentum: After the successful retest, the price shows upward momentum, targeting the 3,250 USD mark, indicating a potential bullish move.5. Target and Prediction: The chart points to a short-term target of 3,250 USD, with the current price around 3,228.19 USD, reflecting a positive sentiment (+0.77%).Visual Markings:Yellow Circles: Indicate key points of resistance and support within the channel.Blue Shaded Area: Highlights the descending channel structure.Red and Green Lines: Represent significant support and resistance levels.Arrows and Text: Illustrate critical actions like breakout, retest, and target.Conclusion:This technical setup suggests a potential bullish continuation, with the breakout and retest confirming the strength of the upward move. Traders might consider buying opportunities around the retest area, aiming for the 3,250 USD target.