
MohsenCapital
@t_MohsenCapital

What symbols does the trader recommend buying?
Purchase History
پیام های تریدر
Filter
MohsenCapital
پیشبینی شگفتانگیز TAO: آیا رسیدن به قله 1000 دلاری تنها یک قدم فاصله دارد؟
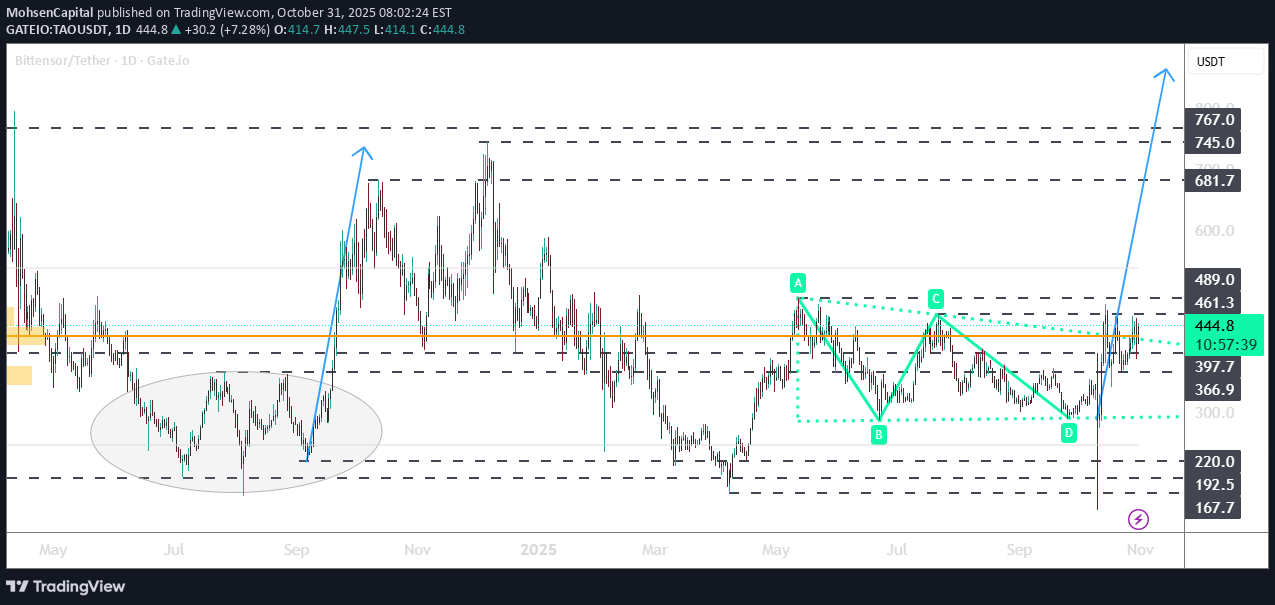
Traders, We’re looking at TAO/USDT on the daily timeframe. Previously (July–September), the price formed a rectangle consolidation zone, followed by an iconic rally to new highs. Now, we’re witnessing a similar setup — this time within a triangle pattern. Let’s break down the key confirmations: Triangle breakout: The price is currently breaking out around $445. POC breakout: A crucial level at $461 — we need a weekly close above it to confirm strength. New consolidation: Expect a potential sideways move before testing the ATH. ATH breakout: Once momentum builds, a strong impulsive candle could send TAO into uncharted territory between $800–$1000. Note: The previous liquidation wick was clearly a manipulation event — price has since recovered as if it never happened. Stay tuned — this idea will be updated as the structure unfolds. Regards,
MohsenCapital
BTC’s Final Push to ATH Before the Bear Roars?

Traders, Here’s a look at BTCUSD on the daily chart, stripped down to just the price action—no noise, no distractions. 🔍 Current Structure: We’re sitting in a clear consolidation zone, formed after the last rally. Despite recent geopolitical headlines shaking sentiment, the chart itself doesn’t confirm a breakdown just yet. 📌 Key Confirmations: ✅ 96K is the invalidation zone — no breakdown below, no bear confirmation. 📈 Potential final leg up could emerge after breaking the current channel resistance. 📆 Seasonality: Summer often brings corrections, but we haven’t seen a full reversal—just hesitation. 🔢 Fib Extension Resistance: Price is tapping the 0.618 extension level—reacting with precision. 🧠 DOM (Depth of Market): Historically flips at ~70%. We’re now at 66%, hinting at a final spike before altseason kicks in—then possibly the broader bear cycle into 2026. ❓Is this guaranteed? Absolutely not. This is all about probabilities—not certainty. 📅 Stay tuned: I’ll update this chart weekly to track how this unfolds. Follow to stay ahead of the trend.
MohsenCapital
Eigen 100% Opportunity!

Hey Traders, Taking a closer look at the EIGENUSD daily chart, we’re seeing some interesting developments worth noting: 🔹 Chart Patterns: Price has been consolidating between Feb 25 and May 25, forming a solid base. A pennant pattern has also emerged – often a sign of a potential continuation move. 📈 Price Action & Key Levels: We’re currently trading at the Point of Control (POC) zone — a key area of volume and decision. A confirmed breakout above this POC zone could trigger a move toward the next resistance at $2.676. Beyond that, the Fib 0.618 level at $3.78 stands as the next significant target. ⏳ Timing: In my opinion, if we break through the POC with strong volume and momentum, this move could play out in the coming few weeks. Let me know what you think — are you watching this breakout too? 🔍
MohsenCapital
BTC – Golden Cross Signal Could Unleash the Next Rally!

Dear Traders, On the BTC/USD daily chart, we’ve observed a significant technical development: a Golden Cross formation. This occurred on October 24, when the 50-day moving average crossed above the 200-day moving average—often interpreted in the crypto market as a bullish momentum signal. Historically, the last time this pattern emerged, it marked the beginning of a strong upward movement in Bitcoin's price. If we apply the same fractal pattern from that period and overlay it on the current structure, the projection suggests a potential target of $150,000 for BTC, with a speculative timeline pointing toward July 25. Additionally, Volume Profile (VP) analysis during the fractal period identifies the $105,000 level as a key area of interest. Previously acting as resistance, this level is likely to flip into strong support as Bitcoin gains momentum. Further technical confirmation is found through Fibonacci extension levels: 200% extension aligns with a target around $122,000. A more extended bullish move could push BTC as high as $155,000. While it's crucial to wait for additional confirmations and market validation, the presence of this Golden Cross and repeating price structure offers a compelling setup worth monitoring closely. Stay sharp and manage your risk accordingly. Regards,
MohsenCapital
OP 100% : 140% Opportunity

Overview: This report provides an analysis of the OPUSDT 1D chart, highlighting key technical patterns, resistance levels, and probable price movements based on historical price action and technical indicators. Key Observations Consolidation Zone: The price is currently trading within a consolidation range of approximately 100%, bounded by $1.00 to $1.90. This range represents significant price accumulation, often preceding a breakout. Fractal Analysis: A fractal pattern similar to the previous year’s price action is observed. This fractal aligns with a target at the 0.618 Fibonacci retracement level, suggesting a potential upward move. Volume Profile (VP) Levels: Volume Point of Control (POC), indicating the price level with the highest traded volume, is located at the critical level of $1.20. This level serves as a key support within the current consolidation zone. Probable Scenario Breakout Potential: A breakout above the upper boundary of the consolidation zone at $1.95 is crucial. Clearing this level will likely confirm the fractal pattern derived from historical price action. Target Levels Post-Breakout: The fractal projection indicates potential targets in the range of $3.30 to $4.00, contingent on sustained momentum. Confirmation of the fractal can occur either precisely along the expected timeline or in its early stages, as depicted on the chart. Pivotal Level: The pivotal event remains the breakout of the $1.95 consolidation boundary, which will set the stage for upward movement. Conclusion: The current consolidation zone represents a critical zone for OPUSDT. A breakout above $1.95 would confirm bullish fractal projections, with potential targets at $3.30–$4.00. Traders are advised to monitor the $1.95 level closely, as it marks the threshold for a significant price move. Best Regards, MO
MohsenCapital
Technical Analysis of XRP: Key Patterns for $1 !

We will analyze the XRP 1D chart and explore several important technical patterns that could provide insights into future price movements. Currently, the chart reveals several notable formations that traders should be aware of: 1. Triangle Formation: The chart shows XRP making its third attempt to break out of a triangle pattern. This pattern indicates consolidation, with price narrowing as it approaches a key breakout point. The third attempt often signals increased momentum, suggesting that a breakout may be imminent. 2. Head & Shoulders (H&S): The Head and Shoulders pattern aligns with the breakout level of the triangle pattern. This confluence of two significant patterns strengthens the likelihood of a breakout, potentially leading to a strong price movement in either direction. Resistance Levels and Targets Once XRP breaks out of the triangle, two major resistance levels need to be considered: - Initial Resistance: $0.60 - $0.65 This range marks the Point of Control (POC), a critical level where volume has been concentrated. For a bullish scenario to unfold, XRP must break above this range, which would indicate the initiation of upward price action. Major Resistance "Targets": $1.00 - $1.15 The next significant resistance zone is between $1.00 and $1.15. This level represents a psychological barrier, reinforced by heavy trading volume in the past weeks. Best,
MohsenCapital
ARB for a big move !

Traders, Here we have ARBUSDT 1D chart. - Chart Patterns: 1- C&H chart pattern with a TP zone between $1.4 : $1.6 - Important levels: 1- Levels of 1.19:1.25 breaking out these levels gonna make ARB explode in the next few weeks 2- POC level at the same level of consolidation area the ARB can't break through over a year. - Targets: $1.5 $1.65 - Holding Positions TPs: $2.48 $2.9 Regards,
MohsenCapital
WRX 200% Probability

Traders, Here we have WRXUSDT 1D chart. Triangle formed with Three counted angles on the daily chart with target Approx. 200% Confirmations: - Holding the current support level - Breaking the 1.750 - Ma Lines squeezy with rising 200 day ma line Trade Plane : - Entering in positions after breaking out the triangle and make an extra positions if the price made a decent Re-Test Regards, Mohsen
Disclaimer
Any content and materials included in Sahmeto's website and official communication channels are a compilation of personal opinions and analyses and are not binding. They do not constitute any recommendation for buying, selling, entering or exiting the stock market and cryptocurrency market. Also, all news and analyses included in the website and channels are merely republished information from official and unofficial domestic and foreign sources, and it is obvious that users of the said content are responsible for following up and ensuring the authenticity and accuracy of the materials. Therefore, while disclaiming responsibility, it is declared that the responsibility for any decision-making, action, and potential profit and loss in the capital market and cryptocurrency market lies with the trader.