
Michael-trades-
@t_Michael-trades-

What symbols does the trader recommend buying?
Purchase History
پیام های تریدر
Filter
hart Overview (XAUUSD - 30 min timeframe)
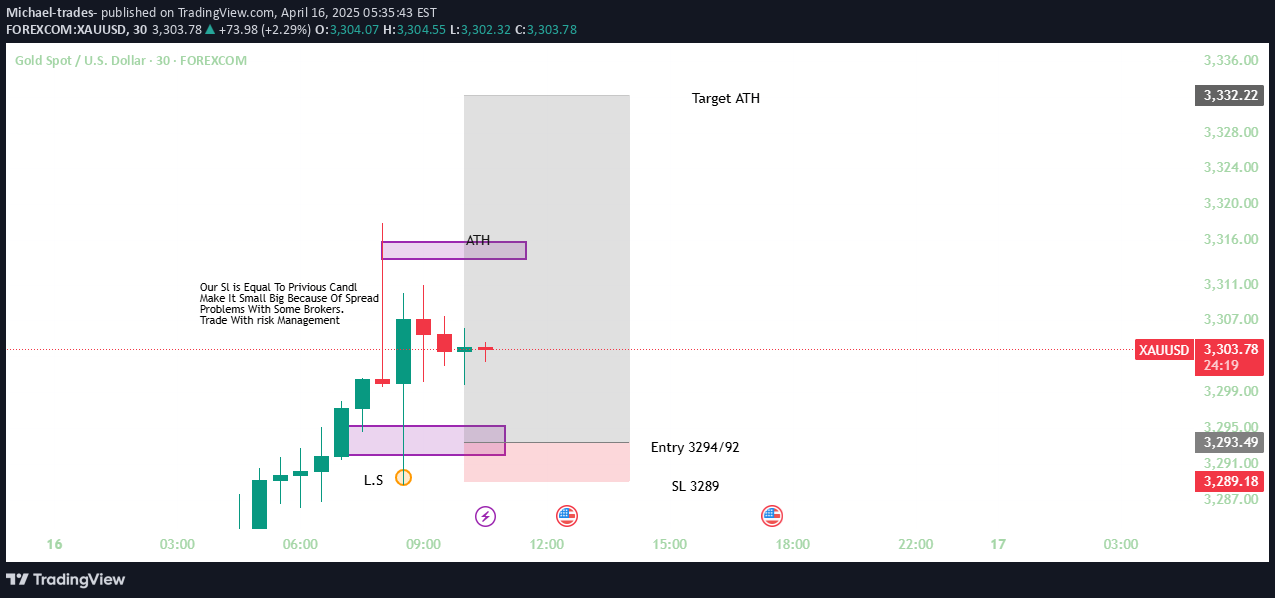
📊 **Trade Setup Description – XAU/USD (Gold)**This is a **bullish breakout setup** on the 30-minute chart of XAU/USD, aiming to capitalize on momentum continuation toward the **All-Time High (ATH)**.---### 🔍 **Setup Details**:- **Trade Direction**: Long (Buy)- **Entry Zone**: 3292–3294 Price broke above a key level (marked support zone), offering a potential entry as it retests.- **Stop Loss (SL)**: 3289 SL is set just below the previous candle low to reduce exposure and protect against invalidation.- **Take Profit (TP)**: 3332.22 (Targeting ATH) Based on previous resistance at the ATH level.---### 💡 **Key Concepts Noted on the Chart**:- **Left Shoulder (L.S)** indicates part of an inverse head and shoulders formation—a bullish reversal pattern.- **ATH Zone** is highlighted as both a target and potential resistance.- **Risk Management Note**: Traders are reminded to adjust SL for broker spreads and to always manage risk properly.---### 📈 **Trade Objective**:To catch a continuation of bullish momentum as gold retests the breakout zone with a tight SL and a high reward-to-risk ratio aiming for the ATH."Chart Status" is a summary term that encapsulates the overall technical condition and readiness of the trade setup. In the context of your XAU/USD chart, it refers to several key aspects:---### 1. **Technical Pattern Overview**- **Bullish Formation:** The chart shows a bullish pattern that includes elements resembling an inverse head & shoulders structure. This suggests a potential reversal from prior trends and supports the long trade idea.---### 2. **Entry Zone**- **Precise Levels:** The suggested entry lies within the 3292–3294 range, where price behavior supports a break above critical resistance. This zone is defined based on previous candle action and overall momentum.---### 3. **Risk Management Zones**- **Stop Loss:** Set at 3289, the stop loss is placed just beneath a key previous candle, marking a safety limit. This boundary is essential to limit potential losses if the price action unexpectedly reverses. - **Risk-to-Reward:** With the target at the ATH (~3332.22), the setup presents a strong reward-to-risk ratio. The defined boundaries help in calculating and managing this risk effectively.---### 4. **Profit Target / Exit Strategy**- **Take Profit Level:** The ATH at approximately 3332.22 acts as the primary target level. This is the zone where price might face resistance, making it an appropriate exit point to secure profits.---### 5. **Overall Market Sentiment**- **Confirmed Bullish Momentum:** The chart status, integrating all these elements, signals strong bullish momentum. The clear entry, stop, and target levels provide a systematic approach to trading, while the technical patterns underpin the bullish bias.
BTCUSD Potential Short Setup – April 16, 2025

**BTCUSD Trade Setup Description (1H Chart – April 16, 2025)**- **Current Market Condition**: Bitcoin (BTCUSD) is trading around **$83,552**, showing signs of rejection from a key **resistance zone** labeled "R.S" on the chart.- **Resistance Zone (R.S)**: The highlighted purple box at the top represents a **resistance area**, where price has previously reversed. This zone has been tested multiple times, and the recent rejection suggests seller dominance.- **Support Zone**: The lower purple box marks a **support level** around **$79,237**, where price previously found strong buying interest.- **Trade Idea**: This chart presents a **short (sell)** setup: - **Entry**: Around current price ($83,552) - **Stop Loss**: Above resistance, near **$85,084** - **Target**: Near the support zone at **$79,237**- **Risk Management**: A clear stop loss and take profit are set, with the trade encouraging the use of **risk management** principles. The risk-to-reward ratio appears to be favorable, roughly **1:2** or better.**Trade Status Update – BTCUSD (1H Chart)** As of the latest candle:- **Current Price**: ~$83,552 - **Entry**: Trade appears to be active (around this level). - **Direction**: **Short position** - **Price Action**: - Price has broken below the recent consolidation range. - Currently hovering just under the resistance zone (R.S), confirming bearish rejection. - Momentum suggests further downside potential toward the **support zone (~$79,237)**.### **Status Summary**:- ✅ **Trade triggered**- 🟡 **Trade in progress**- ⏳ **Not yet reached target or stop**- 📉 **Bearish structure is intact**- ⚠️ **Watch for any reversal candles or high-volume wicks near 83K**
BTCUSD Resistance Flip – Short from 84,630 to Target 76,100

🟩 **Chart Summary: BTC/USD – 30-Minute Timeframe**This is a **short trade setup** on Bitcoin (BTC/USD), based on clear **price action and supply/resistance rejection**.---### 🟪 **Key Zones Identified:**- **Support Zone (Bottom Purple Box):** - Marked by multiple previous touches and rejections. - Price has reacted to this area several times (highlighted with orange circles), confirming its significance.- **Resistance Zone (Upper Purple Box):** - Strong resistance formed from earlier highs. - Price rejected multiple times in this region before failing to break higher—indicating seller strength.---### 📉 **Trade Setup Details:**- **Entry:** 84,630 (within the resistance zone).- **Stop Loss (SL):** 85,900 (above resistance—logical SL to avoid false breakouts).- **Target:** 76,100 (aligned with previous support and price reaction zone).- **Risk-Reward Ratio:** High (approx. 1:5 or more depending on precise levels).---### 🔁 **Price Structure Analysis:**- **L.S (Last Swing):** Indicates the last confirmed support level before the upward push.- **Price Action:** Strong bullish move into resistance, followed by consolidation and repeated failures to break higher.- **Break of Structure (BOS):** Not marked but implied—price failed to make a new high and formed a lower high, signaling potential reversal.---### 🎯 **Bias: Bearish**The trade is based on:- Rejection from a strong resistance zone.- Lack of bullish momentum to break above.- High potential for price to revisit the lower support zone.🔄 **Trade Status: BTCUSD Short Setup**As per the chart:- **Current Price:** $84,498 - **Entry:** $84,630 - **Status:** ✅ **Trade is active and slightly in profit** (~132 pips in the green).---### 🔍 **What’s Happening Now:**- Price is hovering just below the **entry level**.- It’s **consolidating near resistance**, showing **weak bullish momentum**—which is a good sign for shorts.- The **stop loss at 85,900** hasn’t been threatened yet.- Target remains firm at **76,100**, still in play.---### 🔔 **What to Watch For:**- If price **rejects again** from the resistance zone, it could accelerate downward.- A **clean break below 84,000** would confirm momentum in your favor.- A spike toward 85,900 would invalidate the setup—so watch for volume and reaction near the SL zone.
Shows a structured trading plan with key technical elements

1. **Support Zone** (around 3190–3120): - This area held price up earlier and led to a strong bullish move. - It is marked at the bottom of the chart.2. **BOS (Break of Structure)**: - A structure break occurred here, indicating a shift in market momentum. This area is now acting as a resistance zone.3. **R.S (Resistance/Supply Zone)**: - Marked at the top around 3244–3255. - Price is expected to reverse from this level.---### 📉 Trade Setup (Short Position):- **Entry:** Between 3244–3247 (within the resistance/supply zone).- **Stop Loss (SL):** 3255 (just above the resistance zone).- **Target:** 3124 (around previous support level).---### 🔍 Other Notations:- **L.S:** Possibly a liquidity sweep or last support before the bullish move.- Candlesticks show a strong bullish trend leading into the resistance zone.- There's a shaded gray box illustrating the risk/reward of the short trade.---### 🎯 Trade Logic:The idea is that price has hit a resistance zone (where sellers might step in) after a strong bullish move. The trader anticipates a reversal and aims to short from the resistance zone down to the previous support level.Based on the current chart status of XAUUSD (Gold) on the 3H timeframe, here’s a quick summary of what’s happening right now:📊 Chart Status OverviewCurrent Price: 3,237.930Trade Bias: Bearish (Short Setup)Price Position:Currently just below the resistance/supply zone (R.S) marked between 3244–3255.Not yet triggered the short entry (or just hovering near it depending on your entry rules).🔍 Zones and Key LevelsLabelLevel (Approx)StatusResistance (R.S)3244–3255Price is nearing/at resistanceEntry Zone3244–3247Close to being triggeredStop Loss (SL)3255Remains intactTarget3124Far below – not reached yet📈 Price ActionMomentum has been strongly bullish into resistance, suggesting this could be an area of potential reversal.If price rejects this supply zone, the short setup remains valid.If price breaks and closes above 3255, the trade is invalidated.✅ What to Watch For:Rejection Candles (e.g. bearish engulfing, pin bars) in the R.S zone.Volume Drop or Spike – might confirm exhaustion or a breakout.Break below minor supports after entry to confirm downward move
Bitcoin (BTC/USD) trading setup on a 3-hour timeframe

📊 **Chart Overview:**- **Asset:** Bitcoin (BTC) / U.S. Dollar (USD)- **Exchange:** BITSTAMP- **Timeframe:** 3-Hour (3h)- **Date Published:** April 12, 2025---### 🧠 **Technical Pattern Identified:**The chart showcases a **Head and Shoulders** pattern, typically a bearish reversal signal.#### 🟠 Pattern Components:- **Left Shoulder (L.S):** Marked with a yellow circle, located around April 7.- **Head:** The lowest dip, around April 9.- **Right Shoulder (R.S):** Forming near April 12, aligning with the resistance level.- **Neckline (Support):** Highlighted by a horizontal purple support line around the 78,000 level, tested multiple times.---### 🟪 **Key Levels:**- **Resistance Level:** Around the 85,000–85,900 zone, shaded in purple. Price has tested this zone and faced rejection.- **Support Zone:** Highlighted twice—first below the left shoulder and again below the head—around the 76,000–78,000 range.---### 📉 **Trade Setup (Short Position):**- **Entry:** 84,630- **Stop Loss (SL):** 85,900 (placed slightly above resistance zone)- **Target:** 76,100 (near the neckline support)This setup assumes the price will drop after forming the right shoulder, completing the H&S pattern.---### 🔁 **Risk/Reward Insight:**- **Short Entry** is initiated just below the resistance zone.- **Stop Loss** is tight, above the potential breakout level.- **Target** offers significant downside potential, aiming for a major support level.- **Risk-to-Reward Ratio** appears favorable (roughly 1:5 or better).---### 🟢 **Other Observations:**- Candlestick behavior suggests strong selling pressure near resistance.- The support zone has held multiple times, reinforcing its significance.- The chart uses clean labeling and highlights to make pattern recognition clear.📌 **Current Chart Status (as of April 12, 2025):**Based on the 3-hour BTC/USD chart you provided:---### 🟠 **Pattern Development:**- The **Head and Shoulders pattern** is nearly complete.- **Price is currently at $84,592**, just below the **resistance zone** (~$85,000–$85,900).- This suggests the **Right Shoulder (R.S)** is likely forming or already formed.---### 🧭 **Trade Entry:**- **Short position** has been triggered at **Entry: $84,630**.- Price is slightly below the entry now → **$84,592**, indicating the trade is in **minor profit**.---### 🛑 **Stop Loss:**- Set at **$85,900** — price hasn’t reached this level yet.- As long as BTC stays below the resistance zone, the **bearish setup remains valid**.---### 🎯 **Target:**- **Target: $76,100**- Still a significant distance away, indicating a good **risk-to-reward** if the bearish move plays out.---### ⚠️ **Risk Factors to Monitor:**- A break above $85,900 (Stop Loss zone) would **invalidate the setup**.- If BTC consolidates at resistance without breaking down soon, the pattern might **fail** or **retest** higher levels.---### ✅ **Conclusion:**- **Status:** Trade is active and slightly in profit.- **Bias:** Bearish (while below resistance)- **Action:** Monitor closely for rejection confirmation at resistance or any sign of reversal.
XAU/USD (Gold vs US Dollar) on the 15-minute timeframe

📊 **XAU/USD (Gold vs US Dollar) 15-Minute Chart Analysis – April 10, 2025**This chart illustrates potential price action scenarios for **XAU/USD** with a focus on key support and resistance zones:#### 🔷 **Key Levels Highlighted:**- **Resistance Area (R. Area):** Located between approximately **$3,130 – $3,140**, this zone represents strong selling pressure where previous upward momentum stalled. - **Intermediate Support Zone (L:S):** Around **$3,088**, this level acted as a short-term bounce point and may serve as a decision zone for bulls or bears.- **Major Support Zone:** Around **$3,060**, marked as a significant demand area where buyers have previously stepped in.#### 🔁 **Price Scenarios Outlined:**1. **Bullish Continuation:** Price breaks above the resistance area and continues moving higher, indicating strong bullish momentum.2. **Rejection & Pullback:** Price may retest the resistance and get rejected, falling back toward the intermediate or major support levels before making its next move.3. **Range-Bound Movement:** Price could fluctuate within the defined support and resistance levels, forming a consolidation pattern before a breakout.#### 📍 **Current Price:** - Trading at **$3,118.90**, just below the resistance zone.📌 **Current Chart Status – XAU/USD (15-Minute Chart)**As of the current candle:- **Price:** **$3,118.90**- **Trend:** Short-term **bullish recovery** from a recent pullback.- **Location:** Price is **approaching the Resistance Area** (around $3,130 – $3,140) after bouncing from the minor support zone near $3,088.---### ✅ **Key Observations:**- **Momentum:** Bullish candles are forming as price pushes back toward resistance, suggesting buying interest in the short term.- **Risk Area:** The **R. Area** (Resistance) is a potential turning point. If price fails to break and close above it, a **rejection and pullback** scenario becomes more likely.- **Watch for Confirmation:** A breakout above $3,140 with strong volume would confirm the **bullish continuation** scenario. A rejection here could send price back to test **$3,088** or even the **$3,060** support zone.---### 🔍 **Conclusion:**The chart is in a **critical testing phase**. Bulls are trying to push through resistance, but confirmation is needed. Until then, the market remains in a **neutral-to-bullish stance**, with potential for either a breakout or a pullback.
Gold (XAUUSD) 30-Min Chart – Bearish Setup Overview

🟡 **Asset**: Gold (XAUUSD) **Timeframe**: 30-Minute Chart **Published**: April 15, 2025 --- 📉 **Setup Type**: Bearish Reversal – Head and Shoulders PatternThis chart illustrates a classic **Head and Shoulders** pattern, suggesting a potential reversal from bullish to bearish momentum.---### 🔍 **Key Zones & Labels**:- **BOS (Break of Structure)**: Confirms initial bullish strength, but the structure break hints at a possible trend shift.- **L.S (Left Shoulder)**: Marks the first peak before the head formation.- **R.S (Right Shoulder)**: Indicates a lower high, a potential sell zone.- **Support Zone**: Clearly defined area around 3188, acting as the potential **target** for the short setup.---📌 **Trade Plan**:- **Entry Limit**: 3235–3237 (within the right shoulder resistance zone)- **Stop Loss (SL)**: 3240 (just above the resistance zone to protect against a false breakout)- **Target**: 3188 (aligned with previous structure support)---### ⚖️ **Risk-Reward Outlook**:This setup offers a favorable **risk-to-reward ratio**, aiming for a move from the entry zone to the support area, assuming resistance holds.
Gold Spot / U.S. Dollar

**🔹 Chart Instrument:** Gold Spot / U.S. Dollar (XAUUSD) **🔹 Timeframe:** 30-minute chart **🔹 Published Date:** April 10, 2025 **🔹 Current Price:** ~3123.92 ---### 📉 Trade Setup (Short Position)- **Entry Zone:** 3129–3131 This is the suggested area to enter a short (sell) position. It's within a highlighted purple resistance zone, indicating potential price rejection. - **Stop Loss (SL):** 3136 Positioned just above the resistance zone, this protects against further upside movement if the trade goes wrong. - **Take Profit (Target):** 3050 This is the downside target, anticipating a move lower from the resistance.---### 🟪 Zone Highlighted- A **purple rectangular zone** marks a strong resistance area where the price previously reacted. This is the key area for potential reversal.---### 💡 Strategy Insight:The chart shows a rising trend leading into a resistance zone, suggesting a possible **reversal or pullback**. The trader is looking to capitalize on a **short-term decline** from that resistance level.✅ **Trade Status: Active**- **Current Price:** 3123.92 (XAUUSD)- **Entry Zone:** 3129–3131 ✅ **Price is already within the entry zone**, meaning the short trade setup has likely been triggered.---### 🔻 **Price Action:**- The price **rallied strongly into the resistance zone**, touching or slightly piercing the top boundary before pulling back slightly.- This suggests possible **early signs of rejection** from the resistance area, which aligns with the short setup.---### 📊 **Next Steps to Watch:**- **Bearish confirmation** (e.g., bearish candlestick patterns, lower highs) could strengthen the setup.- **If price rises above 3136**, the trade would be invalidated (stop loss hit).- **If price drops toward 3050**, the target would be achieved and the trade would be successful.
Gold (XAUUSD) Short trade setup

This chart is a **Gold (XAUUSD) short trade setup** on a lower timeframe (likely 1-hour or 30-minute). Here's a breakdown of the analysis:---### 🔍 **Chart Components:**- **Instrument**: Gold Spot vs USD (XAUUSD)- **Entry Point**: Around **3007.10**- **Stop Loss (SL)**: **3018**- **Take Profit (Target)**: **3057**---### 📉 **Trade Idea:**- The chart shows a **bearish breakout** from a rising wedge pattern (or possibly a bearish flag), a common reversal pattern.- After the breakout, price **retested the trendline**, suggesting confirmation of the breakdown.- The arrowed projection indicates a **move downward** targeting **3057**, aligning with the lower support zone.---### 🧠 **Risk/Reward Overview:**- **Short trade bias** (expecting price to fall)- **Risk**: ~11 points (3018 - 3007)- **Reward**: ~50 points (3007 - 2957)- **Risk-to-Reward Ratio (RRR)**: Approx. **1:4.5** – a favorable ratio---### 🛠️ **Technical Signals:**- **Price Action**: Break and retest- **Chart Pattern**: Rising wedge or flag- **Bearish confirmation** from rejection wick at resistance and a clean breakout candleAs of the current candle in the chart, here's the **status of the XAUUSD trade setup**:---### ✅ **Trade Setup Status**:- **Trade Type**: **Short (Sell)**- **Entry Level**: ✅ **Price has entered the trade zone** (~3007.10)- **Current Price**: 📉 **3005.61** (below entry, in slight profit)- **Stop Loss (SL)**: ⛔ **3018** (still intact)- **Target**: 🎯 **2957** (corrected from mislabelled 3057)---### 📊 **Trade Progress**:- ✅ **Break and retest of structure completed** (clean rejection after retest)- ✅ **Bearish momentum** is currently following the projected path- 🕒 **Trade is active** and slightly in profit- 🔍 Watching for continuation below recent minor support near **3000** to gain downside traction---### ⚠️ **What to Watch**:- If price breaks **below 3000** with momentum, that would add strong bearish confirmation- Be cautious if price reclaims the retest level (~3008–3010) — it might invalidate the short setup
XAUUSD (Gold vs. US Dollar) on the 15-minute

This updated chart is the **15-minute timeframe** version of the same **XAUUSD short setup** shown earlier, and it provides a broader view of market structure and context.### 🧩 Key Observations (Compared to 5-Minute Chart):- **Price Action**: You can now see the previous support-turned-resistance more clearly. That purple zone has acted as a clean supply area — price rejected it multiple times.- **Entry Confirmation**: The rejection candles forming just under the entry zone (3031–3034) look promising, showing sellers stepping in.- **Structure**: The market made a lower high into the zone, consistent with a potential continuation to the downside.- **Volume/Volatility**: From the strong bullish reaction off the demand zone (around 2980) and quick rejection from supply, there's decent momentum in both directions — so managing this trade actively will be important.### ⚖️ Trade Plan Recap:- **Entry**: 3031–3034- **Stop Loss**: 3045- **Target**: 2980- **Reward to Risk Ratio (RRR)**: Still approximately **3:1**✅ **Trade Status Update**:- **Current Price**: ~**3028.77**- **Entry Zone**: **3031–3034** → ✅ **Trade has triggered**- **Stop Loss**: **3045** → ❌ **Not hit**- **Target**: **2980** → ⏳ **Still in progress**---### 📉 Price Action Notes:- Price **entered the trade zone**, slightly above 3030, and then **rejected the supply zone**.- It has since moved **slightly in your favor**, currently sitting below entry, around 3028–3029.- No signs of invalidation yet — the stop loss is safe for now.- Price is **respecting the structure**, showing potential to continue lower.---### 🕹️ What to Watch Next:- A break **below 3020** would likely confirm continuation toward the 2980 target.- If price retests the entry zone but fails to break 3034 again, it could be a sign of weakness and continuation.- If price pushes toward **3040–3045**, keep a close eye — stop could be tested.
Disclaimer
Any content and materials included in Sahmeto's website and official communication channels are a compilation of personal opinions and analyses and are not binding. They do not constitute any recommendation for buying, selling, entering or exiting the stock market and cryptocurrency market. Also, all news and analyses included in the website and channels are merely republished information from official and unofficial domestic and foreign sources, and it is obvious that users of the said content are responsible for following up and ensuring the authenticity and accuracy of the materials. Therefore, while disclaiming responsibility, it is declared that the responsibility for any decision-making, action, and potential profit and loss in the capital market and cryptocurrency market lies with the trader.