Technical analysis by Michael-trades- about Symbol PAXG: Buy recommendation (4/16/2025)

Michael-trades-
hart Overview (XAUUSD - 30 min timeframe)
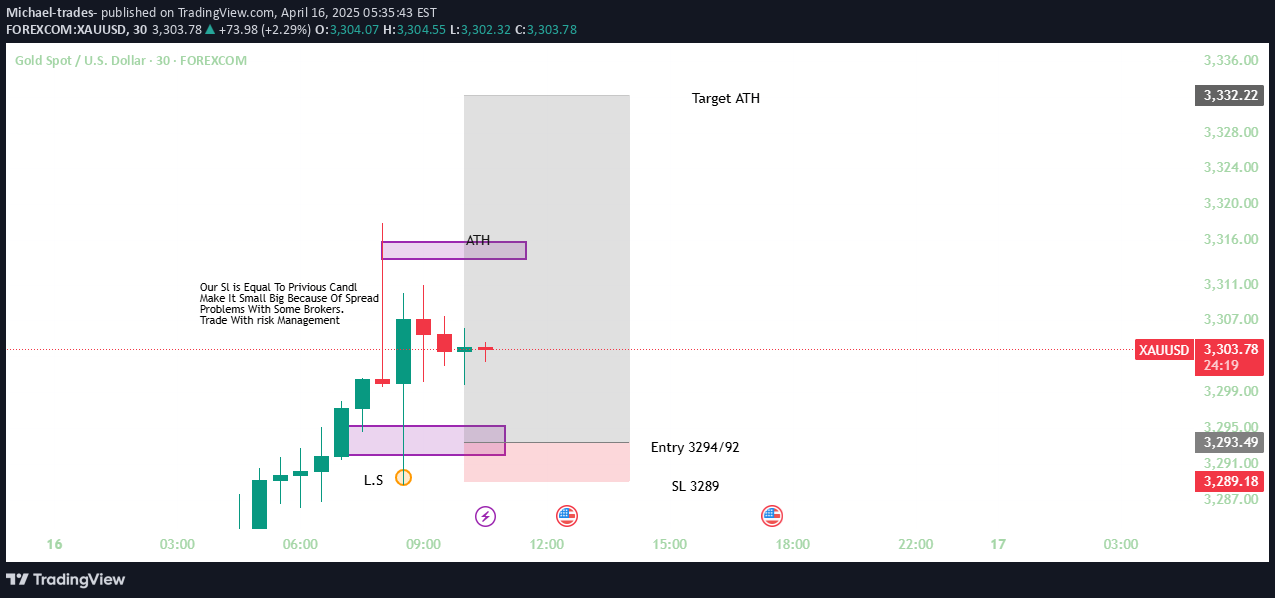
📊 **Trade Setup Description – XAU/USD (Gold)**This is a **bullish breakout setup** on the 30-minute chart of XAU/USD, aiming to capitalize on momentum continuation toward the **All-Time High (ATH)**.---### 🔍 **Setup Details**:- **Trade Direction**: Long (Buy)- **Entry Zone**: 3292–3294 Price broke above a key level (marked support zone), offering a potential entry as it retests.- **Stop Loss (SL)**: 3289 SL is set just below the previous candle low to reduce exposure and protect against invalidation.- **Take Profit (TP)**: 3332.22 (Targeting ATH) Based on previous resistance at the ATH level.---### 💡 **Key Concepts Noted on the Chart**:- **Left Shoulder (L.S)** indicates part of an inverse head and shoulders formation—a bullish reversal pattern.- **ATH Zone** is highlighted as both a target and potential resistance.- **Risk Management Note**: Traders are reminded to adjust SL for broker spreads and to always manage risk properly.---### 📈 **Trade Objective**:To catch a continuation of bullish momentum as gold retests the breakout zone with a tight SL and a high reward-to-risk ratio aiming for the ATH."Chart Status" is a summary term that encapsulates the overall technical condition and readiness of the trade setup. In the context of your XAU/USD chart, it refers to several key aspects:---### 1. **Technical Pattern Overview**- **Bullish Formation:** The chart shows a bullish pattern that includes elements resembling an inverse head & shoulders structure. This suggests a potential reversal from prior trends and supports the long trade idea.---### 2. **Entry Zone**- **Precise Levels:** The suggested entry lies within the 3292–3294 range, where price behavior supports a break above critical resistance. This zone is defined based on previous candle action and overall momentum.---### 3. **Risk Management Zones**- **Stop Loss:** Set at 3289, the stop loss is placed just beneath a key previous candle, marking a safety limit. This boundary is essential to limit potential losses if the price action unexpectedly reverses. - **Risk-to-Reward:** With the target at the ATH (~3332.22), the setup presents a strong reward-to-risk ratio. The defined boundaries help in calculating and managing this risk effectively.---### 4. **Profit Target / Exit Strategy**- **Take Profit Level:** The ATH at approximately 3332.22 acts as the primary target level. This is the zone where price might face resistance, making it an appropriate exit point to secure profits.---### 5. **Overall Market Sentiment**- **Confirmed Bullish Momentum:** The chart status, integrating all these elements, signals strong bullish momentum. The clear entry, stop, and target levels provide a systematic approach to trading, while the technical patterns underpin the bullish bias.