
MesutKose
@t_MesutKose

What symbols does the trader recommend buying?
Purchase History
پیام های تریدر
Filter
MesutKose
BTC/USDT Mayıs Güncelleme
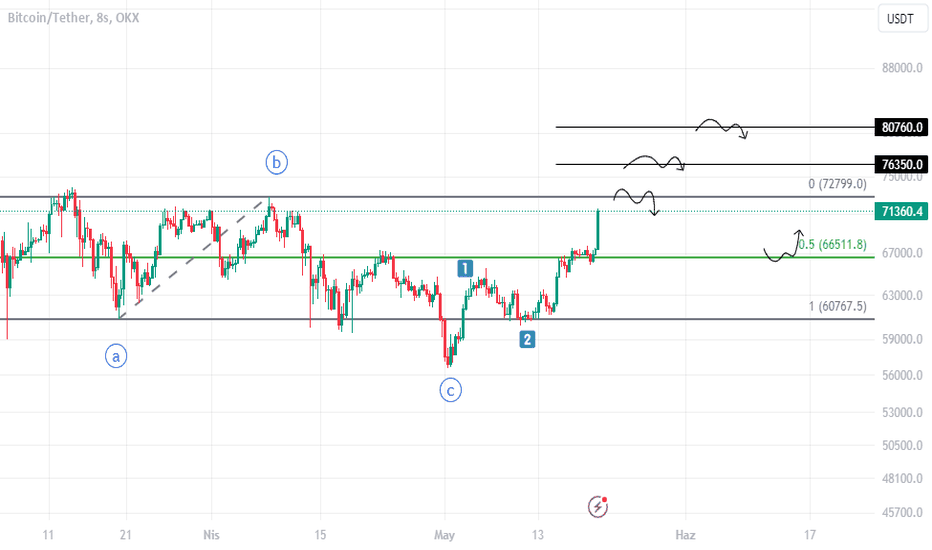
This chart is a continuation of my May chart and expectation. I stated my expectations for the second stage on the chart. Fib. I purposely pulled my extension from the correction waves. This structure has worked this way many times before. However, it is necessary to consider alternatives. This time I have two scenarios. The first is a correction from 76k or 80k. The second is a retreat from the top of the range to the 0.5 balance point. I am in favor of the first. However, the second one is also reasonable and will not upset you. I bought my expectation at the beginning of the month. I will move forward by realizing profit. It ended at 1 on the low time frame in terms of Elliott principles. We are looking for 3. Wherever 3 ends, that's when we think about 4. We should not jump off the train just because the RSI and some indicators are overbought but inflated until they give negative divergence. Peace be upon you.
MesutKose
BTC/USD Mayıs 8H

We have a simple and straightforward range structure and 3 important areas. This structure is also our accumulation area. I marked the path of the price on the chart with zigzags. The green band is the area where the price finds support. The blue band is our balance point, the 0.5 region. And at the top is our red band range resistance. The price moves from the green band and reaches the balance point. When it rises above it, it retests and increases its power. It reaches the red band. As soon as the red band jumps on it, it makes ATH and wants to continue its trend. So we say that while we are in the accumulation phase, the top of the red band is our seller area. Then, when the price falls to our balance point again and stays above it, it is above the red area again and again above the red area. Liquidity plays on the red band with our balance point for a while and the price comes back below the balance to our green support area. And it repeats the liquidity games it made in the upper band, this time in the lower region. The price hanging below is the fib between 15k-69k. It touches our 0.786 region at the level, enters the range again and gives a retest. I think we have come to the end of the accumulation. Now our first target is our balance point, the blue band. We can say that if we put it on it, it will bring life to the market. And when the red band is abandoned with a strong price, our new ATH journey begins. I wish you well-being.
MesutKose
ETH/USD Mayıs-Kısa Vade

BTC.D relaxes. ETH/BTC seems to have found its bottom. Indicators seem to have cooled down. I also explained my expectations on the chart. We accumulate in the yellow box. I don't expect a dump, but it wouldn't scare me if it wicks down locally somewhere between 4h-8h and moves up quickly. I think the subseason is near. Peace be upon you.
MesutKose
BTC/USDT 12H Kısa Vade-Mayıs

I stated the things I found important and my expectations on the chart. Indicators have cooled down. We are nearing the end of the accumulation. We have a trend going as 26k-27k>38k39k>56k-57k. The trend is progressing with RSI approval. It will be a more enjoyable month if we close within the large range structure. I'm not afraid of manipulation, as long as it doesn't stay too long. However, as seen in the range structure formed in the last region, I think that the 60500-61000 region will loosen downwards and make daily candle closings. Let's pay attention to our Risk-Reward ratio. Best of luck.Transaction closed: target reached
MesutKose
BTC/USDT 1H

I showed my opinion on the graph. A volumeless and futures supported rise. Dead Cat Jump is available. It should return to liquid areas.
MesutKose
BTC/USD 2023 Son Çeyrek
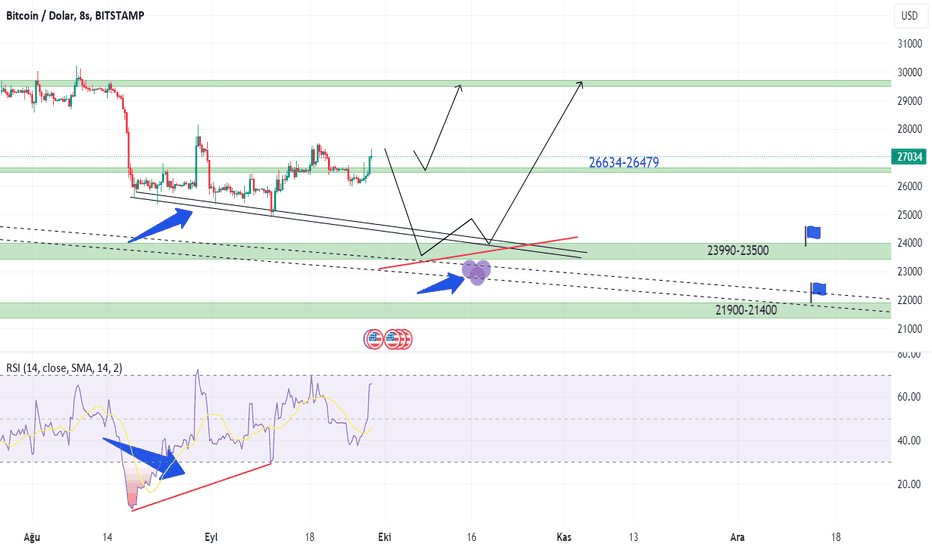
I showed everything I care about on the graph. A versatile plan, but ultimately the trend upward upward. If the first thrust wave is finished in HTF, -0,5-0,618- should be demolished. From there, the second impulse should start. My opinion should throw wicks from the marked area to the trend band (purple balloons) and start action. However, the neck area in the 26k region was broken upward. He can walk again after retest. In addition, if the conditions mature, the new AC is quite possible until Halving.
MesutKose

MesutKose
BTC/USD 2023 Son Çeyrek
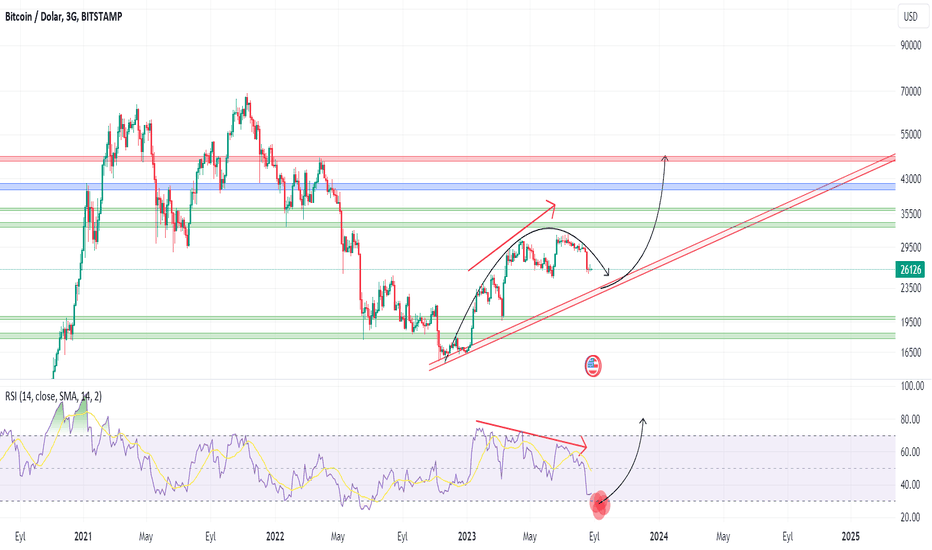
It is a trend -based analysis. I expressed my opinion on the graph. Is my personal plan. I don't target green areas. The blue area is the red area, my final target, with the intermediate target. I don't expect a new bottom. I would like to see an aggressive trend return. The trend is essential. I have different plans for every price movement other than my expectation. I wish you good trade.
MesutKose
ACM/USDT

I think it will show the expected performance over $ 3. This summer will be nice. My expectation is not 9 dollars, but more. 2 months for fans in general.
MesutKose
BTC/USD Haziran

There is everything I care about in the graph. Under the purple band, permanence decrease can deepen the price and push the price to the red band. But I don't think the main trend will be broken. I expect my expectation that the price will rise to 37.5k-40.5k in the end of the summer.
Disclaimer
Any content and materials included in Sahmeto's website and official communication channels are a compilation of personal opinions and analyses and are not binding. They do not constitute any recommendation for buying, selling, entering or exiting the stock market and cryptocurrency market. Also, all news and analyses included in the website and channels are merely republished information from official and unofficial domestic and foreign sources, and it is obvious that users of the said content are responsible for following up and ensuring the authenticity and accuracy of the materials. Therefore, while disclaiming responsibility, it is declared that the responsibility for any decision-making, action, and potential profit and loss in the capital market and cryptocurrency market lies with the trader.