
Mboersma0324
@t_Mboersma0324

What symbols does the trader recommend buying?
Purchase History
پیام های تریدر
Filter
Signal Type
Mboersma0324

Hey how's everyone doing? It's been a while but I'm going to keep this explanation brief as the chart is self explanatory. This is one of the strongest indications I look for when trying to predict price drops. The way the MACD and RSI look together right now shows very strong potential for a sharp drop. Keep in mind that this is the daily timeframe so it the move may not necessarily play out overnight but it is possible. Even though it is the weekend, I do feel its one of those rare weekends where we can possible see price movement. I do think there's some potential for a move higher in the short term as I've indicated here on the 4H timeframe. As long as BTC is below the 0.786 level on the chart (70K) there is strong potential for a 15%+ move to the downside IMO. I'd look for potential support in the lower 50K area (54K +/- 2K) Another possibility to look out for is a quick sharp drop that plays out very fast (within a day) creating a quick wick / bullish hammer candle which would be a strong bullish indicator on the daily chart for upside continuation. The point is the possibility for the move down before upside continuation is very high. As I've mentioned, Invalidation point would be a move above 70K. That's all for now. Take care & Trade safe.So far things are going as predicted. We did see the short term move to the upside based off the 4hr chart but now, it appears to be time for a swift rejection. There's only 4 more hours left in this daily candle and if BTC closes at current levels (64,100) or lower then the dump-party is officially beginning. As of now, I expect mid/lower 50K levels by end of April!
Mboersma0324

BTC 1D chart is showing red flags suggesting further downside is likely. With yesterdays bearish-engulfing candle, the RSI dropping below & then getting rejected off the 50, and the current position of the MACD I'd say the odds are very much in with the bears. (For now at least) In my experience, the RSI and MACD can be very helpful indicators during certain situations and this is definitely one of those situations. A rejection off of the "50" RSI level can lead to sharp drops. This is especially effective if some other conditions are met as well like if it's a higher timeframe chart or if the RSI has already dropped below the "50" level and is attempting to break back above it shortly after. In this chart we see all of these conditions met on the RSI and for this reason I think it is very likely that we see further downside. The MACD also plays an important role here. Just as the RSI dropped below "50", The MACD has dropped below "0". We can see it has come up just a little but has been going sideways below the "0" level for a bit here and a drop here could be bigger and more sharp of a drop based on my experience with these indicators. It's important to note that this analysis covers a timeframe of about the next week or so and on even higher timeframes there is still room for a bounce. As long as BTC doesn't CLOSE any 1D or higher timeframe candles below the red "Emergency support" level then I think there is a decent chance to at least retest the current local highs just below 32K. My opinion is that BTC will drop a little further as shown on the chart for the short term. Then I believe we will see quite a good bounce which will at least retest the 32K area OR better yet, BTC will break the 32K area for a nasty bull-trap. As of now I do not think BTC will go much higher than 32K (Maybe up to 35K but that's pushing it IMO) and I think we will see a few months of slow & steady downward price action. Maybe BTC ends up retesting 20K (for the last time) by end of year or early 2024. If a crypto bull run starts in 2024 along with the next BTC halving event, this could very likely be the last time you see prices this low. Only time will tell. Well that's it for now. I haven't posted on TradingView for a while but I saw this as a good opportunity to do so. Take Care & Trade safe. Feel free to LIKE, COMMENT & SHARE. If you'd like to see more charts published on here, let me know and I'll see what I can make happen.
Mboersma0324

How's everyone doing? I have a BTCUSD Fractals analysis here also with RSI, MACD, and BBWP confluence. If things play out as previously BTC could see a 50% drop. There is only 1 example here so maybe the percentage drop will be different than 50%. We'll keep analyzing as time goes on. Personally, I've seen good results using similar charts with fractals combined with other indicators which further show that BTC is in a similar area. This chart is pretty self explanatory. If you like it please LIKE, SHARE, FOLLOW, and feel free to comment. More charts and analysis coming soon. I also left a link to a related idea I made recently which is confluent with this idea as well.
Mboersma0324

How's everyone doing? I have a good analysis here after Bitcoin latest volatility pickup after CPI data comes out worse than expected. This happened A month or two ago where bad CPI data came out but bulls bought the dip and rejected the downside move (manipulation?). Anyways this analysis points out not to get too bullish here although the daily candle looked great yesterday and we probably will see a little bounce because of that but BTCUSD has a lot of resistance up ahead on higher timeframes. There is 3 levels on the charts which are all 0.786 retracement levels with different tops. I expect the middle one to be a critical level based off of the Daily MACD. There will likely be a big pickup in volume here if BTC bounces up to this level (21,800) Also notice the Daily Bollinger Bands tight indicating a big move is coming. Remember this is a Daily chart so it can longer to play out. Looking at the MACD, We can see BTC is climbing but still below the "0" level leaving room for a possible bull trap in the near future HOWEVER, with that being said, the MACD IS ALSO in a spot where if it goes just a little higher than the bull trap area I'd expect a big pickup in buying volume and likely price as well. I do personally believe a new low is likely to come but we may see a bounce/trap first. Maybe within 2 weeks or a month... well see how long things take to play out. Other than that the chart is pretty much self explanatory. If you guys like it please like, follow, share & feel free to comment if you like.This chart is still in play. The green support and the ORANGE 0.786 level are still critical levels.
Mboersma0324

Hello everyone! I haven't published charts on TradingView for a while BUT I am considering starting up again. What do you guys think? Hope everyone is doing well through this bear market. Unfortunately, I have some more bearish analysis for you here but these indicators have been VERY STRONG in my experience and as you can see on the chart. This chart uses the Breadth & Volume indicator which has become one of my favorite, go-to, indicators for signals lately. This is a BTCUSD DAILY chart so these signals are typically stronger than smaller timeframes and the Daily chart also carries more weight than smaller timeframes as well. This is a VERY SELF EXPLANATORY chart. I took a lot of time to make it as easy as possible to understand because I feel this signal is very important. I have back-tested this signal over the last 16 months as you can see on the chart here. This signal has flashed just 5 times over the last 16 months (actually 6 because 2 of them are connected but I count that as 1) THE ACTUAL SIGNAL WE'RE TALKING ABOUT HERE is "BEARISH DIVERGENCE" on the B&V INDICATOR. (Represented by RED LINES on the B&V indicator) I marked all of the signals with vertical lines and a yellow oval around the actual signal itself. If you look at all the signals on the chart, they have ALL led to DOUBLE DIGIT DROPS! Not just that, but you can see that almost all of the drops started IMMEDIATELY after the signal flashed. There is ONE exception shown on the chart in the GREEN CALLOUT LABEL where BTC price increased by about 6% BEFORE dropping. The AVERAGE DROP is greater than 27% and the average timeframe is 34.4 days. Notice one of the drops took over 70 days while one took just 5 or so but most seem to be between 20-30 days. Based off of this powerful signal, I think going "SHORT" is the way to go. As you can see on the chart, If BTC were to fall 27.4% it would put the price just BELOW 15K. Also, 34.4 days from the signal is NOVEMBER 8th. I hope you all use this information wisely. I'm happy to share it with you. Please LIKE, COMMENT, SHARE and FOLLOW me for more analysis! Until next time, Take care.
Mboersma0324

So this is something I'm testing out. The chart is titled "Triggers" because the horizontal dashed lines represent price action triggers based off of my analysis! Basically, if the analysis is correct, any 1HR CANDLE that CLOSES above/below the YELLOW line will likely continue to the blue area. Also, if any 4HR CANDLE CLOSES above/below the GREEN line, price will likely continue towards the blue box. This is a 1HR chart, however, there are GREY VERTICAL LINES on the chart that represent the 4HR candle closes. By publishing this chart, we can always come back to it and press the "PLAY" button to see how things played out. It's a little tricky to do on a phone though, you have to turn the phone sideways (landscape view) and sometimes scroll forward or push the ">>" button before the "play" button becomes visible. Hope you guys like it. It'll be interesting to say the least. In the future I plan to combine them with the analysis used to come up with the levels by leaving a link to those charts in the description. Feel free to comment and please LIKE, FOLLOW, and SHARE if you wish. Thank You!
Mboersma0324

Not a lot of time for description here but BTC indicators are pointing DOWN . A new 4HR candle just started. There's bearish divergence on the RSI . BTC will likely pull this one down. Look to buy at the 0.618 retracement level instead which is about 0.000009 Potentially BIG gains from there NEXT WEEK... Will update as needed. I feel bad for anyone who gets caught in this. IF I'M WRONG (I could be) and it pumps without me, I'm fine with that! All I'm saying is I believe late buyers here are going to get punished! Take care and use EXTREME CAUTION.Things got a little close there but so far so good. BTC has started to break down but there's still some support levels that need to be broken to reach the "BUY" area on the chart.
Mboersma0324
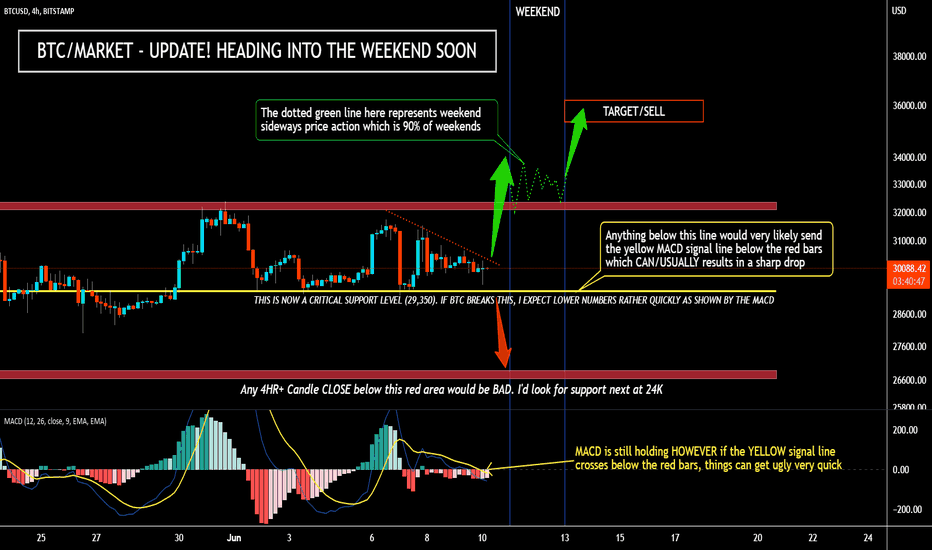
Hey guys this is just a market update here for BTCUSD and the crypto market in general. It's FRIDAY and with the weekend coming, the time to make a move is now! I wouldn't be surprised to be a bigger move today as we've been waiting all week (month... year...). Sometimes big moves do happen at the end of the week, that way over the weekend the volatility can calm down a bit. It just kind of works out. The VOLATILITY has been insane this week. BTC has gone up and down and up and down, only to end up SIDEWAYS. LOL. BTC is still holding support, BUT BARELY! If you look at the MACD on the bottom of the chart you can see the yellow signal line IS below "0" but not below the red bars. Usually in situations like this, once the MACD SIGNAL LINE falls below the red bars that's kind of the "point of no return" and since these are 4HR candles, It has good potential for a sharp drop. Judging by the price action on the chart and the MACD, I'd say if BTC falls below 29,350ish that'll PROBABLY do the trick. ESPECIALLY if the 4HR CANDLE CLOSES below that line. In this situation I would definitely be looking for a bounce at the 27K area. If you've been following my ideas and updates you know I've been waiting for BTC to drop to the 27K area for quite some time however BTC has been holding sideways, reducing the chances of the 27K Idea playing out. I'd currently say it's about a 50% chance, with the other 50% chance being that BTC is bottoming now and will make a move up to the 36K area soon. Whether BTC drops to 27K-28K or not, I still believe its very likely that we will see a market wide relief rally soon and the target for that (AS OF NOW) is around the 36K area which is 20%+ I personally think there's about a 90% chance that BTC WILL make a move fairly soon (within days to a month) up to the 36K area. Even if the yellow support line breaks here on this chart and BTC moves to the 27K area I STILL think there's a 90% chance it bounces and moves up there... The question is when? If you're NOT USING LEVERAGE, I think its probably a good time to buy in and look to sell when BTC reaches the 36K area. It MIGHT fall just shy of 36K so I wouldn't put your sell orders at exactly 36K. 35.5K-36K would be more appropriate. If YOU ARE using leverage, The safest thing you could do IMO is HOPE that 27K bounce comes. If BTC drops to 27K-27.5K and its followed by very strong buying pressure, I THINK THAT would be an excellent time to buy in with leverage. Of course MAKE SURE to place your STOP LOSS orders and judge the risk reward ratio of your trade before making it. You can get liquidated VERY FAST in these markets especially if you've been using leverage this week because BTC has been up and down 5%-9% multiple times. That's easily enough to liquidate a 20x leveraged position and almost enough to liquidate a 10x position depending on where you bought in. Using leverage IS A WHOLE DIFFERENT GAME and if you want to learn more about it feel free to ask me. I (as well as most decent market analysts) DONT THINK it's likely that BTC breaks below say 26,500-27,500 before a relief rally. That is just the general consensus. Of course we could all be wrong and get wrecked but that is the risk you take. In my experience Technical Analysis DOES WORK and it is based off of human psychology. If you are disciplined it can work very well. It doesn't really work any other way. To sum everything up, * I'd say there's a 90% chance that a relief rally up to the 36K area is coming SOON (within DAYS to a MONTH) * The question is whether or not BTC will drop lower to the 27K area first? In either situation I PERSONALLY EXPECT THE RELIEF RALLY and I have buy orders between 27K-28K * I think it's very UNLIKELY that BTC breaks much higher than 36K (if it does at all) * I think it's very UNLIKELY that BTC breaks BELOW 27K before heading up to the 36K area first! (unless its a wick... 26,500 to be safe) And LASTLY, ***** I DO NOT think this is the MACRO BOTTOM as in "BTC will never touch these low prices again". THIS IS LIKELY JUST A SHORT/MID TERM BOTTOM so you're going to want to sell/take profit otherwise later this year you will almost certainly be at a loss ***** AS OF NOW, I believe the MACRO BOTTOM will come during Q4 of this year or early 2023. AS OF NOW, my best guess is that the price of that MACRO BOTTOM will be around 20K (18K - 22K) When the time comes, we will have a better idea of price & timing so FOLLOW ME. Also note that if you do buy when the macro bottom comes, It's likely that price action will be MOSTLY SIDEWAYS (with a few pumps and dips here and there). I think the whole year of 2023 will be a very slow steady climb as far as price increase. Maybe BTC starts the year at 35K and ends it at 55K. That might sound like nonsense to you but when you understand BTC halving cycles you'll understand that the next BULL RUN is not likely until spring of 2024. So what I'm saying is if you buy the MACRO bottom and you want to hold it until BTC hits 100K then you're likely going to have to hold it a couple years. When BTC was 55K and I posted a "warning" analysis chart showing BTC dropping to 20K everyone thought that was nonsense too. When ETH was around 3,700 I posted a chart showing it dropping to 2,300 then bouncing back up to 3,700 and then going back down... People thought THAT was nonsense too, but IN FACT , IT WAS SPOT ON because I was using a highly accurate harmonic pattern. I'll leave a link to that chart below, as well as a couple others. That's all I got for now, sorry for rambling on so much lol and for any spelling/grammar errors. You get the point. Stay tuned for updates . I Don't always post my updates specifically to TradingView though because they're usually just screenshots, or a few words here and there. Feel free to LIKE, COMMENT, FOLLOW, and SHARE please. I DO appreciate ALL OF IT. It takes me A LOT of time just to make these charts and analysis's, not to mention the time involved analyzing the market before making the charts. Although it is very time consuming, I do it because I enjoy it. See you next time.
Mboersma0324

BTCUSD - Big moves coming! BTC is about to make a potentially big move and as of this exact moment, indicators are pointing up. I'll add more to this later but I just had to publish it for you guys on TradingView! I couldn't leave you out of this one!
Mboersma0324

Hey guys. Short description and simple idea here. It actually has some potential and it does still fit in the analysis. The chart is self explanatory. It's better to read the description boxes in order starting with "A" In a heavily manipulated crypto market, "Technical analysis" can only do so much Ill leave a link to my DXY analysis which is BEARISH for BTC and shows the other side of this idea which I currently think is most likely to play out. Please Like, Follow, Share, and feel free to comment. It's appreciated a lot. Thanks.
Disclaimer
Any content and materials included in Sahmeto's website and official communication channels are a compilation of personal opinions and analyses and are not binding. They do not constitute any recommendation for buying, selling, entering or exiting the stock market and cryptocurrency market. Also, all news and analyses included in the website and channels are merely republished information from official and unofficial domestic and foreign sources, and it is obvious that users of the said content are responsible for following up and ensuring the authenticity and accuracy of the materials. Therefore, while disclaiming responsibility, it is declared that the responsibility for any decision-making, action, and potential profit and loss in the capital market and cryptocurrency market lies with the trader.