
MaximusGains
@t_MaximusGains

What symbols does the trader recommend buying?
Purchase History
پیام های تریدر
Filter
MaximusGains
BTC tested hard here on (P) yearly fib pivot
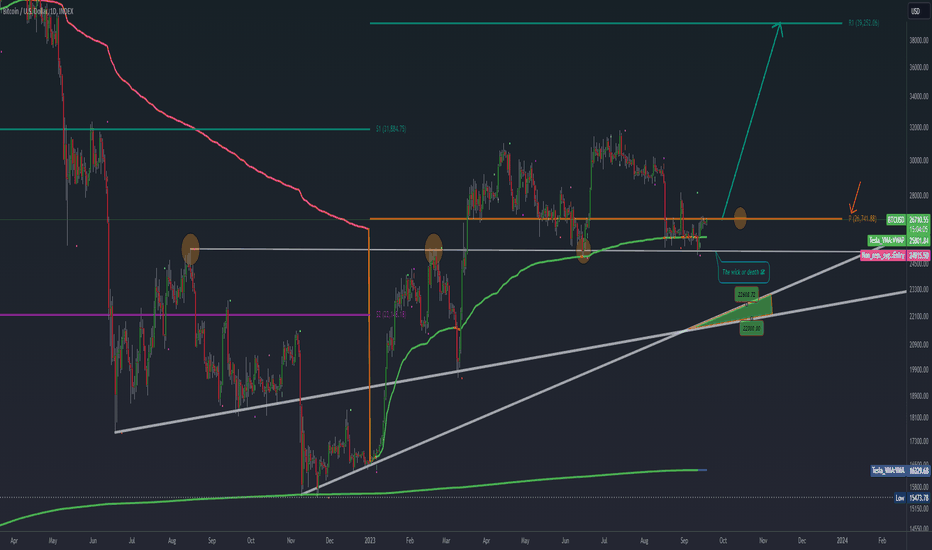
- Uncovering the Rhythms of Bitcoin Bitcoin's recent price action has brought it to a critical juncture, testing the (P) yearly Fibonacci pivot point. In the realm of technical analysis, one tool that's capturing the attention of traders and enthusiasts alike is the Fibonacci pivot points. Derived from the intriguing Fibonacci sequence, these points have a long history of helping predict the future direction of price movements. The underlying principle revolves around the belief that financial markets, including the ever-volatile Bitcoin, follow cyclical patterns, providing some semblance of order in the chaos. Bitcoin seems to be dancing to the beat of these Fibonacci pivot points with remarkable precision. This rhythmic pattern hints at a hidden structure within the crypto markets. But that's not the only pattern I've been tracking. Beyond Fibonacci, I've observed what I call the 'Japanese 3-Year Cycle' in Bitcoin's behavior. This concept bears similarities to the well-known 'Four-Year Cycle Theory,' but with its own unique twist. The 'Japanese 3-Year Cycle' suggests that Bitcoin experiences price peaks roughly every three years, possibly influenced by a myriad of factors, including halving events, technological advancements, regulatory changes, and broader macroeconomic trends. Yet, the world of cryptocurrencies remains as enigmatic as ever. Social media platforms buzz with posts from traders and enthusiasts who grapple with the unpredictable nature of this space. My aim is to bring some clarity to this apparent chaos, to shed light on the inherent order concealed beneath the surface. However, it's essential to remember that while these patterns can offer guidance, they are not infallible predictors of future movements. Cryptocurrencies, particularly Bitcoin, are highly volatile and susceptible to numerous external influences. Always conduct comprehensive research before making investment decisions and consider consulting with financial advisors. In the end, whether it's the Fibonacci pivot points or the Japanese 3-Year Cycle, one thing remains undeniable - Bitcoin's intricate dance continues to captivate us. Let's keep observing, learning, and, most importantly, navigating these markets with wisdom and patience. https://www.tradingview.com/x/Y063EhHj/ https://www.tradingview.com/x/w2NymPej/Get ready"The chart indicates that we are ON Wave 5, the final push of this market cycle. Wave 5 is often driven by strong market enthusiasm but can also signal a market peak. We’re likely to see sharp upward movements, but traders should remain vigilant for signs of exhaustion. Key levels to watch are 170-270K and the support trend line below. Remember, after Wave 5, a corrective phase is likely, which may present new buying opportunities. Trade with caution and manage risk wisely!"Wave 5: Final Push, Extreme Caution Zone 🚨 Wave 5 represents the final stage in an Elliott Wave cycle and often marks the peak of an established trend. While it can offer profitable opportunities, it’s also a phase where extreme caution is advised. Here’s why: 1. High Risk of Reversal Wave 5 usually signifies the final push of a trend before a major correction or reversal. As Wave 5 progresses, the market may become overextended, attracting late buyers driven by “FOMO” (fear of missing out). This phase often experiences declining momentum, suggesting that the trend could soon weaken and reverse sharply. 2. Exhaustion of Market Sentiment Wave 5 often aligns with an overbought market condition. Indicators like RSI or MACD may signal divergence, where price continues up but momentum weakens, hinting at an approaching reversal. Traders who enter during Wave 5 are often driven by emotion rather than fundamentals or technical strength, leading to higher volatility. 3. Limited Upside Potential Compared to earlier waves, particularly Wave 3, the upside potential in Wave 5 is generally more limited. Attempting to enter at this stage poses a high risk since the reward is often smaller, while the potential downside can be significant once the trend reverses. 4. False Breakouts and Bull Traps In Wave 5, breakouts above key resistance levels may not hold, leading to “bull traps” where traders are caught buying at the top. These false breakouts often result in sharp reversals, catching unprepared traders off guard and leading to potential losses. 5. Post-Wave 5 Correction (A-B-C Pattern) Following Wave 5, the market typically enters a corrective A-B-C phase, where price retraces and seeks a new balance. This corrective phase can be deep and prolonged, wiping out gains made during Wave 5 and often more, particularly for those who entered late.
MaximusGains
BTC like a clock

BTC like a clock Bitcoin's (BTC) Price Movement: A Dance with Fibonacci Pivots and the Japanese 3-Year Cycle Hello everyone, In the vibrant world of cryptocurrency trading, one asset stands tall - Bitcoin (BTC). Over time, I have observed that Bitcoin's price action appears to move like a well-oiled clock, respecting certain technical patterns with uncanny precision. One such pattern is the Fibonacci pivot points. These points, derived from the mystical Fibonacci sequence, have long been used in technical analysis to predict the future direction of price movements. The premise rests on the assumption that financial markets, including Bitcoin, tend to move in cyclical patterns - a rhythm to the seemingly chaotic market movements. This rhythm is where Bitcoin seems to dance, hitting the beats of the Fibonacci pivot points with surprising accuracy. In addition to Fibonacci, I have also observed what seems to be a three-year cycle in Bitcoin's behavior - a concept similar to the 'Four-Year Cycle Theory' commonly discussed, but with a unique twist. I fondly call this the 'Japanese 3-Year Cycle'. This cycle suggests a rhythmic peak in Bitcoin's price approximately every three years, which might be influenced by a plethora of factors including but not limited to halving events, technological advancements, regulatory updates, and broader macroeconomic factors. However, despite these apparent patterns, the world of cryptocurrencies is teeming with uncertainty. Social media platforms are filled with posts from traders and enthusiasts who are undecided and, at times, overwhelmed by the erratic nature of this space. My aim is to bring some clarity to this chaos, to illuminate the inherent order hiding within. Remember, while these patterns can provide guidance, they are not foolproof predictors of future movements. Cryptocurrencies, especially Bitcoin, are highly volatile and influenced by a multitude of external factors. Always conduct thorough research before making any investment decisions, and consider seeking advice from financial advisors. In the end, whether it's the Fibonacci pivot points or the Japanese 3-Year Cycle, one thing's clear - Bitcoin never ceases to fascinate us with its intricate dance. Let's continue observing, learning, and most importantly, navigating these markets with wisdom and patience.Trade active:
MaximusGains
BTC Potential Movements

BTC Potential Movements Time for a new update : Hello, traders. I'd like to provide an update on Bitcoin's Fibonacci pivot points for various periods, including 1 year, 3 years, and 10 years. Fibonacci pivot points are a popular tool used in technical analysis to identify potential support and resistance levels. These levels are calculated based on Fibonacci ratios and are commonly used by traders to identify entry and exit points for trades. For this analysis, I've calculated the Fibonacci pivot points for Bitcoin using three different periods: 1 year, 3 years, and 10 years. By analyzing these different time frames, we can get a better understanding of Bitcoin's long-term trend and potential price targets. Based on my analysis, Bitcoin's Fibonacci pivot points for the 3-year period suggest that the current resistance levels are around HKEX:30 ,000 Of course, these levels should be used in conjunction with other forms of analysis, such as trend analysis and price action, to make trading decisions. It's also important to note that past performance is not necessarily indicative of future results, so traders should exercise caution when using Fibonacci pivot points or any other technical indicator. I hope this analysis provides some useful insights for Bitcoin traders. As always, I welcome your comments and feedback on this idea.
Disclaimer
Any content and materials included in Sahmeto's website and official communication channels are a compilation of personal opinions and analyses and are not binding. They do not constitute any recommendation for buying, selling, entering or exiting the stock market and cryptocurrency market. Also, all news and analyses included in the website and channels are merely republished information from official and unofficial domestic and foreign sources, and it is obvious that users of the said content are responsible for following up and ensuring the authenticity and accuracy of the materials. Therefore, while disclaiming responsibility, it is declared that the responsibility for any decision-making, action, and potential profit and loss in the capital market and cryptocurrency market lies with the trader.