
MarketsPOV
@t_MarketsPOV

What symbols does the trader recommend buying?
Purchase History
پیام های تریدر
Filter
MarketsPOV
BTC Reacts to Iran–Israel Escalation: Risk-Off Sentiment Grows
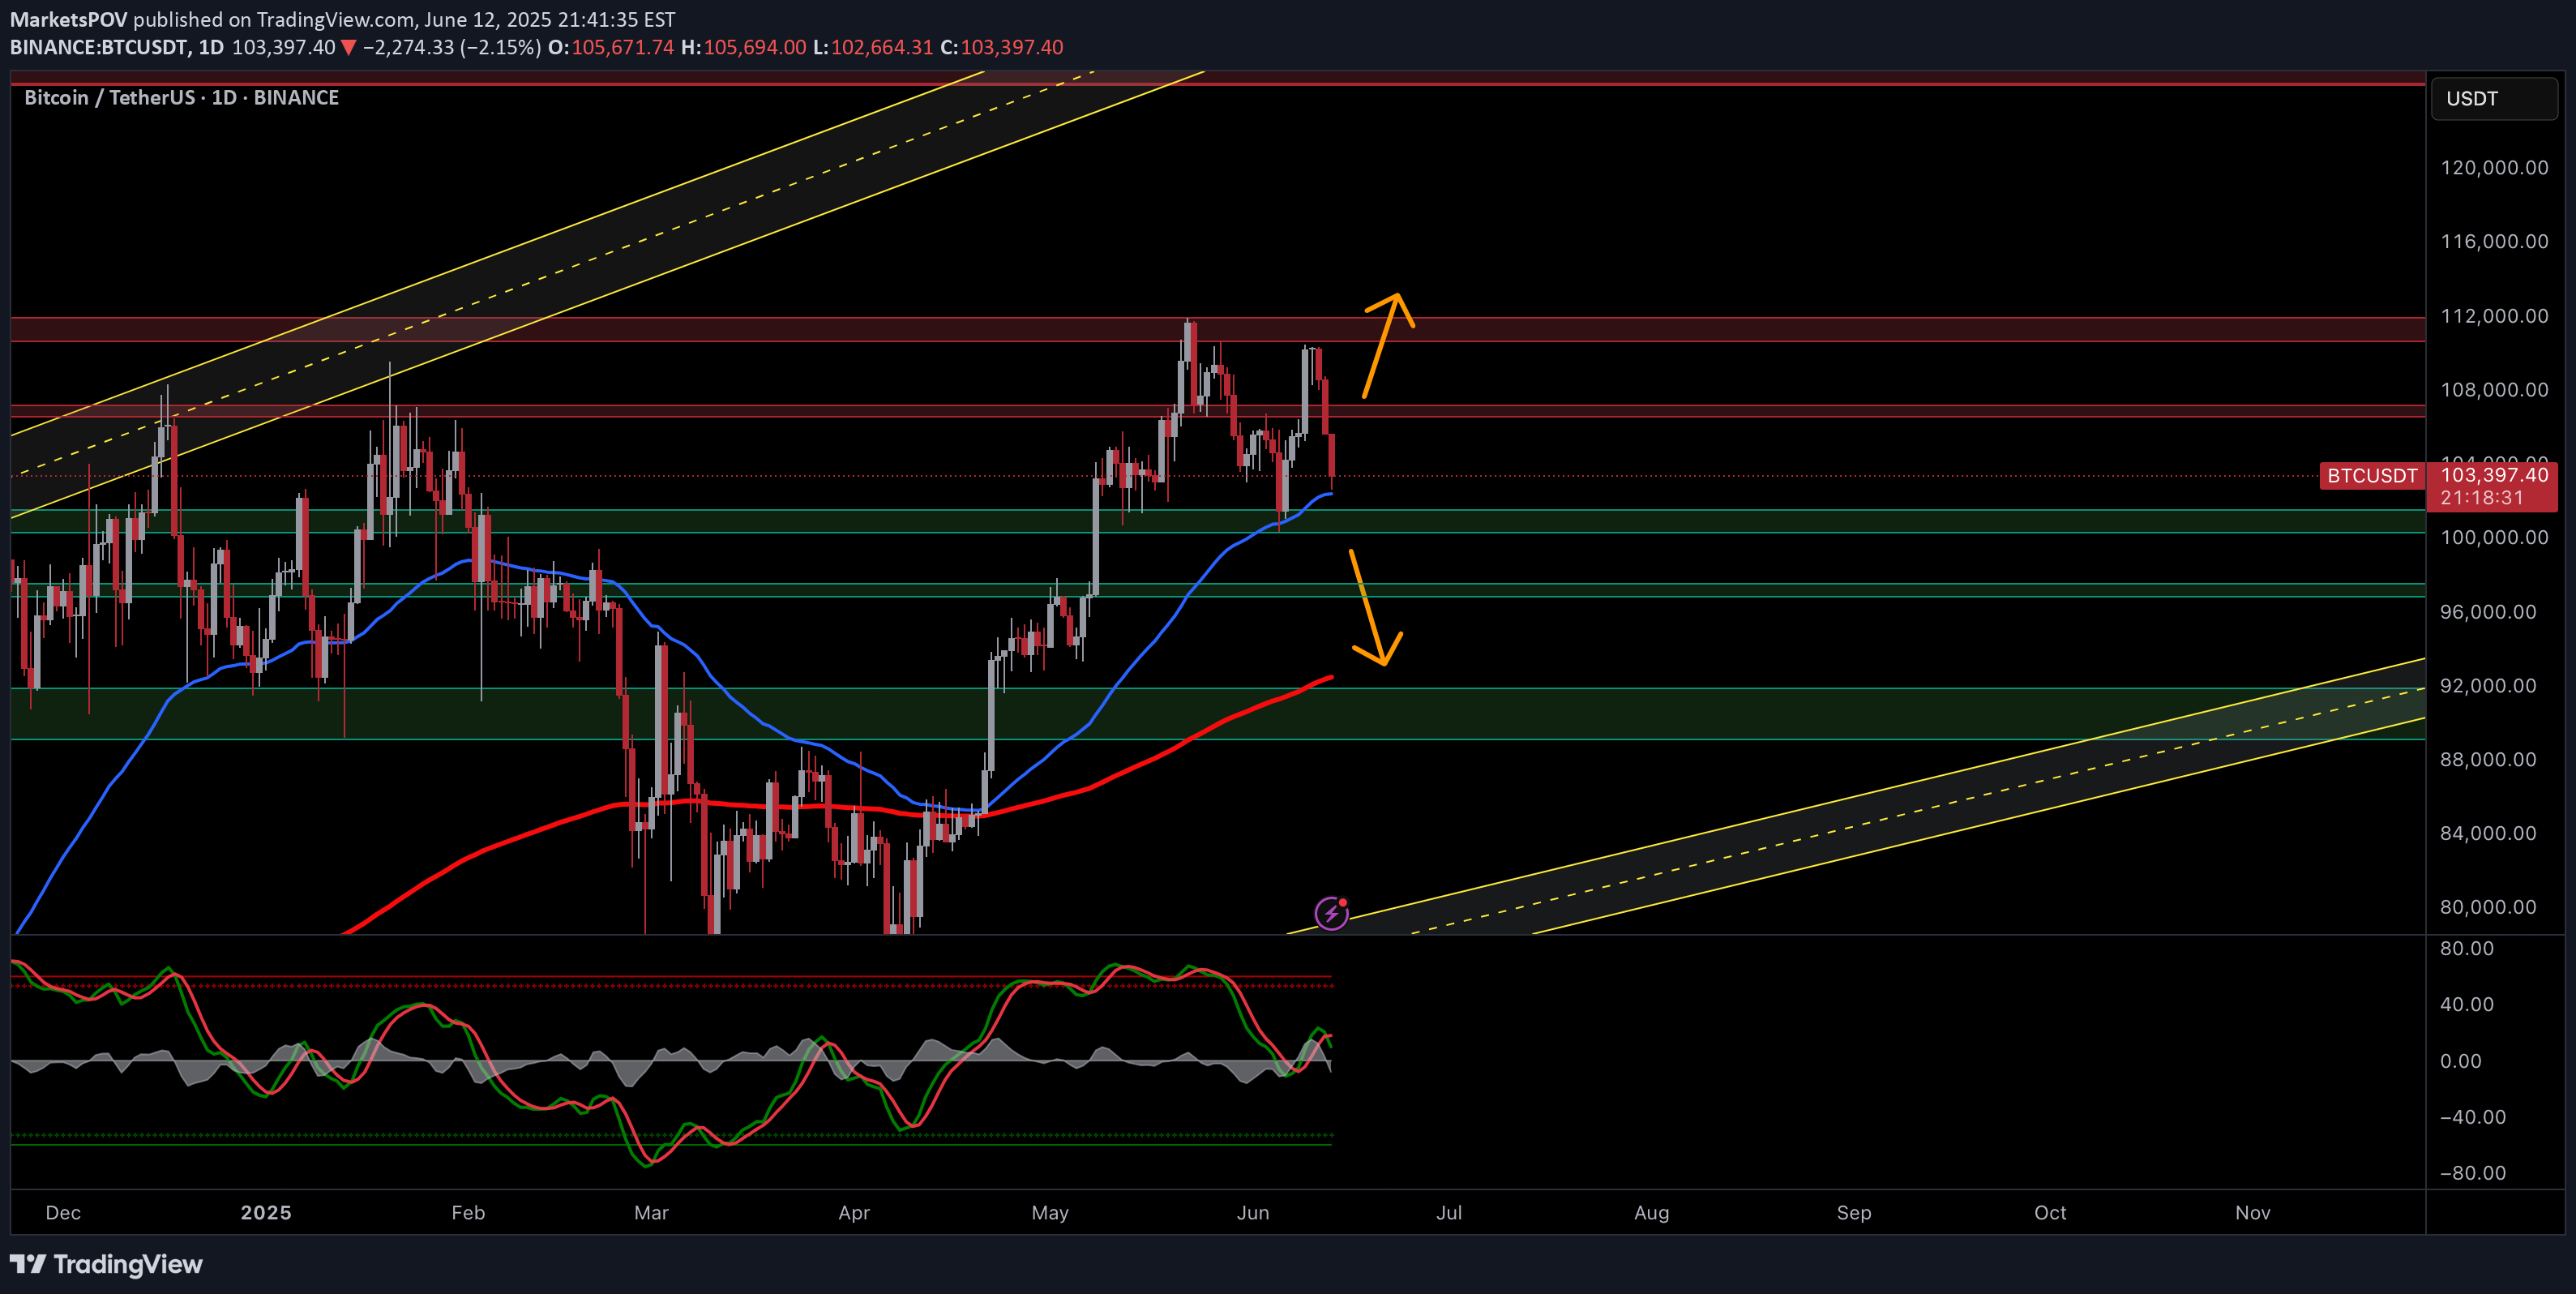
Bitcoin (BTC/USDT) — Caught Between Fear & FundamentalsTechnical Outlook — 13 June, 2025Current Market Condition:Bitcoin has dropped to $103,818 after facing rejection from the $106.8K–$108K resistance zone, coinciding with heightened geopolitical stress following renewed military escalation between Iran and Israel. Traditional markets are showing signs of risk aversion, and while Bitcoin is often seen as a hedge, the current flight to USD liquidity and defensive assets is putting pressure on high-beta instruments like crypto.The psychological $100K support zone, which aligns with the EMA 50 and a key Fib level, is the immediate area to watch. A failure here could expose Bitcoin to deeper retracement toward $96,800 and potentially $92K, especially if global tensions worsen or investors rotate further into cash and gold.Key Technical Highlights:Rejection at supply zone near $106,888–$108,000.Support at $100K holds structural and psychological importance.Stochastic shows bearish momentum crossover, increasing downside probability.EMA 200 at $92K could act as ultimate cushion in a full-blown correction.Volatility likely to remain elevated amid Middle East conflict and global uncertainty.Trade Plan:🔼 Bullish Relief Bounce (Long Bias):Trigger: Reclaim and hold above $106,888 with rising volumeTarget: $108K → $112K → $116KStop Loss: Below $103,500🔻 Geopolitical Risk Sell-Off (Short Bias):Trigger: Break and close below $100,000Target: $96,816 → $92,000 → $88,000Stop Loss: Above $102,500📉 Dip Buy Strategy:Trigger: Price stabilizes at $96.8K with divergence and calming geopolitical headlinesTarget: $103K → $106KStop Loss: Below $95K🛡️ Risk Management Note:With geopolitical risk driving short-term sentiment, expect volatility spikes, whipsaws, and fake breakouts. Remain nimble and manage exposure carefully — especially during weekend sessions when crypto trades unhedged and news developments can occur without warning.📢 If you found this analysis valuable, kindly consider boosting and following for more updates.⚠️ Disclaimer: This content is intended for educational purposes only and does not constitute financial advice.
MarketsPOV
Bitcoin at the Crossroads: Will BTC Breakout or Retest Support
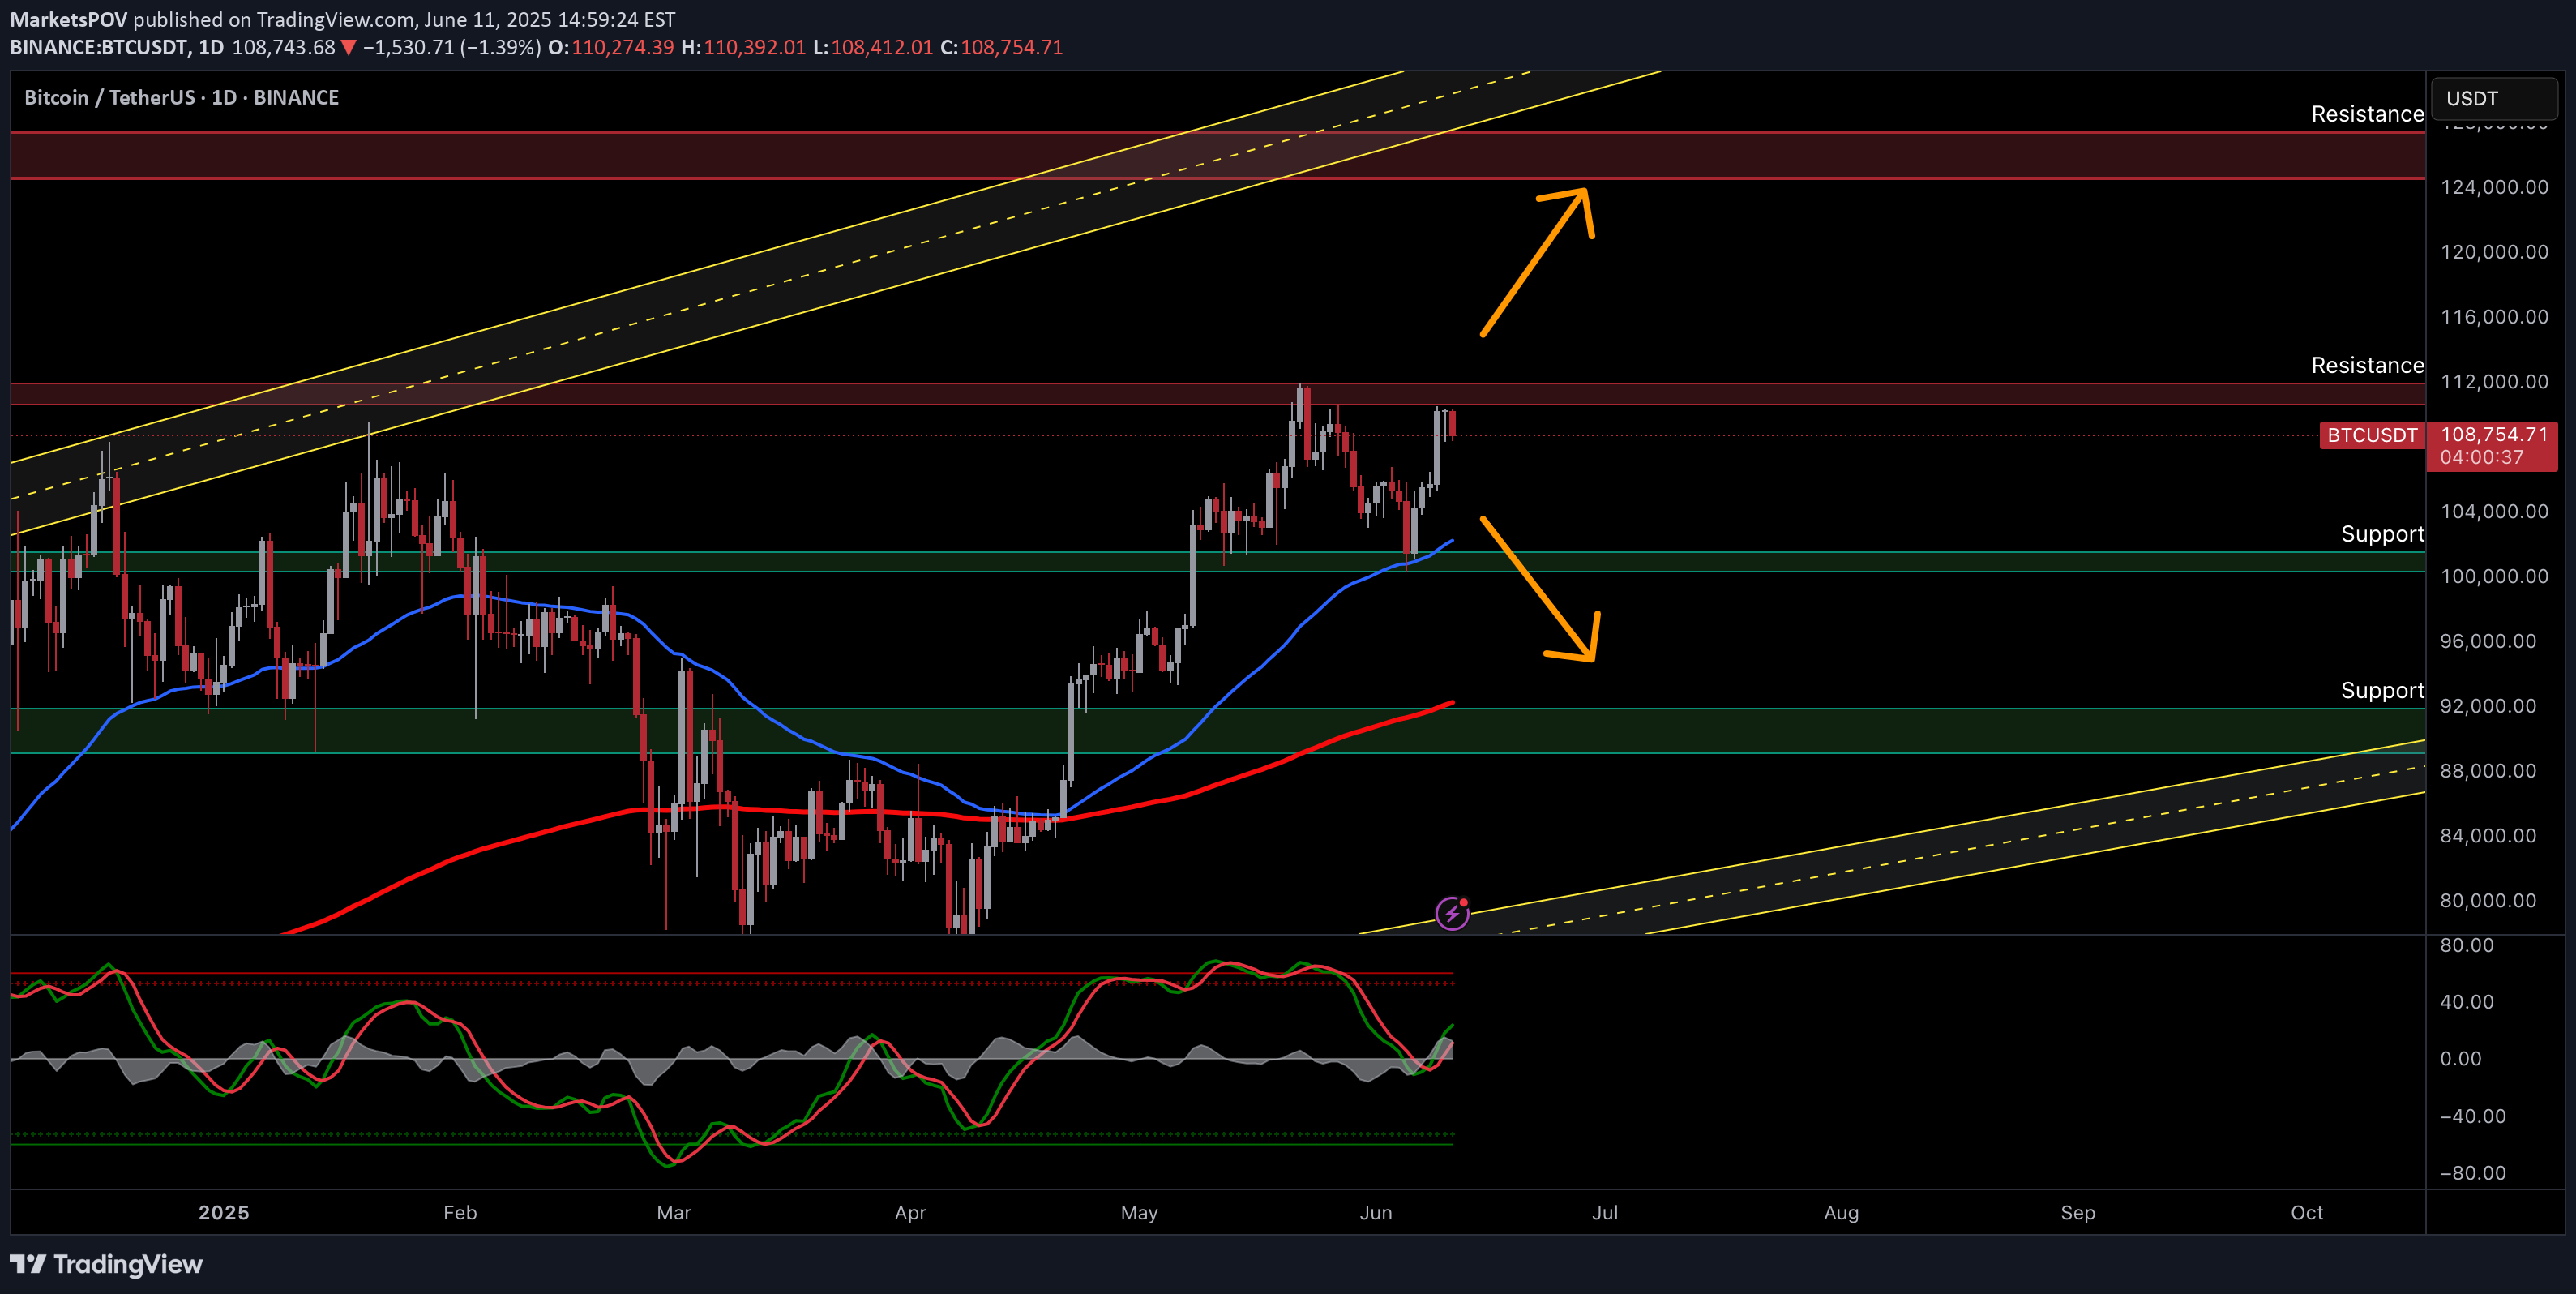
Bitcoin (BTC) – Testing Resistance, Ready for Reversal or BreakoutTechnical Outlook — June 11, 2025Current Market Condition:Bitcoin (BTC/USDT) is currently trading around $108,644 following a modest decline of -1.48% on the daily chart. After a bullish recovery from the $92,000–$96,000 zone, BTC has approached a strong resistance band near $112,000. The current structure suggests the market is in a critical phase — either poised to break higher or risk a deeper retracement toward key demand levels.Key Technical Highlights:Price is trading above the 50 EMA (blue) and the 200 MA (red), suggesting a bullish short- to medium-term bias.The $112,000 zone is acting as a strong resistance, where BTC has previously faced rejections.The ascending yellow parallel channel outlines the broader uptrend structure — BTC remains well within bounds, showing potential for continuation.The Stochastic Oscillator is climbing, indicating building bullish momentum but nearing overbought territory, which could trigger short-term pullbacks.Immediate supports are found near $104,000 and $96,000. A failure to hold above $104,000 could trigger downside pressure.Trade Plan:✅ 1. Bullish Breakout (Long) – Most Probable ScenarioTrigger: Daily close above $112,000 with strong volume and momentumTarget: $122,000 - $125,000Stop Loss: Below $109,000⚠️ 2. Bearish Rejection (Short) – Possible ScenarioTrigger: Bearish reversal candle at $112,000 or daily close below $106,000Target: $102,000, then $92,000Stop Loss: Above $111,000📉 3. Dip Buy Setup – Last ScenarioTrigger: Price retests and holds $96,000 or $92,000 with a bullish reversal signal (e.g., pin bar, hammer)Target: Immediate resistance at $104,000, then $112,000Stop Loss: Below $91,000Risk Management:Always apply proper risk management, including clear stop-loss placement and responsible position sizing. Bitcoin can react aggressively to macroeconomic events and regulatory news — monitor sentiment closely when near major technical levels.📢 If you found this analysis valuable, kindly consider boosting and following for more updates.⚠️ Disclaimer: This content is intended for educational purposes only and does not constitute financial advice.
MarketsPOV
Bitcoin's Next 20% Move? My Plan Unveiled
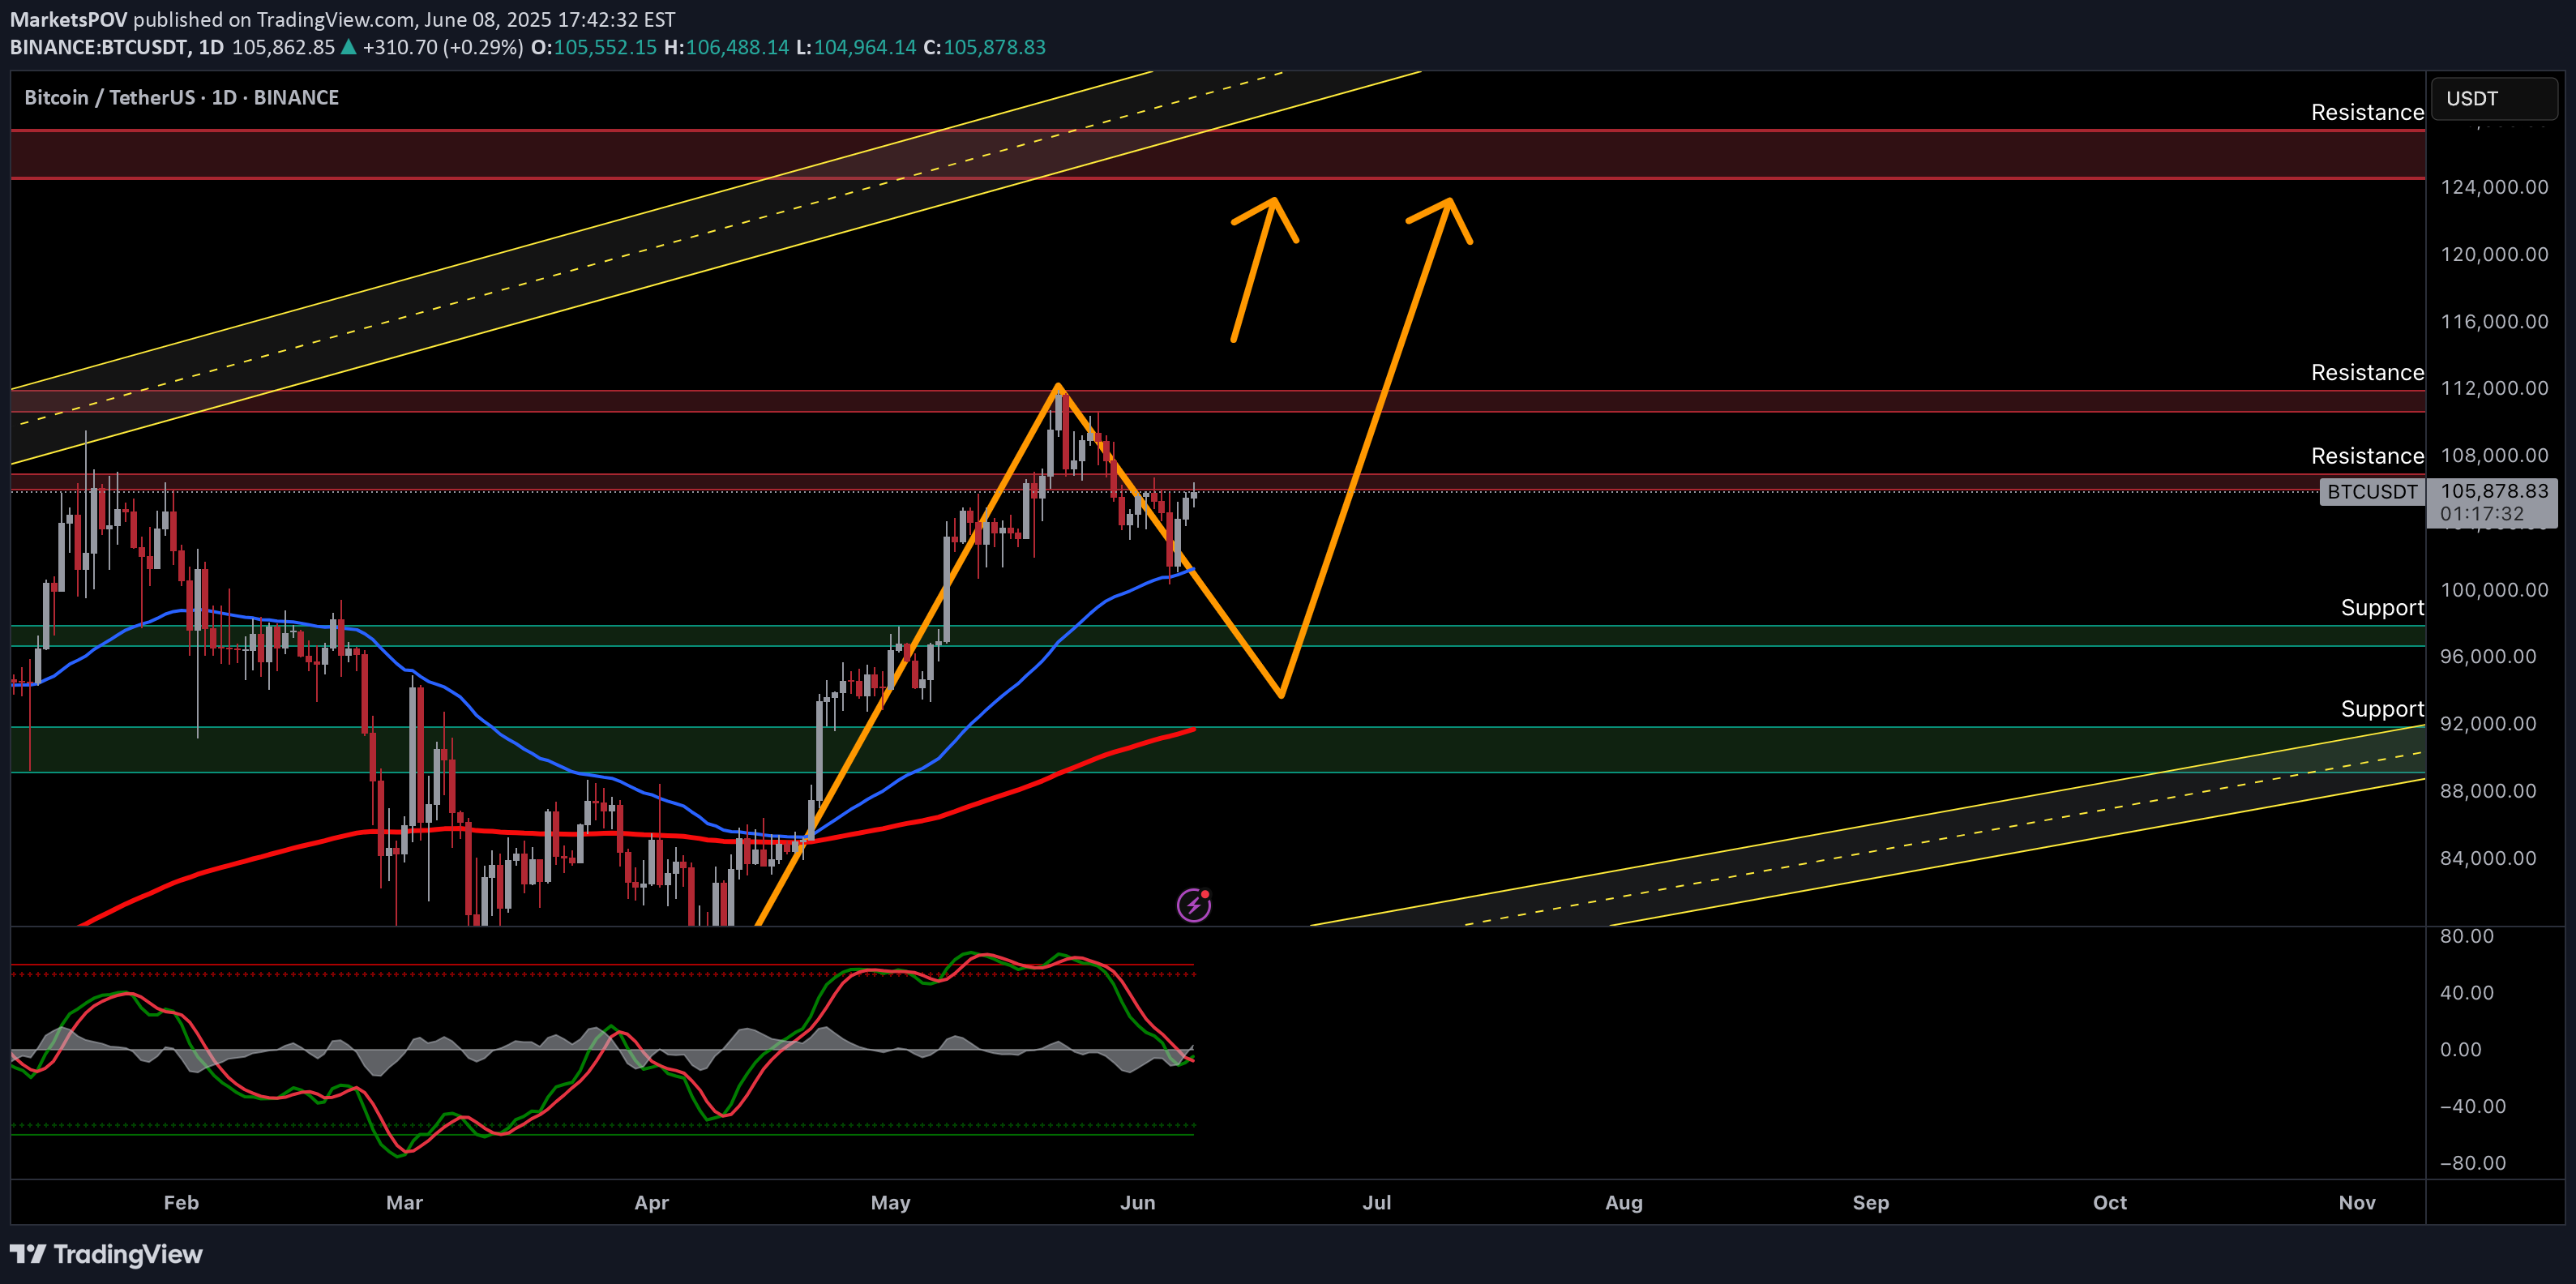
Bitcoin (BTC) - Navigating Key Levels & Potential PathsTechnical Outlook — 8 June, 20251. Current Market Context:Price Action: Bitcoin is currently trading around the $106,000 mark after a recent retracement from higher levels. We've seen a significant rally from the April lows, and the market is now consolidating.Key Levels: The chart highlights several important resistance and support zones that will likely dictate future price movements.2. Key Observations & Potential Scenarios:Resistance Levels:Immediate Resistance: ~$108,000 - $112,000. This zone has acted as resistance previously and is currently being tested.Next Major Resistance: ~$124,000 - $128,000. This is a crucial zone from previous highs and a potential target if the current resistance is overcome.Support Levels:Immediate Support: ~$96,000 - $100,000. This zone aligns with previous price consolidation and is the first line of defense if the price drops.Strong Support: ~$92,000 - $88,000. This area previously acted as significant support and could be a strong bounce zone.Lower Support/Trendline: ~$76,000 - $80,000. This aligns with the lower boundary of the broader ascending channel/trendline.Highlighted Paths (Orange Arrows): The chart suggests two potential paths:Scenario A (Bullish Continuation): A break above the $108,000-$112,000 resistance, leading to a push towards $124,000-$128,000. This would likely follow a slight dip or consolidation before the breakout.Scenario B (Retracement & Bounce): A deeper retracement towards the $96,000-$100,000 or even $92,000-$88,000 support zones, followed by a bounce and subsequent rally towards the higher resistance levels. This scenario aligns with the idea of a healthy correction before further upward movement.3. Trading Plan:A. Bullish Entry (Aggressive / Confirmation Trade):Trigger: Clear daily candle close above the $112,000 resistance level with strong volume.Entry: Upon confirmation of the breakout.Target 1: $124,000Target 2: $128,000Stop Loss: Below the newly formed support level (e.g., $105,000 - $107,000, depending on the breakout structure).B. Long Entry (Dip Buy / Value Trade):Trigger: Price retests and holds either the $96,000 - $100,000 support zone or the $92,000 - $88,000 support zone. Look for bullish reversal candlesticks (e.g., hammer, bullish engulfing) on the daily timeframe.Entry: Upon confirmation of support holding and a bullish reversal signal.Target 1: $108,000Target 2: $112,000Target 3: $124,000 - $128,000 (if momentum continues).Stop Loss: Just below the tested support zone (e.g., $95,000 for the first support, or $87,000 for the second support).C. Bearish Outlook (Short-Term / Risk Management):Trigger: A clear daily candle close below the $88,000 support level, invalidating the current bullish structure.Action: Consider exiting long positions or being prepared for further downside towards the $76,000 - $80,000 level. This would suggest a breakdown of the overall uptrend.4. Risk Management:Position Sizing: Only risk a small percentage of your trading capital on any single trade (e.g., 1-2%).Stop Loss: Always use a stop loss to limit potential losses.Profit Taking: Consider taking partial profits at target levels to secure gains.Market Volatility: Bitcoin is highly volatile. Be prepared for rapid price movements.5. Additional Considerations:Volume: Always pay attention to trading volume. Strong volume on breakouts confirms the move, while weak volume may suggest a false breakout.If you found this analysis valuable, kindly consider boosting and following for more updates.Disclaimer: This content is intended for educational purposes only and does not constitute financial advice.
MarketsPOV
BTCUSDT Weekly Analysis — Potential Reversal or Trend Continuati

📊 BTCUSDT Weekly AnalysisTechnical Outlook — April 21, 2025🔍 Current Market Condition:Bitcoin is trading within a long-term ascending channel on the weekly timeframe. Price is approaching a crucial decision zone around $87,000–$90,000, marked by previous resistance and mid-channel structure.🧩 Key Technical Highlights:Price is retesting midline of the ascending channel.Stochastic shows potential bullish cross from the oversold area.Multiple resistance zones ahead: $90K, $100K, and $110K.Support below at $80K and $70K levels.Structure suggests potential for a bounce or a deeper correction.📈 Possible Scenarios:Bullish:If BTC breaks and holds above $90,000, we may see a continuation towards $100K and $110K.A bullish Stochastic cross would strengthen this case.Bearish:Failure to break $90,000 and a rejection from resistance could send BTC back toward $80K or even $70K.Watch for bearish divergence or weakness in momentum indicators.📌 Important Note:BTC is at a pivotal zone; traders should monitor macroeconomic news and market sentiment closely, especially with halving hype potentially priced in.If you found this analysis valuable, kindly consider boosting and following for more updates.Disclaimer: This content is intended for educational purposes only and does not constitute financial advice.
MarketsPOV
BTC/USDT Daily: Potential Short Opportunities Within Channel

BTC/USDT Daily AnalysisTechnical Outlook — 10 April 2025Current Market Condition:BTC/USDT is currently trading within a descending channel on the daily timeframe, respecting the upper and lower trendlines. Price recently encountered resistance near the upper channel trendline and is showing signs of potential bearish continuation.Key Technical Highlights:Price action confined within a well-defined descending channel.Recent rejection from the upper trendline of the descending channel, indicating continued bearish pressure.Trading below the 50-day and 200-day Exponential Moving Averages (EMAs), reinforcing the bearish sentiment on the daily timeframe.Key Resistance level identified near the upper channel trendline (around $88,000 - $90,000).Key Support zone identified near the lower channel trendline (around $68,000 - $70,000) and a further potential support zone around $54,000 - $56,000.Momentum oscillator showing bearish momentum or a potential bearish crossover.Possible Scenarios:Bearish Scenario (High Probability):If price continues to respect the descending channel and remains below the upper trendline, expect bearish continuation towards the lower channel trendline in the $68,000 - $70,000 zone.A confirmed break below the middle of the channel (around $78,000 - $80,000) could accelerate the move towards the lower support.Confluence of the descending channel resistance and the EMAs adds to the potential selling pressure.Bullish Scenario (Invalidation Level):A strong break and sustained trading above the upper trendline of the descending channel (around $90,000) would invalidate the bearish channel structure and could lead to a potential move towards the $100,000 resistance level.Bullish reversal signals forming near the middle or lower trendline of the channel could also present short-term long opportunities, but these would be counter-trend within the larger bearish structure.Important Note:Monitor Bitcoin-related news and market sentiment, which can significantly impact price action.Wait for clear candle confirmations at the channel trendlines or key support/resistance levels before entering trades.Employ appropriate risk management, including setting stop-loss orders to protect your capital.If you found this analysis valuable, kindly consider boosting and following for more updates.Disclaimer: This content is intended for educational purposes only and does not constitute financial advice.
MarketsPOV
Bitcoin - Are We Heading for A Deeper Correction?

Bitcoin has been on a Bull Run for past few months due to Trump and anticipation of Crypto-friendly policies however it seems the impulse waves have came to an end and we are in correction zone. If the support zones don't hold, this can lead to substantial downfall which could take price below $50k. Best option is to trade with small lots and near strong support/resistance levels.If you are a sport trader, you can set limit orders for accumulations.If you found this analysis valuable, kindly consider boosting and following for more updates.Disclaimer: This content is intended for educational purposes only and does not constitute financial advice.
MarketsPOV
BITCOIN - Bullish Wave 3 in Play

Bitcoin has retraced and remained supported by the fib 61.8% level and as far the below support holds, we should see a continuation of bullish wave 3 to above levels. Best approach is to go from level to level rather than aiming for a swing move as sentiments can switch anytime.For entries, please wait for at least two candle reversals at the specified level and apply appropriate risk management.If you found this analysis helpful, please consider boosting and following for more updates.Disclaimer: This content is for educational purposes only and should not be considered financial advice.
MarketsPOV
ETHEREUM - Potential Scenarios

Ether has been showing Bearish signs after a Bullish Exhaustion however it seems to now have held support well. We can see double bottom on H1 and this could close any potential lower moves and open above levels.MACD is nearing a Bull cross so this should confirm the Bullish move. Best approach is to go from level to level rather than aiming for a swing move as sentiments can switch anytime.For entries, please wait for at least two candle reversals at the specified level and apply appropriate risk management.If you found this analysis helpful, please consider boosting and following for more updates.Disclaimer: This content is for educational purposes only and should not be considered financial advice.
MarketsPOV
BITCOIN - Potential Correction Ahead

Bitcoin has been on Bull run for past few weeks and has tapped the ATH level. In order for the move to continue, it requires correction and as far as the above resistance holds, we should see a correction that can go as deep as 70k mark. Therefore please be mindful of potential drop. For entries, please wait for at least two candle reversals at the specified level and apply appropriate risk management.If you found this analysis helpful, please consider boosting and following for more updates.Disclaimer: This content is for educational purposes only and should not be considered financial advice.
MarketsPOV
ETHER - Double Top Points For A Correction

Ether has a double top on 4H and unless the above resistance is broken, we should see an overdue correction. For entries, please wait for at least two candle reversals at the specified level and apply appropriate risk management.If you found this analysis helpful, please consider boosting and following for more updates.Disclaimer: This content is for educational purposes only and should not be considered financial advice.
Disclaimer
Any content and materials included in Sahmeto's website and official communication channels are a compilation of personal opinions and analyses and are not binding. They do not constitute any recommendation for buying, selling, entering or exiting the stock market and cryptocurrency market. Also, all news and analyses included in the website and channels are merely republished information from official and unofficial domestic and foreign sources, and it is obvious that users of the said content are responsible for following up and ensuring the authenticity and accuracy of the materials. Therefore, while disclaiming responsibility, it is declared that the responsibility for any decision-making, action, and potential profit and loss in the capital market and cryptocurrency market lies with the trader.