Technical analysis by MarketsPOV about Symbol BTC: Buy recommendation (6/8/2025)

MarketsPOV
Bitcoin's Next 20% Move? My Plan Unveiled
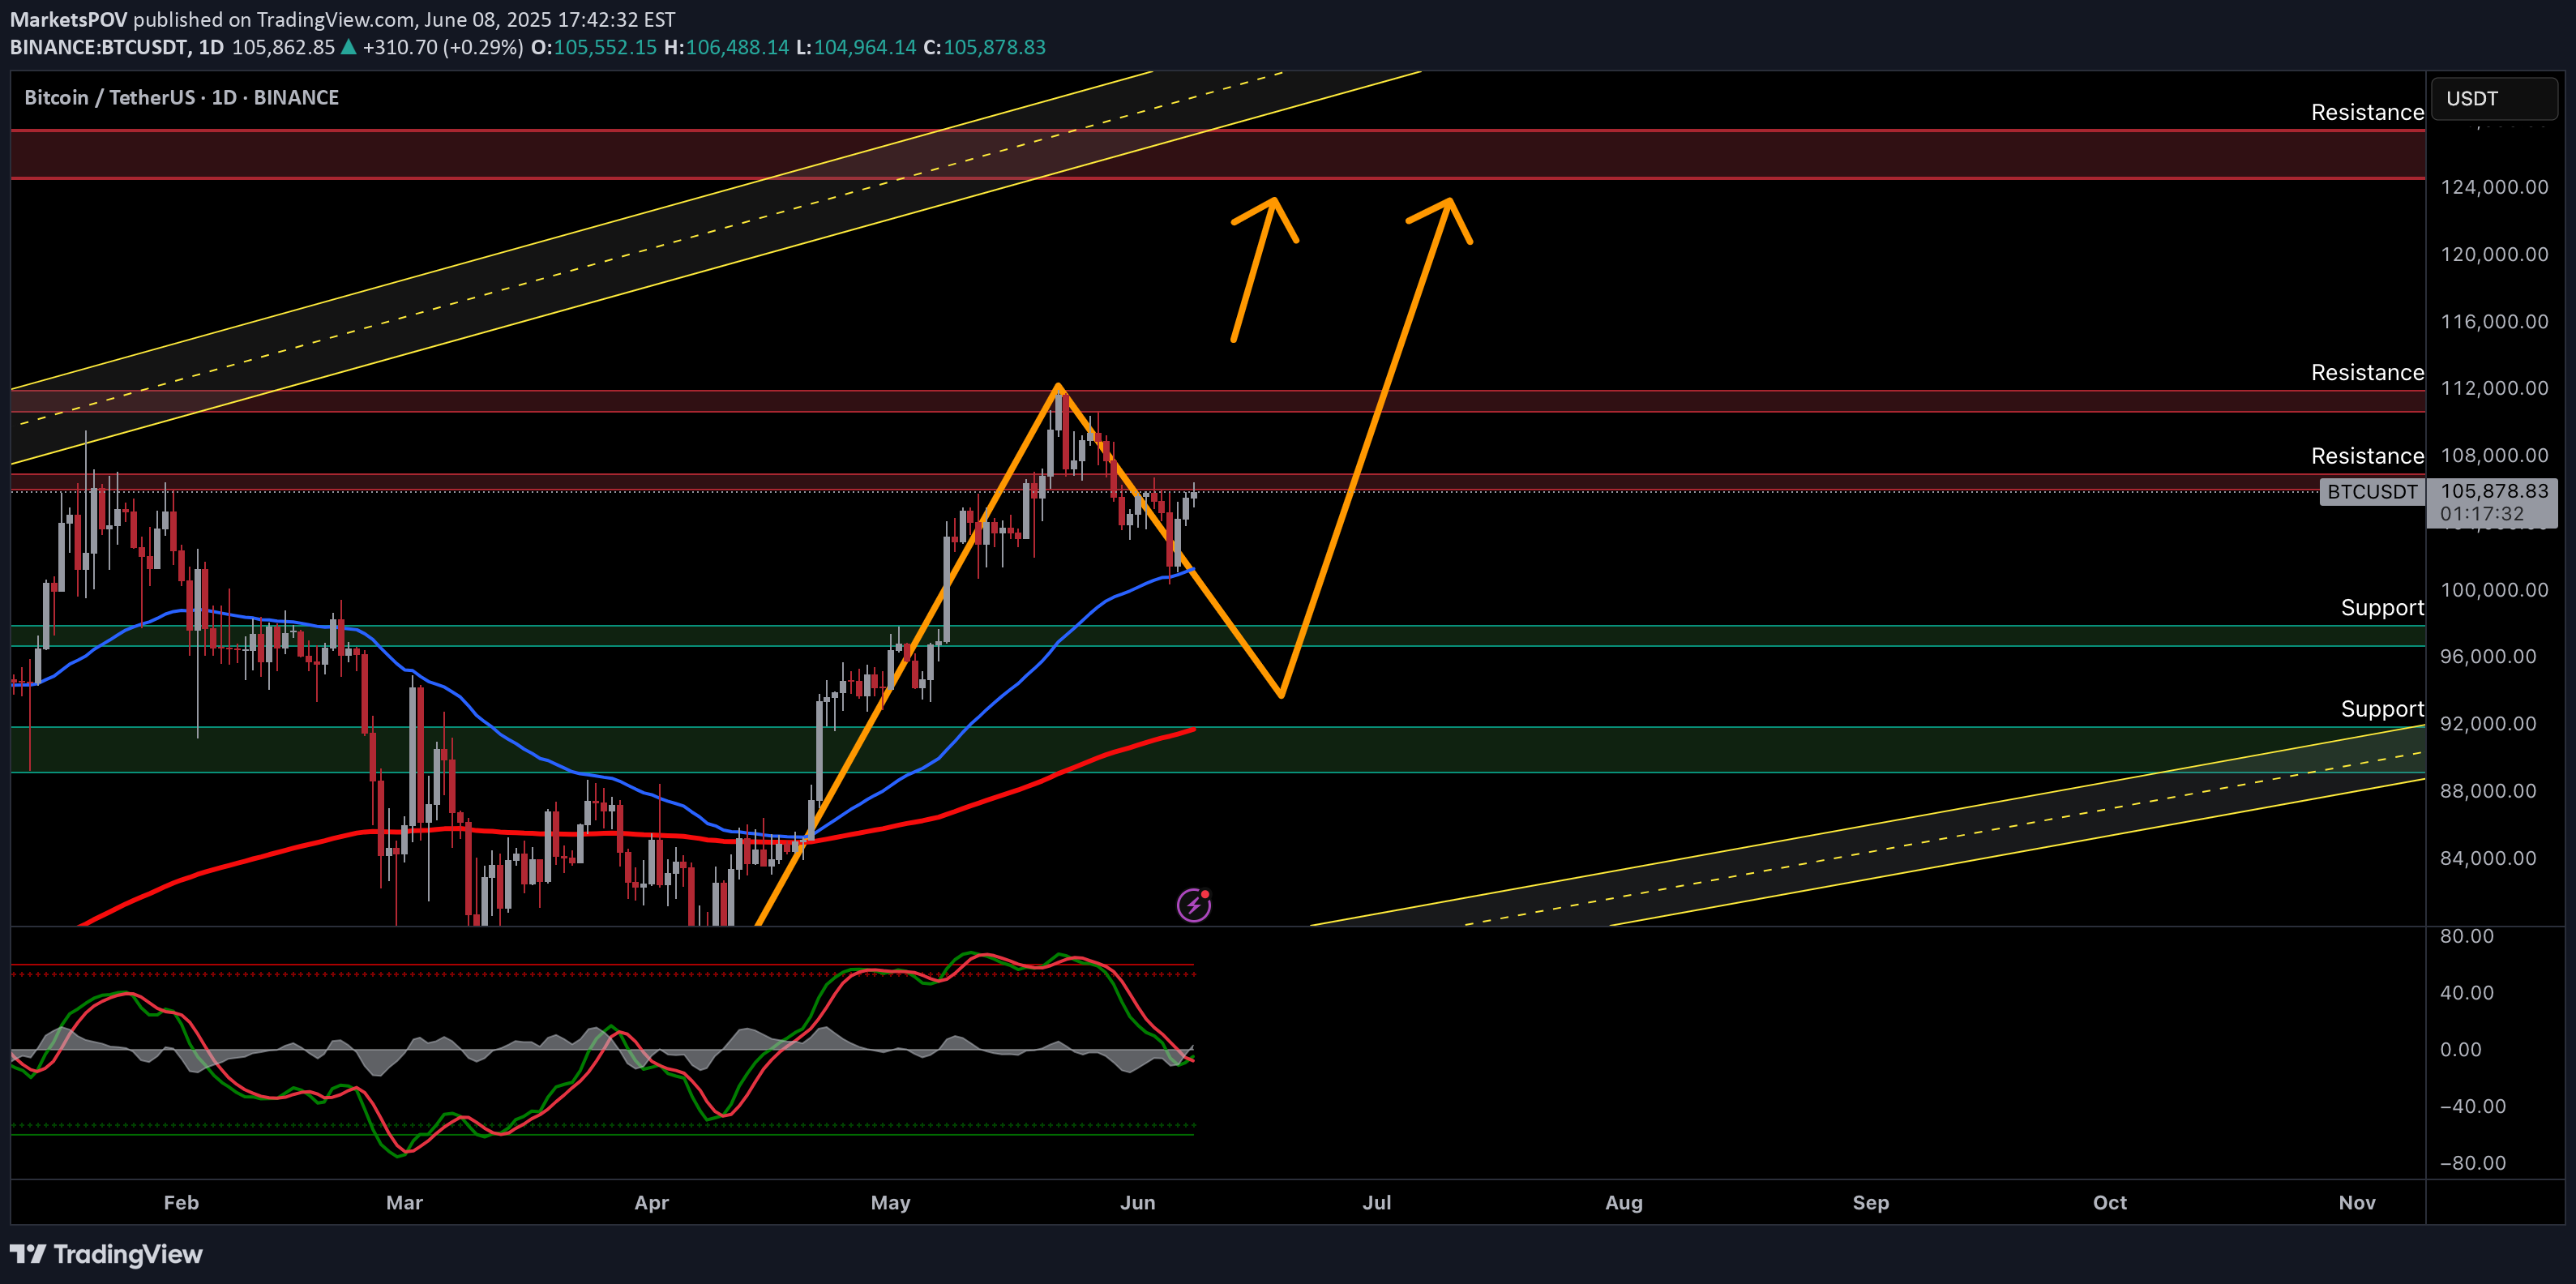
Bitcoin (BTC) - Navigating Key Levels & Potential PathsTechnical Outlook — 8 June, 20251. Current Market Context:Price Action: Bitcoin is currently trading around the $106,000 mark after a recent retracement from higher levels. We've seen a significant rally from the April lows, and the market is now consolidating.Key Levels: The chart highlights several important resistance and support zones that will likely dictate future price movements.2. Key Observations & Potential Scenarios:Resistance Levels:Immediate Resistance: ~$108,000 - $112,000. This zone has acted as resistance previously and is currently being tested.Next Major Resistance: ~$124,000 - $128,000. This is a crucial zone from previous highs and a potential target if the current resistance is overcome.Support Levels:Immediate Support: ~$96,000 - $100,000. This zone aligns with previous price consolidation and is the first line of defense if the price drops.Strong Support: ~$92,000 - $88,000. This area previously acted as significant support and could be a strong bounce zone.Lower Support/Trendline: ~$76,000 - $80,000. This aligns with the lower boundary of the broader ascending channel/trendline.Highlighted Paths (Orange Arrows): The chart suggests two potential paths:Scenario A (Bullish Continuation): A break above the $108,000-$112,000 resistance, leading to a push towards $124,000-$128,000. This would likely follow a slight dip or consolidation before the breakout.Scenario B (Retracement & Bounce): A deeper retracement towards the $96,000-$100,000 or even $92,000-$88,000 support zones, followed by a bounce and subsequent rally towards the higher resistance levels. This scenario aligns with the idea of a healthy correction before further upward movement.3. Trading Plan:A. Bullish Entry (Aggressive / Confirmation Trade):Trigger: Clear daily candle close above the $112,000 resistance level with strong volume.Entry: Upon confirmation of the breakout.Target 1: $124,000Target 2: $128,000Stop Loss: Below the newly formed support level (e.g., $105,000 - $107,000, depending on the breakout structure).B. Long Entry (Dip Buy / Value Trade):Trigger: Price retests and holds either the $96,000 - $100,000 support zone or the $92,000 - $88,000 support zone. Look for bullish reversal candlesticks (e.g., hammer, bullish engulfing) on the daily timeframe.Entry: Upon confirmation of support holding and a bullish reversal signal.Target 1: $108,000Target 2: $112,000Target 3: $124,000 - $128,000 (if momentum continues).Stop Loss: Just below the tested support zone (e.g., $95,000 for the first support, or $87,000 for the second support).C. Bearish Outlook (Short-Term / Risk Management):Trigger: A clear daily candle close below the $88,000 support level, invalidating the current bullish structure.Action: Consider exiting long positions or being prepared for further downside towards the $76,000 - $80,000 level. This would suggest a breakdown of the overall uptrend.4. Risk Management:Position Sizing: Only risk a small percentage of your trading capital on any single trade (e.g., 1-2%).Stop Loss: Always use a stop loss to limit potential losses.Profit Taking: Consider taking partial profits at target levels to secure gains.Market Volatility: Bitcoin is highly volatile. Be prepared for rapid price movements.5. Additional Considerations:Volume: Always pay attention to trading volume. Strong volume on breakouts confirms the move, while weak volume may suggest a false breakout.If you found this analysis valuable, kindly consider boosting and following for more updates.Disclaimer: This content is intended for educational purposes only and does not constitute financial advice.