
M_Gheysvandi
@t_M_Gheysvandi

What symbols does the trader recommend buying?
Purchase History
پیام های تریدر
Filter
M_Gheysvandi
تحلیل موج الیوت طلا: راز افزایش قیمت تا 4370 دلار چیست؟
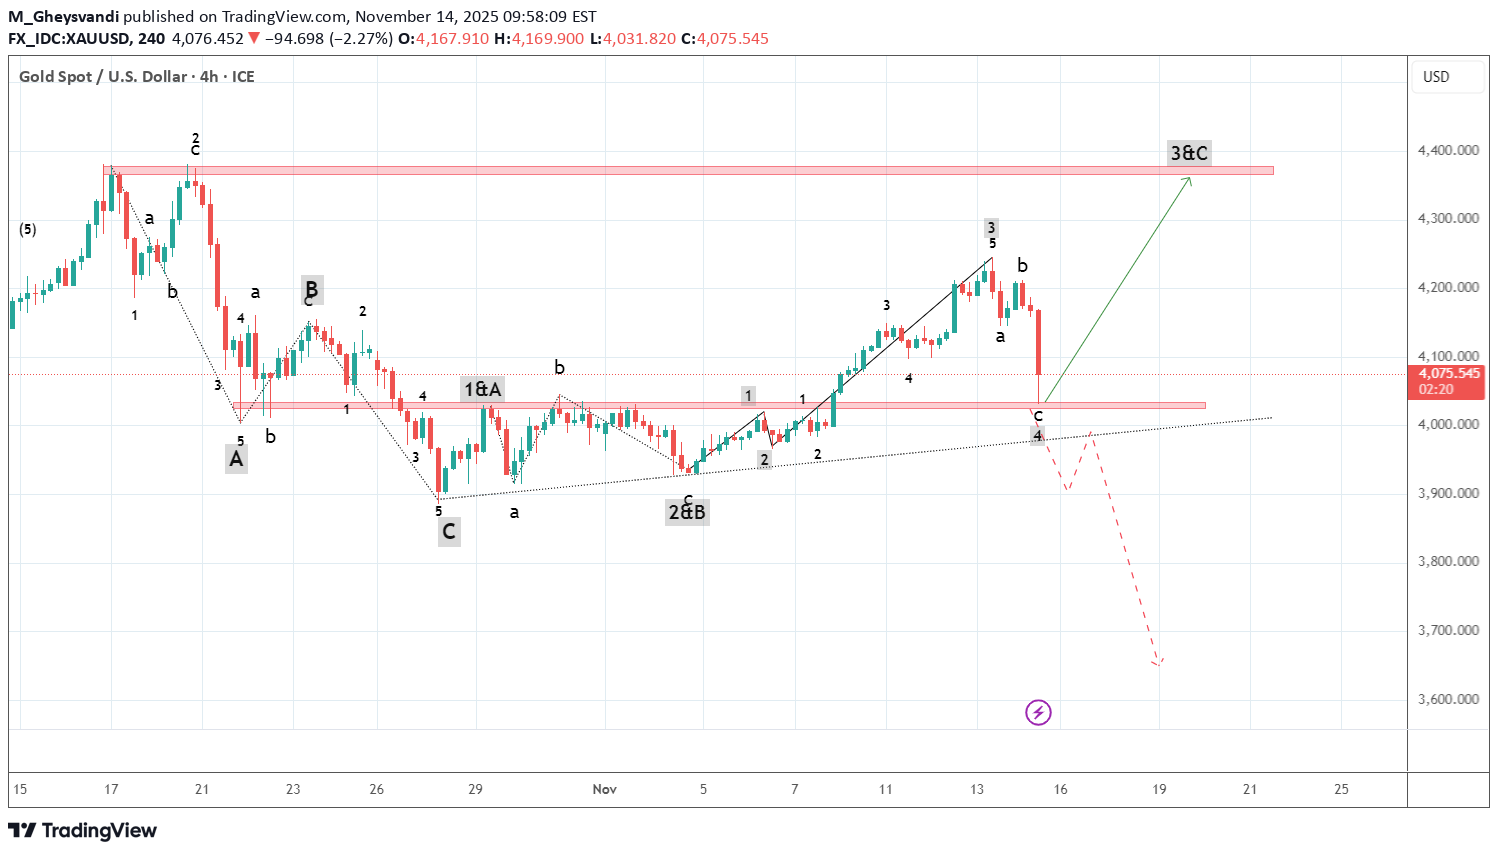
Hello friends We are witnessing the formation of a complete Elliott wave pattern in the gold chart (XAU/USD). A bearish wave has formed in the ABC pattern and then an upward correction in the form of ABC is forming. Of course, this correction could be the beginning of a 5-wave uptrend. But wave 3 or C has not yet been completed, so we expect the price to grow to the $4370 range. Good luck and be profitable.
M_Gheysvandi
BTCUSD Elliott Wave

Hello friends We are witnessing the formation of a complete Elliott wave pattern on the BTC USD chart. These waves from 1 to 5 are quite clear and you can even count their sub-waves. Now wave 5 is complete and a downward wave has formed in the form of a zigzag. At the moment our theory is a zigzag, because a 5-wave may also form in the form of a correction. Waves 1 or A and 2 or B are fully formed and we are currently in wave 3 or C. So the price of Bitcoin should fall to the $100,000 range, which is also a psychological support. Good luck and be profitable.Good luck and be profitable.
M_Gheysvandi
Ripple Elliott Wave
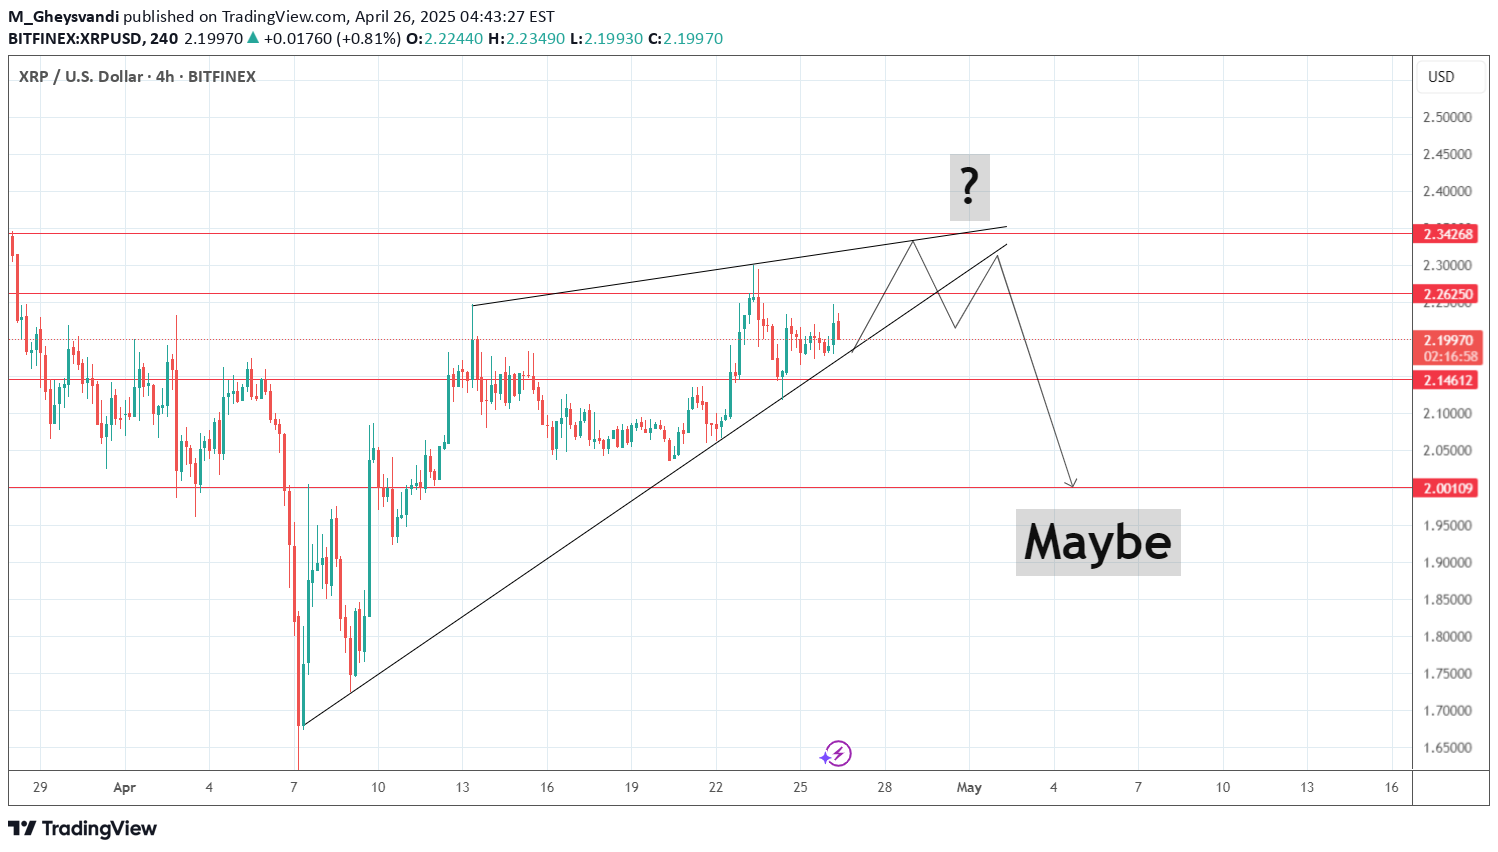
Triangle Break of the ascending trendline at the bottom of the triangle Pullback Price drop? Ripple No patience No time
M_Gheysvandi
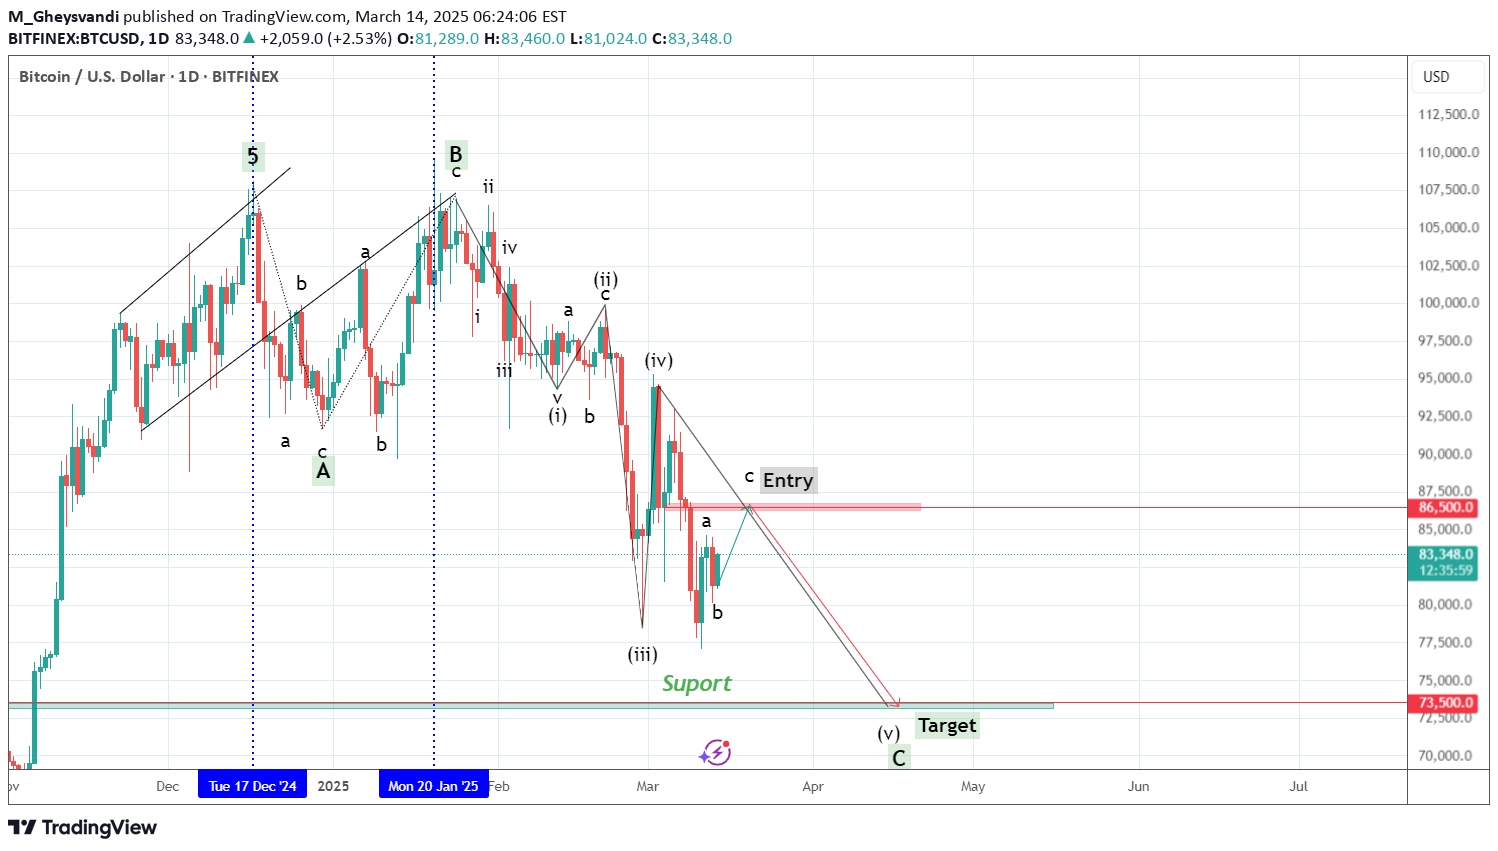
Bitcoin Elliott Wave Analysis
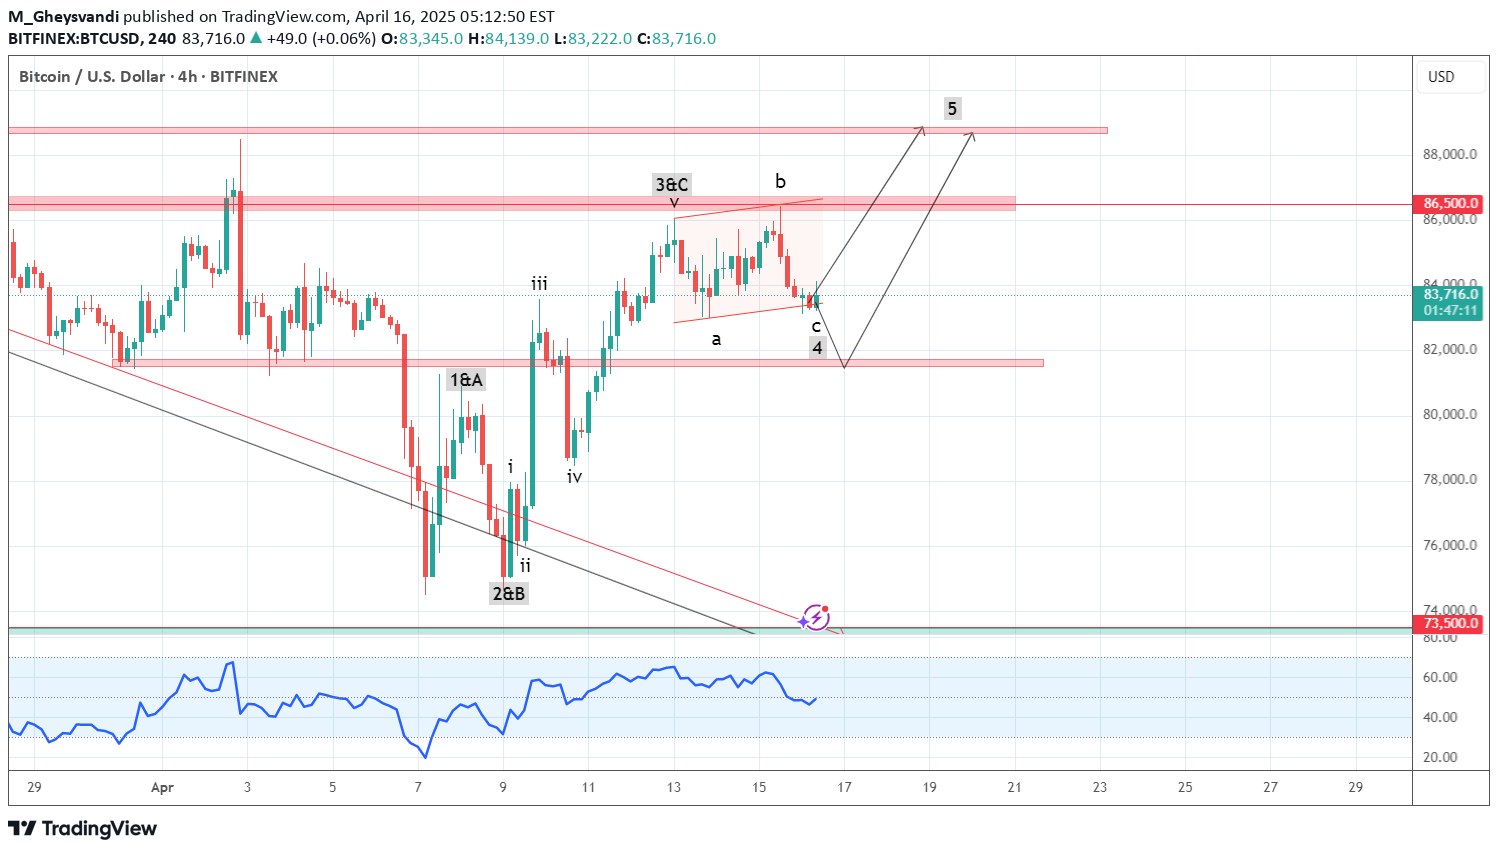
Hello friends On the Bitcoin chart, we see the formation of a complete Elliott wave pattern. These waves from 1 to 3 or C are quite clear and we can even count its sub-waves. Now a 3-wave ABC has formed. We cannot be exactly sure that this is a complete zigzag because wave C can be extended and the price will fall further. But we consider it wave 4 assuming that this zigzag is completed. So we will wait for the formation of an upward wave in the form of wave 5. The target is first $86,500 and then $88,000. Good luck and be profitable.Good luck and be profitable.
M_Gheysvandi
Gold Elliott Analysis
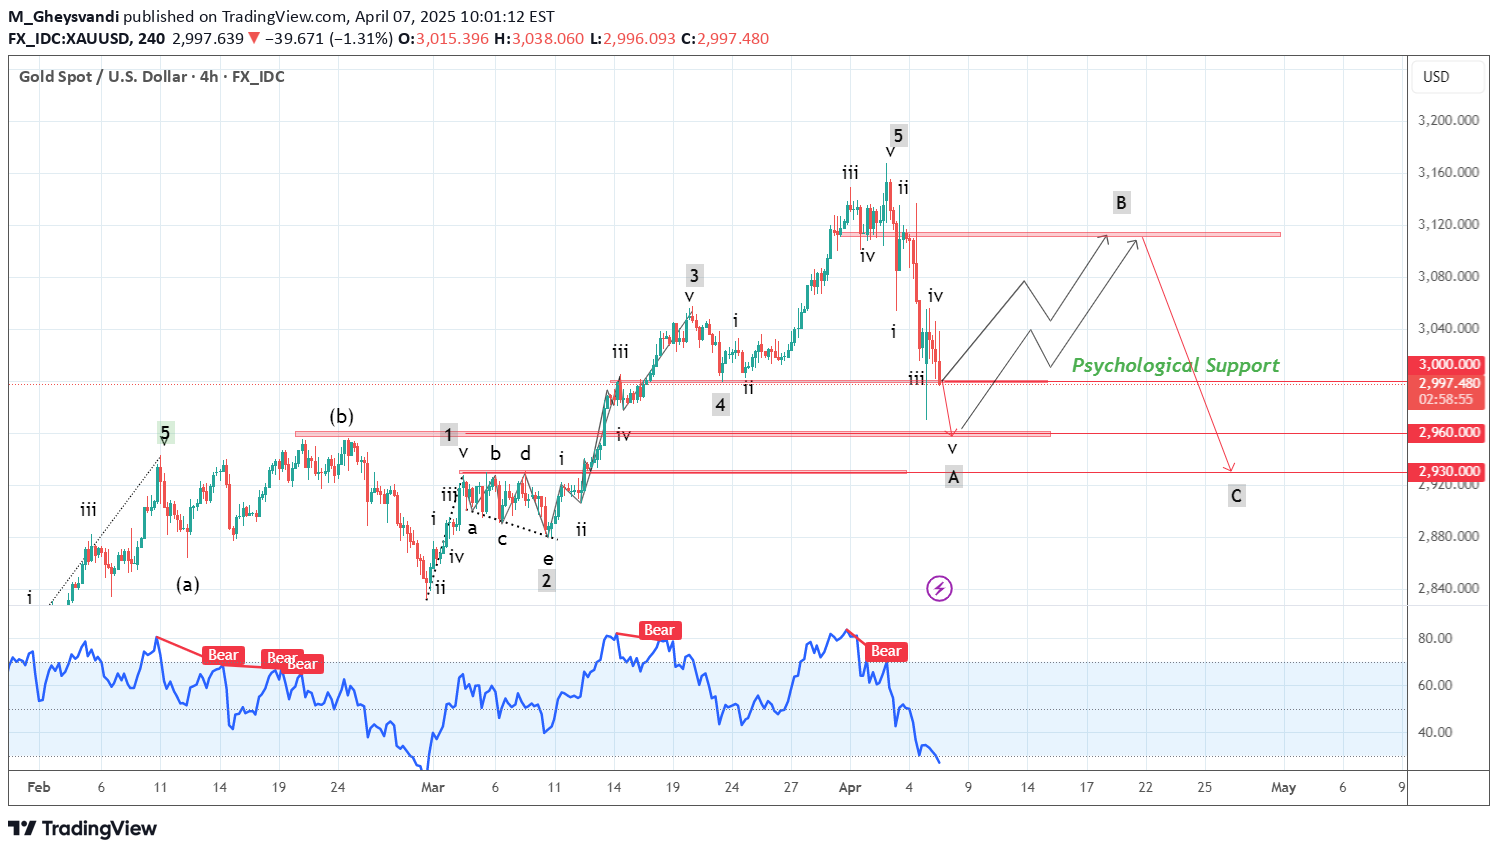
Hello friends As predicted, we expected a 5-wave formation, which happened, and with the formation of a divergence between waves 3 and 5, the price of gold fell. Now a small wave with 5 parts has formed, which could be wave A of a zigzag. We expect the price to grow by 61.8% of the decline that occurred in the main wave B. Now, considering the psychological support of $3,000, this price reversal may happen right now or it may fall to the $2,960 range and then the price will grow. In general, we will have a growth in the main wave B and then another sharp decline in the main wave C. Meanwhile, the RSI indicator has also reached the oversold limit. Good luck and be profitable.Good luck and be profitable.
M_Gheysvandi
Gold Elliott Analysis
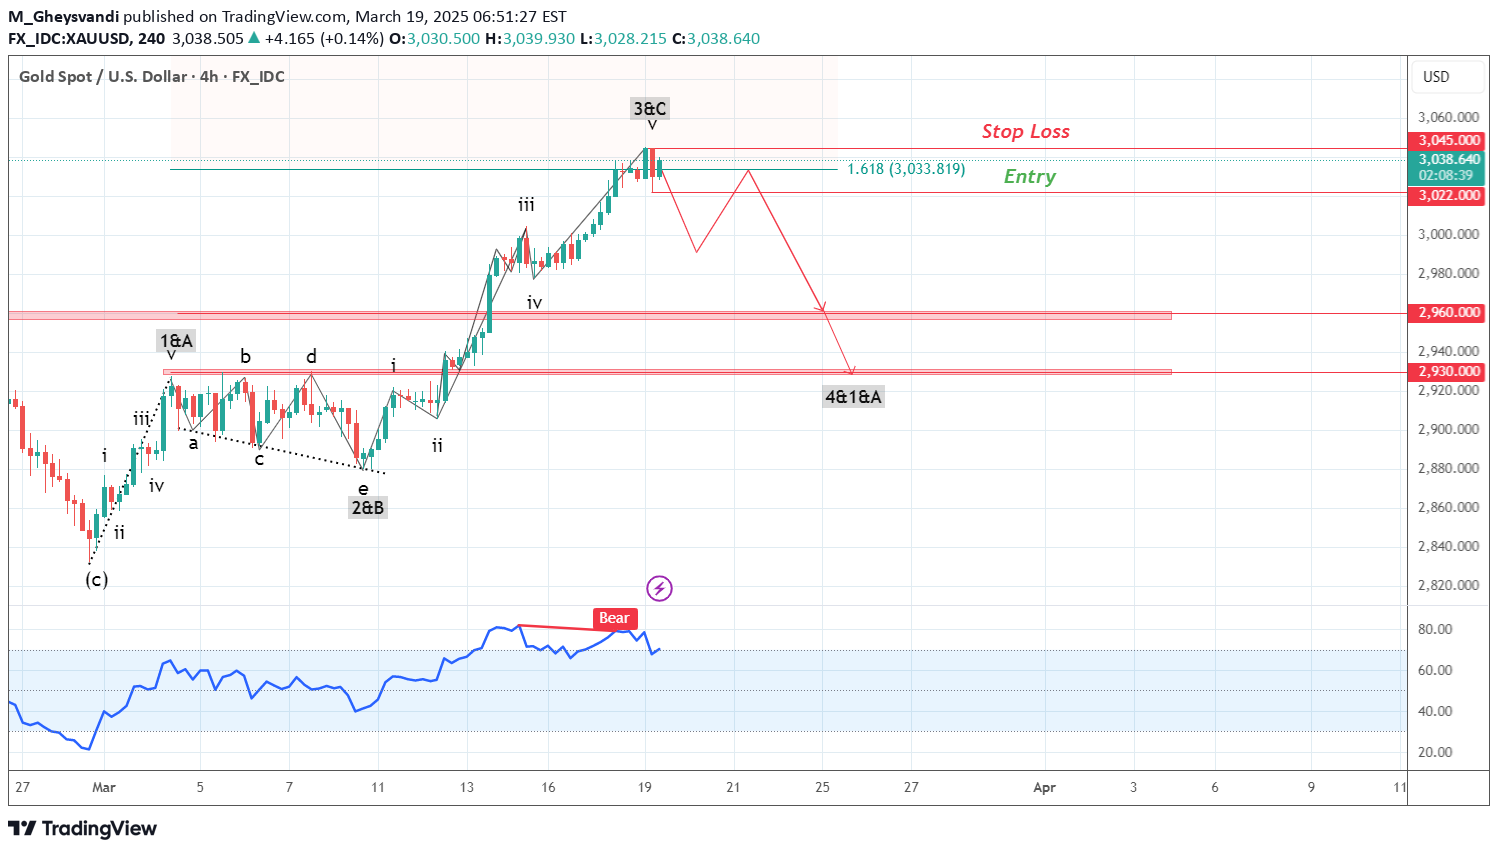
Hello friends On the gold price chart, we are witnessing the formation of an Elliott wave pattern. In this pattern, we can clearly count 3 waves. Wave 1 or A has 5 microwaves, wave 2 or B is an opening triangle, and wave 3 or C also has 5 microwaves. Between microwaves 3 and 5 of wave 3 or C, we also see a negative divergence, which is a reason for our correct counting. But what is going to happen after that? We expect a price correction in the form of a zigzag or anything other than an opening triangle. This correction will reach the $2,960 range and the next target will be $2,930. The probability of the price continuing to rise after this correction is very high. You can enter a sell trade by breaking the price range of 3022 with a stop loss of 3046. Be successful and profitable.
M_Gheysvandi
BTC USD Elliott Wave Analysis
Hello friends Especially those who are new members (welcome) In the digital currency Bitcoin, after a sharp rise and the formation of a range zone, we saw a drop in the price of Bitcoin. Today we want to check whether this drop continues or not? If the answer is yes! How far? We see a corrective pattern on the daily timeframe. This pattern is flat with a long wave C. The structure of this pattern is 3-3-5. Wave C is 5 waves. Now we are in wave 5 and we are waiting for a slight increase in the price to the $ 86,500 area and then the price will drop to the $ 73,500 area. This area is a static support and we expect a reaction at this price. Good luck and be profitable.Good luck and be profitable.
M_Gheysvandi
Gold Elliott Wave Analysis
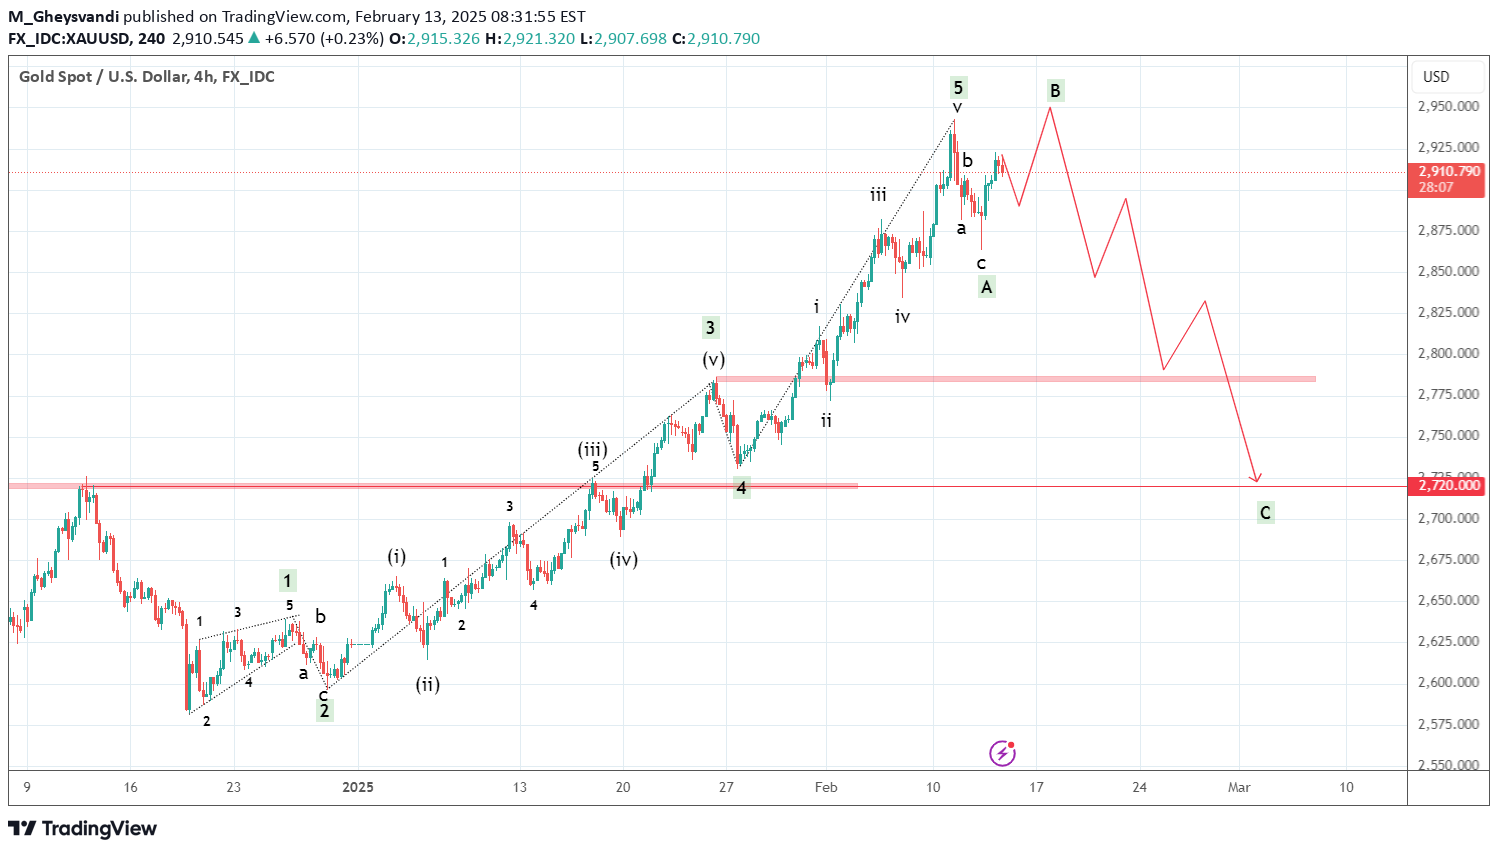
Hello friends, We are witnessing a 5-wave impulse pattern on the gold chart. Waves 1 to 5 have been completed and a zigzag of the subsequent waves has also been completed. Now we need to check what will happen. Usually, after each Sharpe growth, a deep correction will also occur. All the 5 main waves have been identified and have occurred, and I would expect a correction. Given that a zigzag wave has occurred in the correction, we can expect a triangle or most likely an Expanded Flat. An Expanded Flat has a 3_3_5 structure, with wave C extending and growing to 161.8 times the length of wave A. This structure consists of 2 zigzags in the majority of waves A and B, a 5-wave in the majority of wave C. If the bottom formed by wave A is broken, a sell trade can be entered. The price target is the range of $2,750 and then $2,720. Be successful and profitable.
M_Gheysvandi
ETH Elliott Wave Analysis
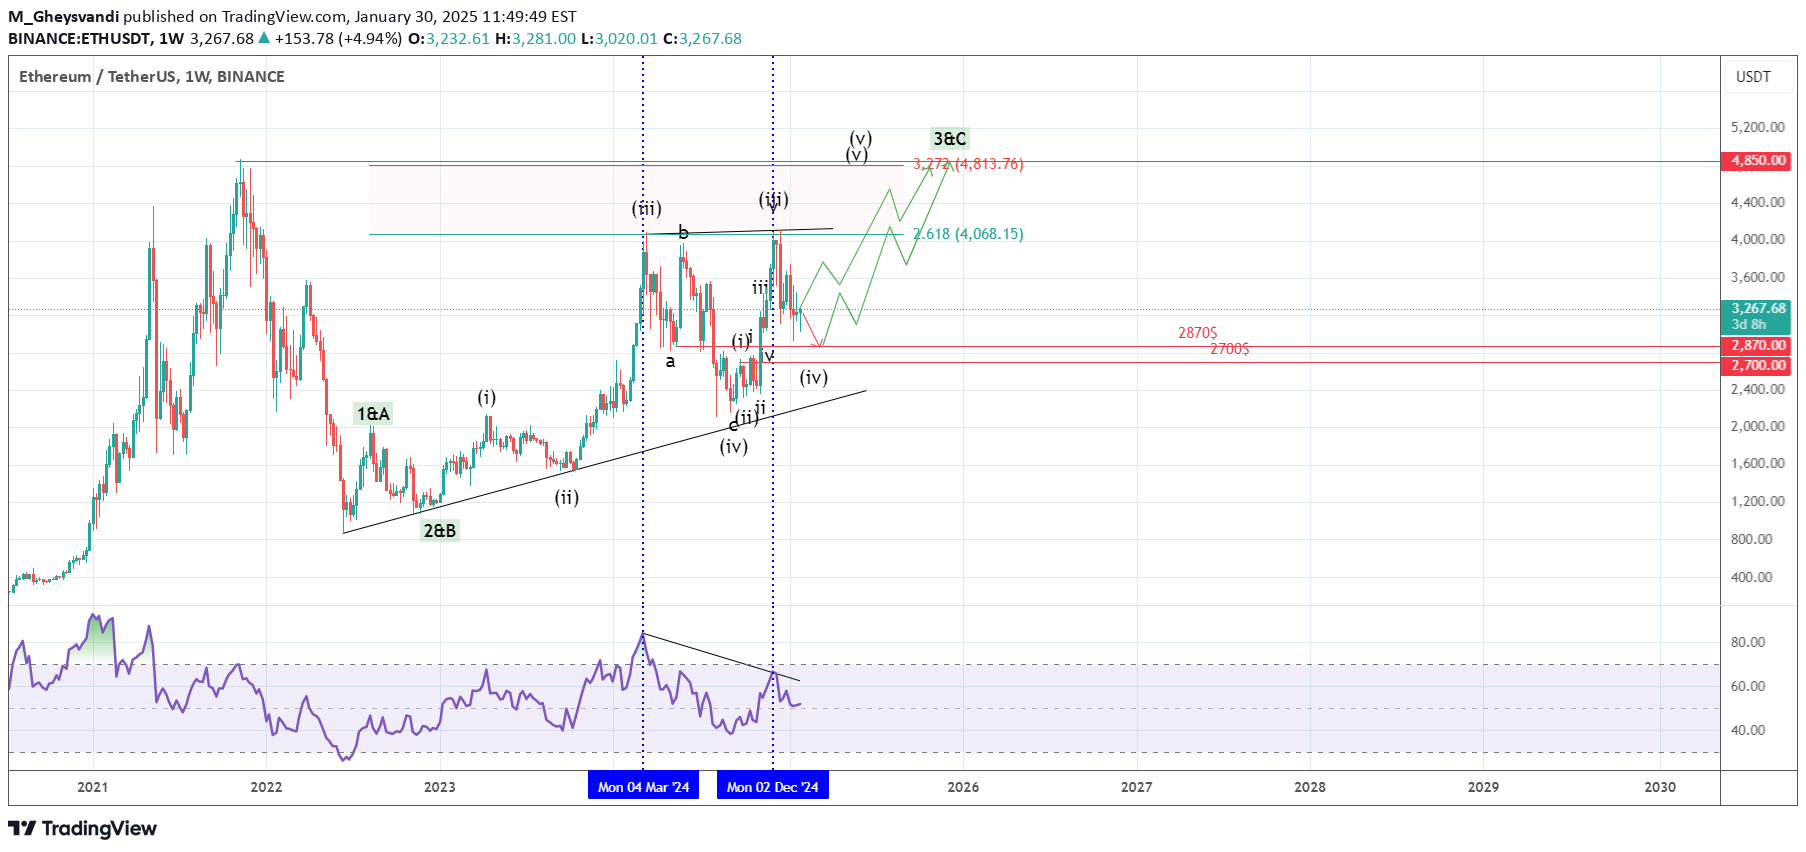
Hello friends We are witnessing the formation of a bullish pattern on the Ethereum chart and we expect the Ethereum price to grow. Now if we look at the chart, we see that the formed microwaves indicate an upward trend and this trend can be formed in the form of 5 impulse waves or ABC zigzags. But we are in wave 3 or C and we expect the price to grow until its microwaves are completed. But the appropriate range for entry is the $2770-2780 range, because in addition to a strong support, the price cannot close in the closing range of wave 1. Therefore, the best entry price is this range but it can also grow from this price. This depends on your capital management and risk tolerance. This is a weekly analysis and it will take 8 to 12 weeks to achieve it. The first target price is $4,850. Be successful and profitable.
M_Gheysvandi
Gold Elliott Wave Analysis
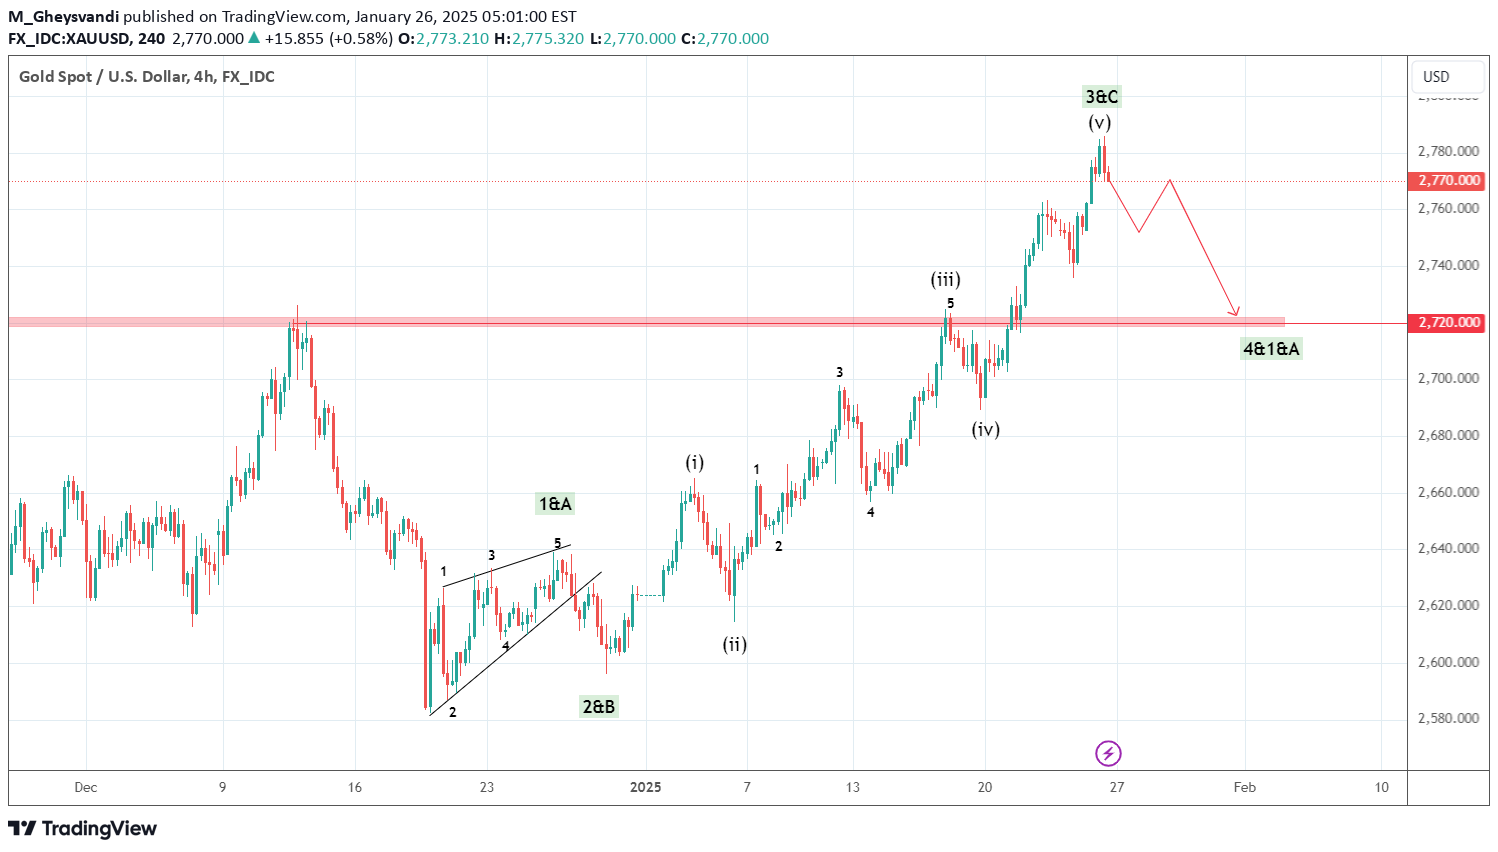
Hello friends We witnessed the formation of a 5-wave bullish pattern on the gold chart and our expectation was for the gold price to grow, which was realized (refer to the previous analysis). Now all the microwaves up to the main wave 3 or C have been completed and we expect a price correction to the $2,720 range. After this correction, the growth or continuation of the price correction depends on the type of wave formed and the global and economic conditions. But in any case, our strategy for now is to correct the price and take a sell trade to the $2,720 range. Be successful and profitable.
Disclaimer
Any content and materials included in Sahmeto's website and official communication channels are a compilation of personal opinions and analyses and are not binding. They do not constitute any recommendation for buying, selling, entering or exiting the stock market and cryptocurrency market. Also, all news and analyses included in the website and channels are merely republished information from official and unofficial domestic and foreign sources, and it is obvious that users of the said content are responsible for following up and ensuring the authenticity and accuracy of the materials. Therefore, while disclaiming responsibility, it is declared that the responsibility for any decision-making, action, and potential profit and loss in the capital market and cryptocurrency market lies with the trader.