Technical analysis by M_Gheysvandi about Symbol PAXG: Sell recommendation (3/19/2025)

Gold Elliott Analysis
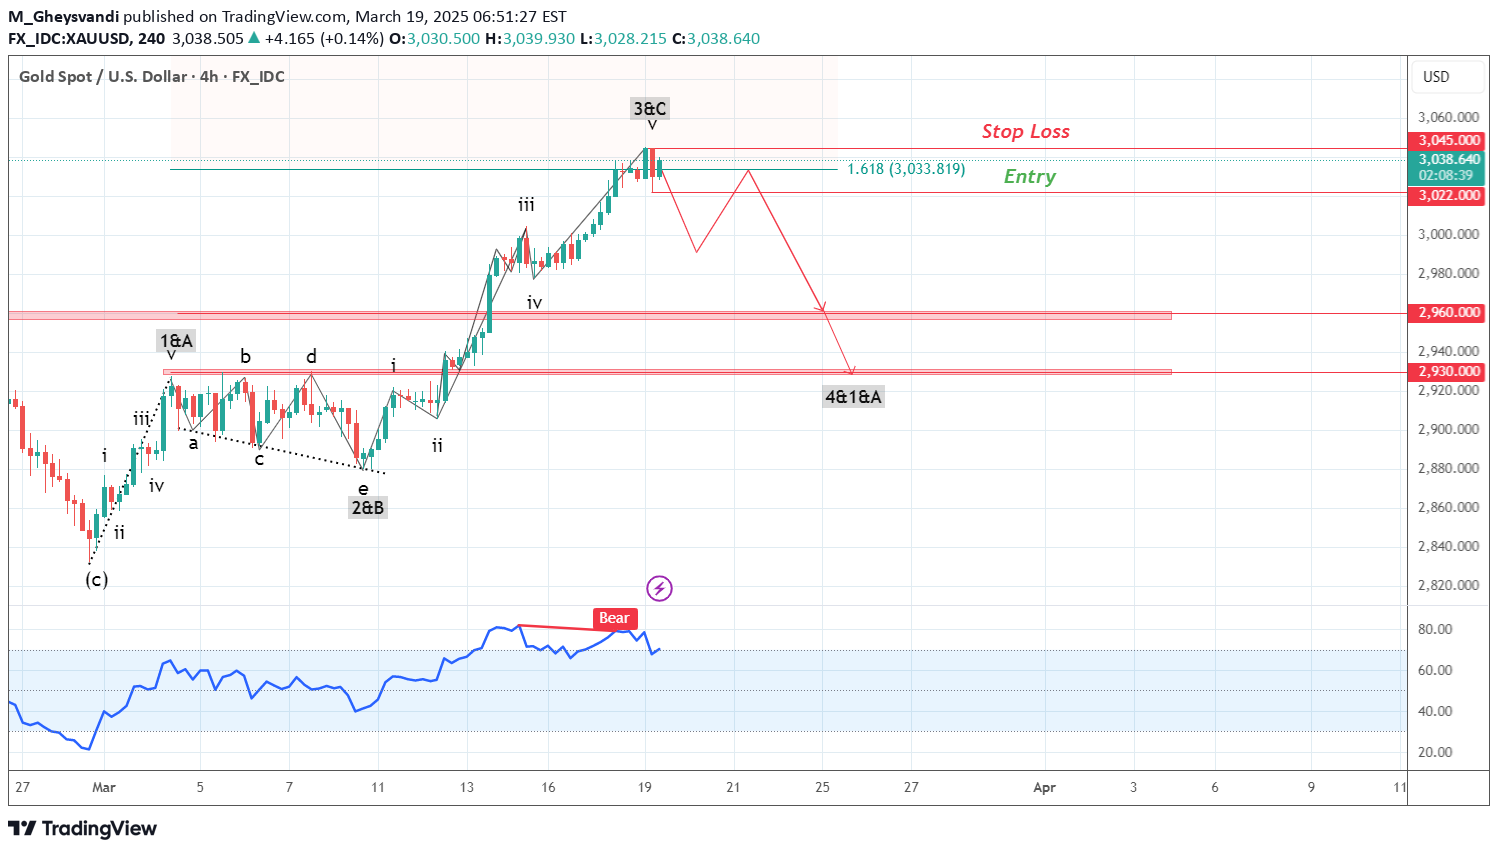
Hello friends On the gold price chart, we are witnessing the formation of an Elliott wave pattern. In this pattern, we can clearly count 3 waves. Wave 1 or A has 5 microwaves, wave 2 or B is an opening triangle, and wave 3 or C also has 5 microwaves. Between microwaves 3 and 5 of wave 3 or C, we also see a negative divergence, which is a reason for our correct counting. But what is going to happen after that? We expect a price correction in the form of a zigzag or anything other than an opening triangle. This correction will reach the $2,960 range and the next target will be $2,930. The probability of the price continuing to rise after this correction is very high. You can enter a sell trade by breaking the price range of 3022 with a stop loss of 3046. Be successful and profitable.