
MALBERT3468
@t_MALBERT3468

What symbols does the trader recommend buying?
Purchase History
پیام های تریدر
Filter
MALBERT3468
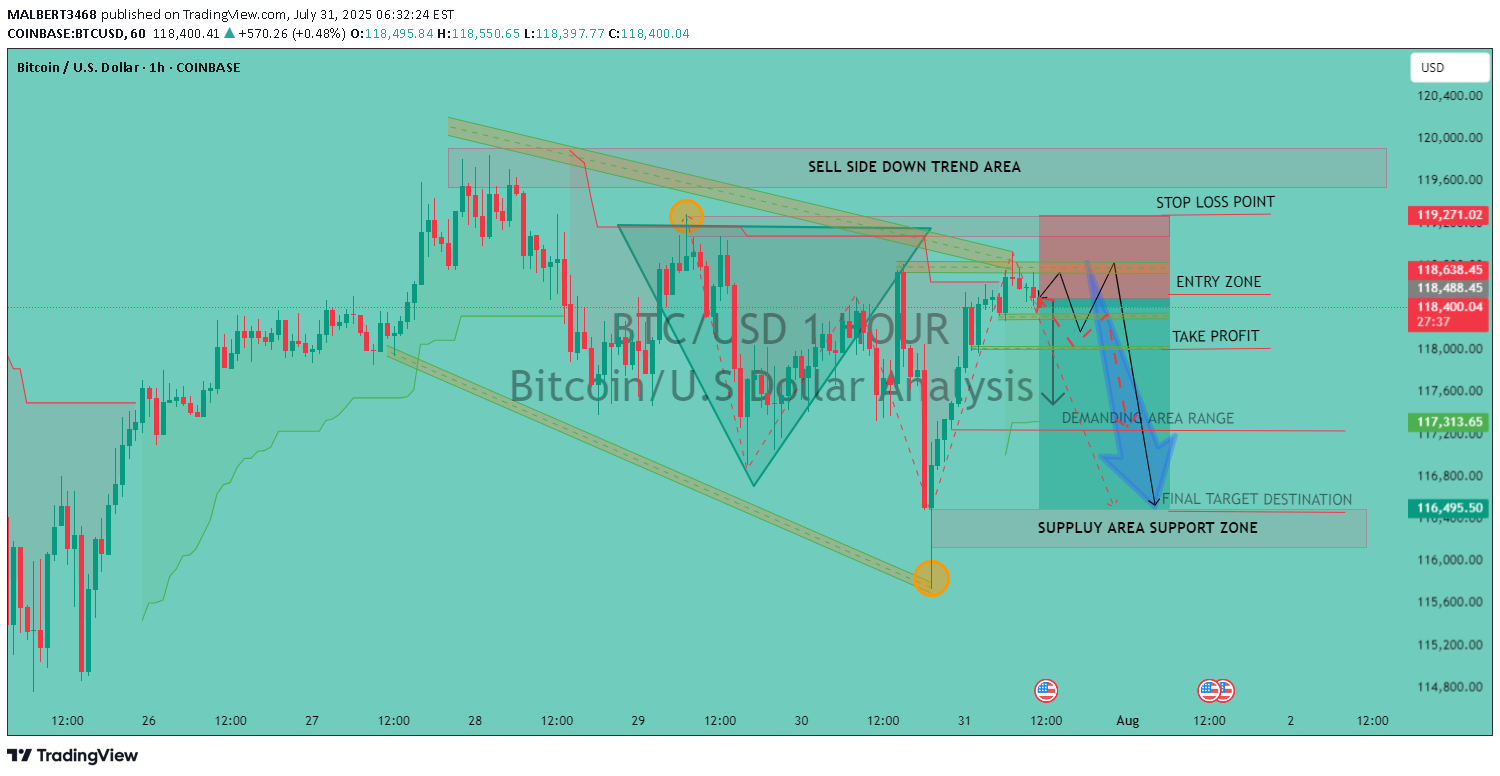
This chart is a Bitcoin (BTC/USD) 1-hour technical analysis Key Elements of the Chart 1. Entry, Stop Loss, and Take Profit Zones Entry Zone: Around $118,488 – $118,638 This is the ideal area to initiate a short trade. Stop Loss Point: Around $119,271 If price breaks above this level, trade setup is invalid. Take Profit Target: Initially near $117,326, then possibly to $116,495 2. Bearish Signals Sell-Side Downtrend Area: Price is approaching the upper trendline which has previously rejected price. Bearish Pattern: Potential Head and Shoulders / M-formation forming. Price failed to break above the trendline and is rolling over. 3. Zones to Watch ZoneDescription Supply Area Support ZoneAround $116,495 — major support zone where price may bounce. Demanding Area RangeBetween $117,300 – $117,600 — minor support zone (first TP target). Sell Side Downtrend Area
MALBERT3468
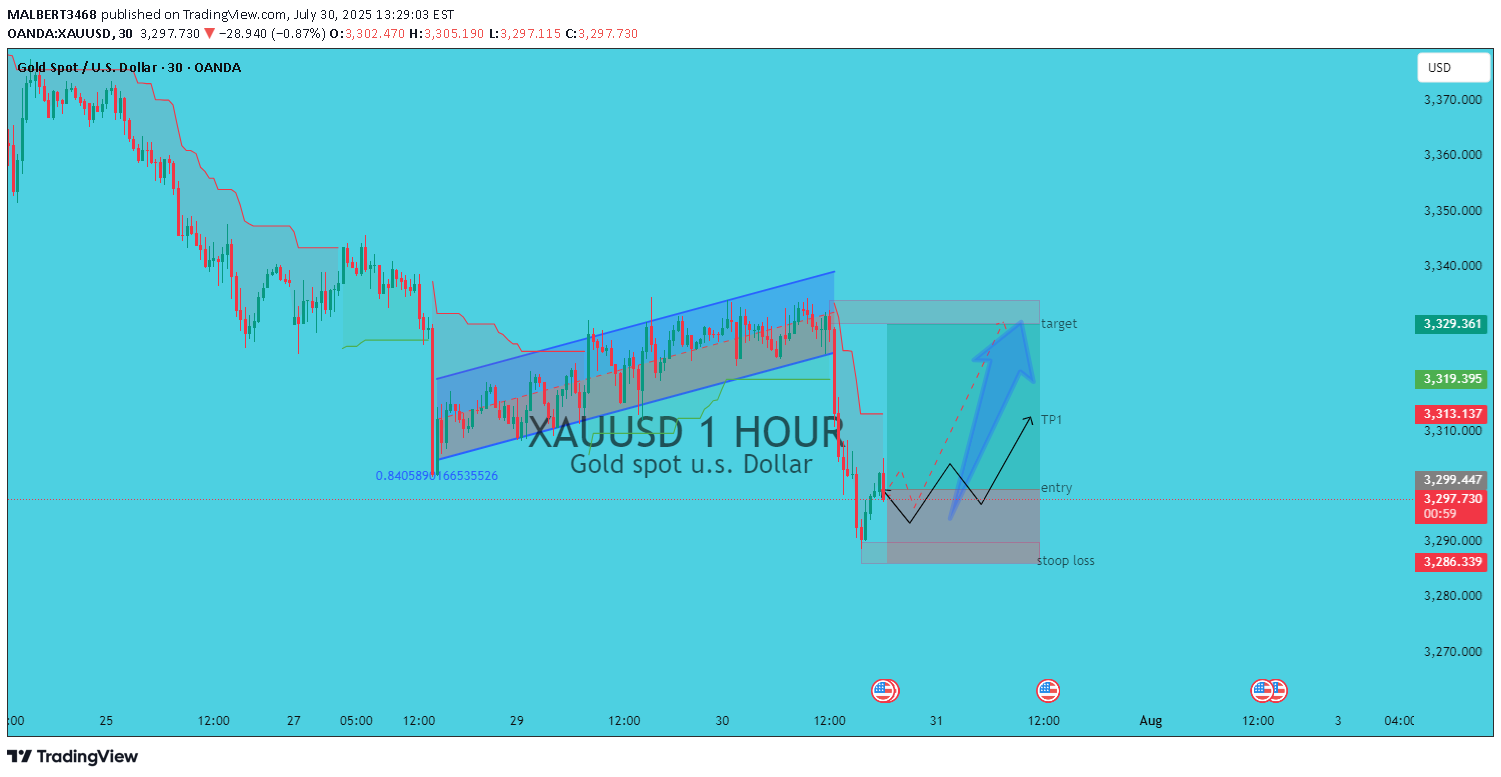
Technical Overview 1. Previous Trend (Before Box Zone): A sharp downtrend can be seen on the left. Followed by a rising channel (bearish flag) — this is typically a continuation pattern suggesting further downside. Price broke down from this rising channel, confirming the bearish continuation. 2. Current Price Action (Boxed Area): Price dropped significantly, then entered a consolidation/accumulation box (sideways movement). The chart shows a double bottom or accumulation structure with potential for reversal upward. A blue projected path indicates a possible bullish breakout from the accumulation zone. ✅ Entry Point Around $3,299.447 — current or slightly above current price. This is based on a potential reversal from the support line in the box. 🎯 Targets: TP1: Near $3,310 Final Target: Around $3,329.361 (where previous support turned resistance from the broken channel). ❌ Stop Loss: Just below the box, at $3,286.339, to protect against a bearish breakdown continuation. --- 🧠 Key Technical Concepts Involved: Bearish Flag Breakdown: Price broke below the flag, confirming weakness. Support Zone: Current price is consolidating in a demand zone. Bullish Reversal Pattern: Signs of a double bottom or accumulation phase. Risk Management: Clear stop loss and take-profit levels shown. --- 🔍 What to Watch: Confirmation of Breakout: Wait for a strong bullish candle above the top of the box or above $3,300 for added confirmation. Volume Spike: Ideally, breakout should be supported by rising volume. Macro Events: This chart also shows economic calendar icons at the bottom — likely US news/events. Be cautious as these can impact gold significantly. --- 📌 Conclusion: This is a bullish counter-trend setup after a sell-off. It anticipates a short-term recovery or relief rally toward previous support-turned-resistance. However, overall trend remains bearish, so caution is advised — especially near the $3,330 resistance.sorry guys stop loss hit
MALBERT3468
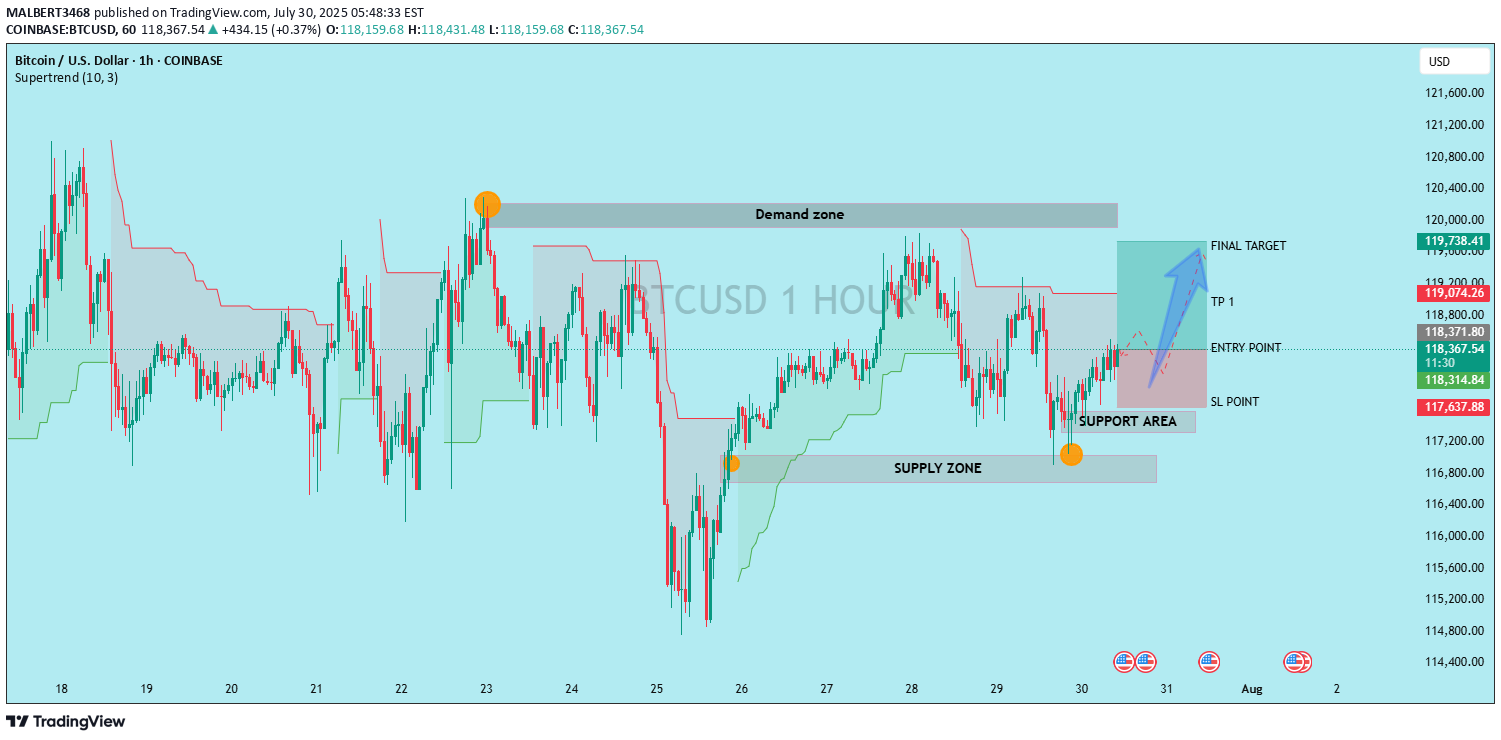
May be target bullish in uptrend because market is gambling and now market is going in upside. 🔎 Key Observations > Support and Demand Zones Support Area (near 117,600 – 117,800 USD) Price has bounced from this level multiple times (highlighted with orange circles), making it a strong support zone. Demand Zone (around 120,000 USD Price previously dropped from this level, so it may act as resistance when tested again. ✅ Long Position (Buy) Setup: Enter around 118,300 USD Stop loss at 117,575 USD First profit target: 118,900 USD Final target: ~119,675 USD ❌ Invalidation: If price breaks below 117,575, it may continue down toward the supply zone near 116,800 USD.stop loss hit
MALBERT3468
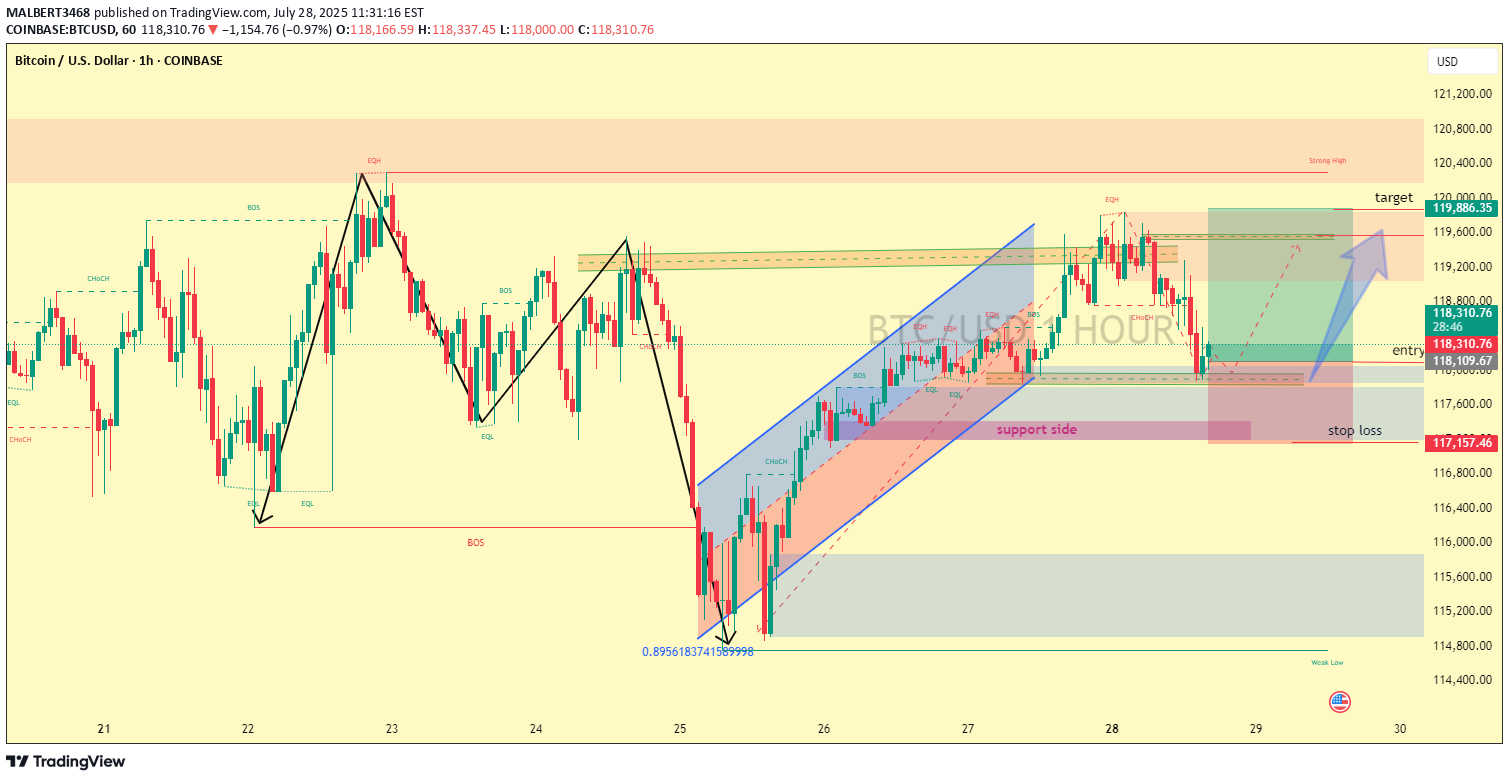
Perfect — let’s break down your BTC/USD (Bitcoin vs US Dollar) 1H chart in detail. Chart Analysis 1. Market Context The price action shows strong bullish recovery after a breakdown, with Bitcoin moving inside an ascending channel (highlighted in blue). The channel support side has been tested recently, and buyers defended it. 2. Key Levels Entry Zone: Around 118,300 – 118,400 (where price currently sits). Stop Loss: Below 117,150 (red zone). Target: Around 119,800 – 120,000 (highlighted in green with resistance). --- 3. Price Structure Multiple Break of Structure (BOS) labels show shifts in momentum. The last BOS was bullish, supporting the idea of continuation to the upside. There’s also a liquidity grab below minor equal lows (EQL), followed by a recovery — a common bullish sign. --- 4. Setup Idea Trade Bias: Bullish (Buy Setup) Logic: Price tapped the support side of the channel. Rejection from demand zone (purple) showshalf of the target is achieved successfully hit 110+ pipsSorry guys for late update, now market goes in our favour but dont target hit . around 115+PIPS in profit. then STOP LOSS hit . sorry for this ready for next target.
MALBERT3468
gold may be consolidate with buying opportunity gold hype buying zone demand lets see what would the possibility scenario stability long position setup is deliveredour tp1 is hit successfully hit with 180+ pipshalf of the target is reached with 180+pips moves closed this setup and ready for next setup analysis has been ready to take over
MALBERT3468
gold may be consolidate with buy zone area bounce back the price action and we also wait for confirmation and stability of gold buyers lets see what will be next position of goldstop loss hit wait for another setup
MALBERT3468
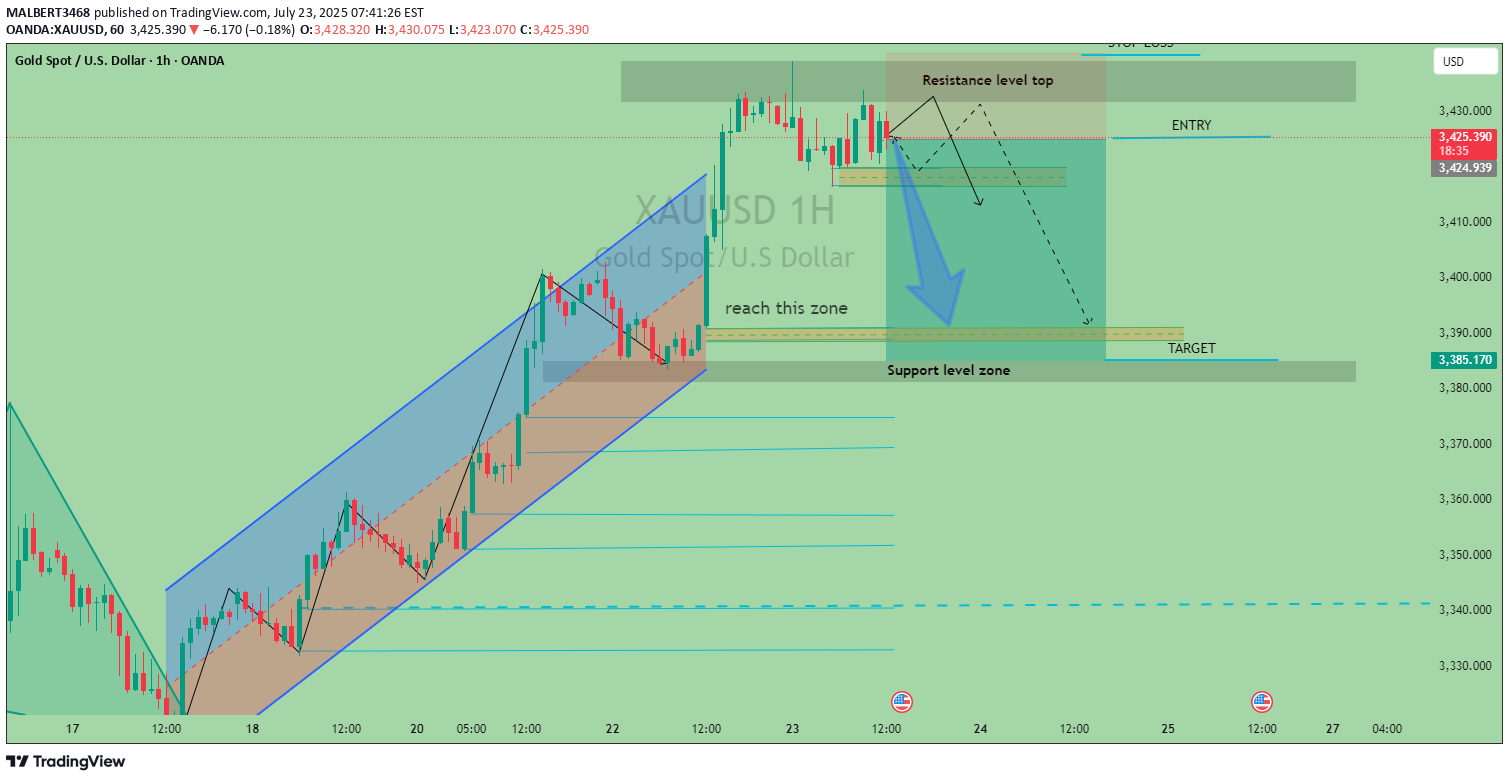
may be gold consolidation bearish zone that the sellers will be dominant in this zone Trend Analysis: It appears there is an upward trend, indicated by the price movement forming higher highs and higher lows within the blue channels. This suggests bullish sentiment. Chart Patterns: The chart may be displaying a pattern, such as a channel or a triangle, which traders often look for to identify potential breakouts or reversals. Support and Resistance: Support levels are usually indicated by the horizontal lines. The price seems to bounce off these levels, suggesting they are significant. Resistance levels may be shown in areas where the price has difficulty moving above. Retracement Levels: If retracement levels (such as Fibonacci levels) are mentioned, these can indicate potential areas where the price might reverse or consolidate. Price Target: It appears there may be a target price shown (e.g., "TP") along with a stop-loss placement. These indicate planned exit points for trades based on the analysis.finally chart setup is hit successfully reach the target zone al most 400+ pips setup close with this point
MALBERT3468
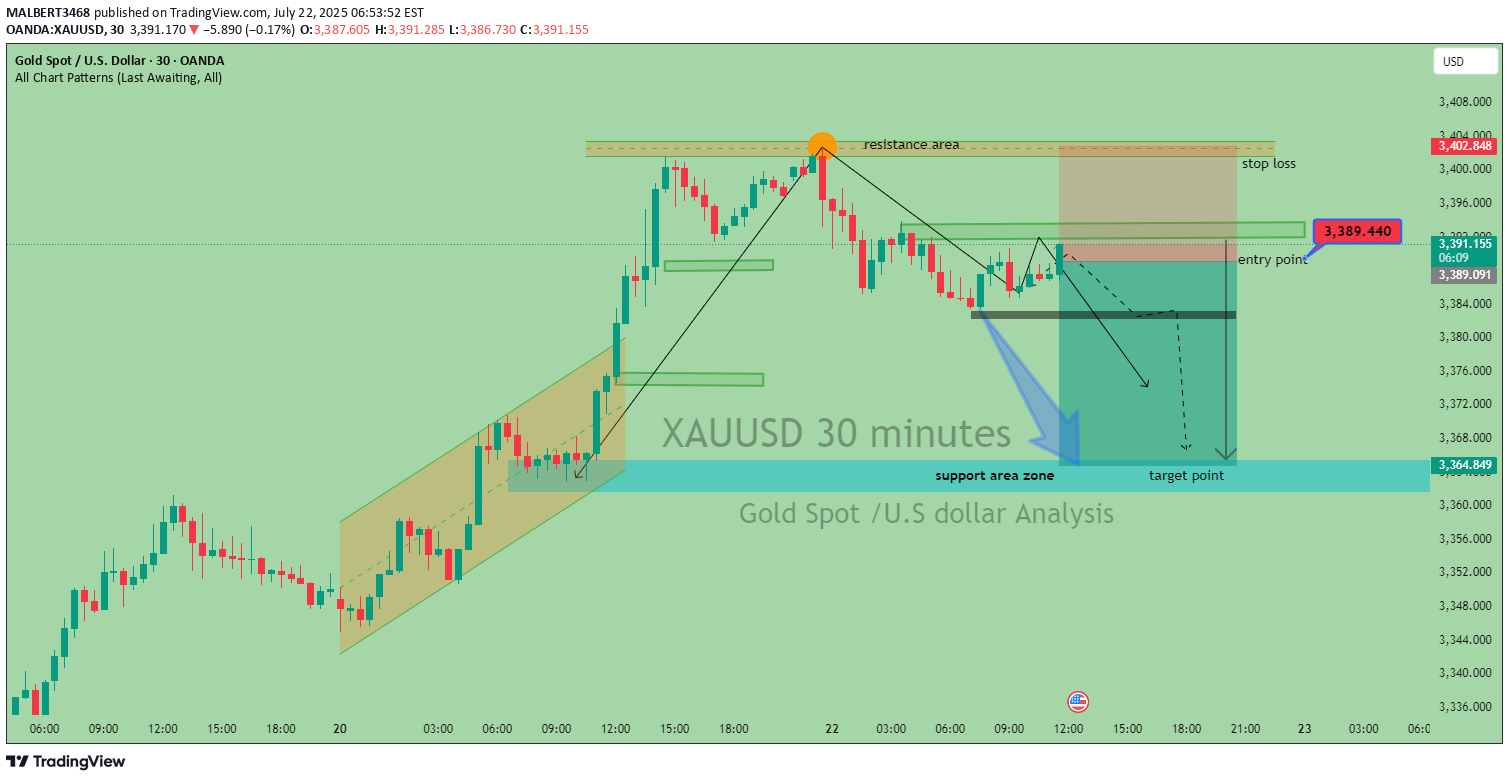
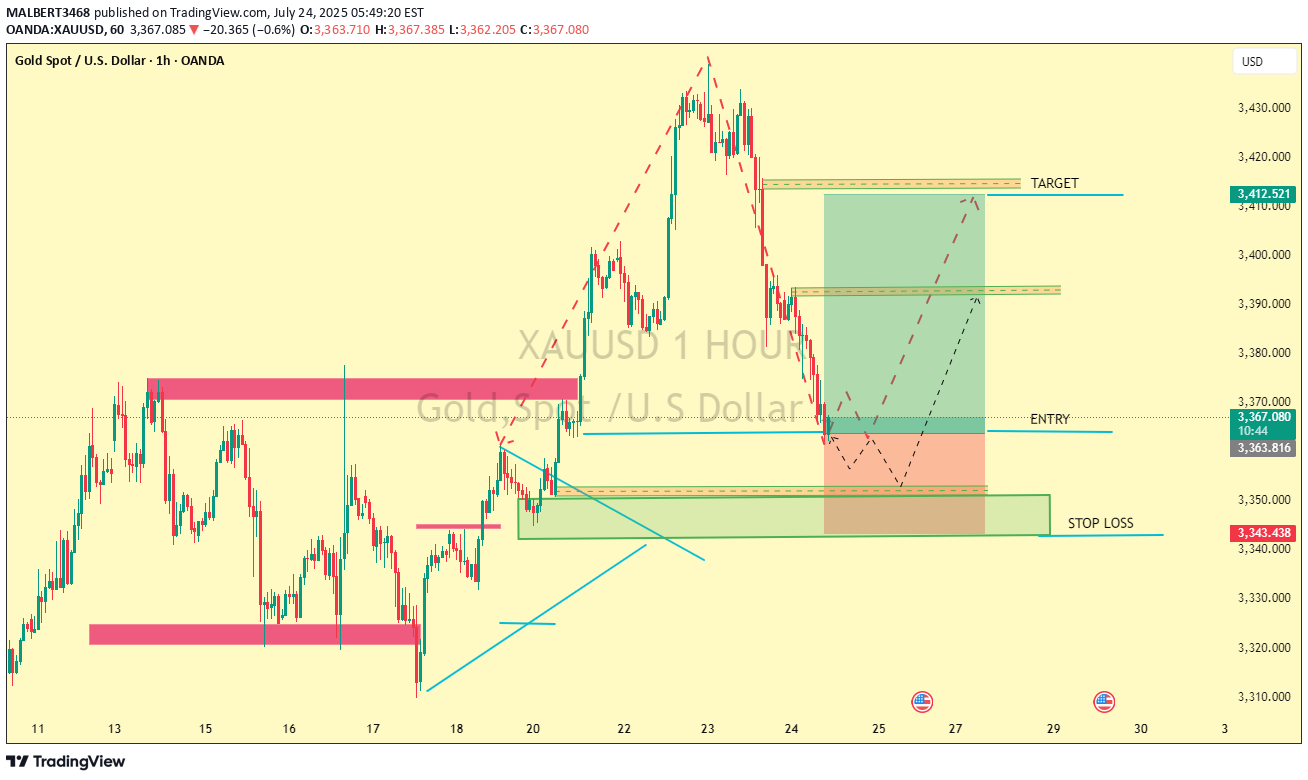
This is a 30-minute chart analysis of XAUUSD (Gold vs US Dollar), and it seems to be a short (sell) trade setup according to price action and zone-based analysis. Below is a detailed breakdown of the main components: Chart Overview Timeframe: 30 minutes Instrument: XAUUSD (Gold Spot vs USD) Current Price: Approximately 3389 Direction: Bearish setup (expecting price to decline) Key Areas Marked 1. Resistance Area Placed around 3,401.941 (with orange zone and dot) This is the recent high or rejection level Functioning as the stop-loss price 2. Entry Point Recommended at 3389 (price currently trading around this level) Trader hopes the price to break down from this level 3. Target Point (Support Zone) Trade Setup Summary Element Value Trade Type Short (Sell) Entry ~3389=3392 Stop Loss ~3401.941 Target ~3364.776
MALBERT3468

Xau/usd trade update sell setupentry point 3335stop loss 3360Market fly up to move 3338/3340 breakout to 3346/3348 now to revesing for a bearish move target.first target 3300second target 3280final target 3260 risk Manage wisely,wait for the confirmation befor entry.best for intraday trader and scaplers.Xauusd premium analysis trader is best signal Mrcharlie_1 daily big lots big signals 4/5 signals and 500 pips hit today target for follow me channel don't miss channel real trade alert from our premium channel,join free our telegram channel.Xau/usd analysis perfect hit!market flew up to 3338, then revesed sharply to 3322target in progress over 160+ pips profit running!analysis working perfectly precision Entry at 3330 market respecting levels beautifully.this is power of smart trading with real analysis not luck!stay tuned for next setups. risk management is key.
MALBERT3468

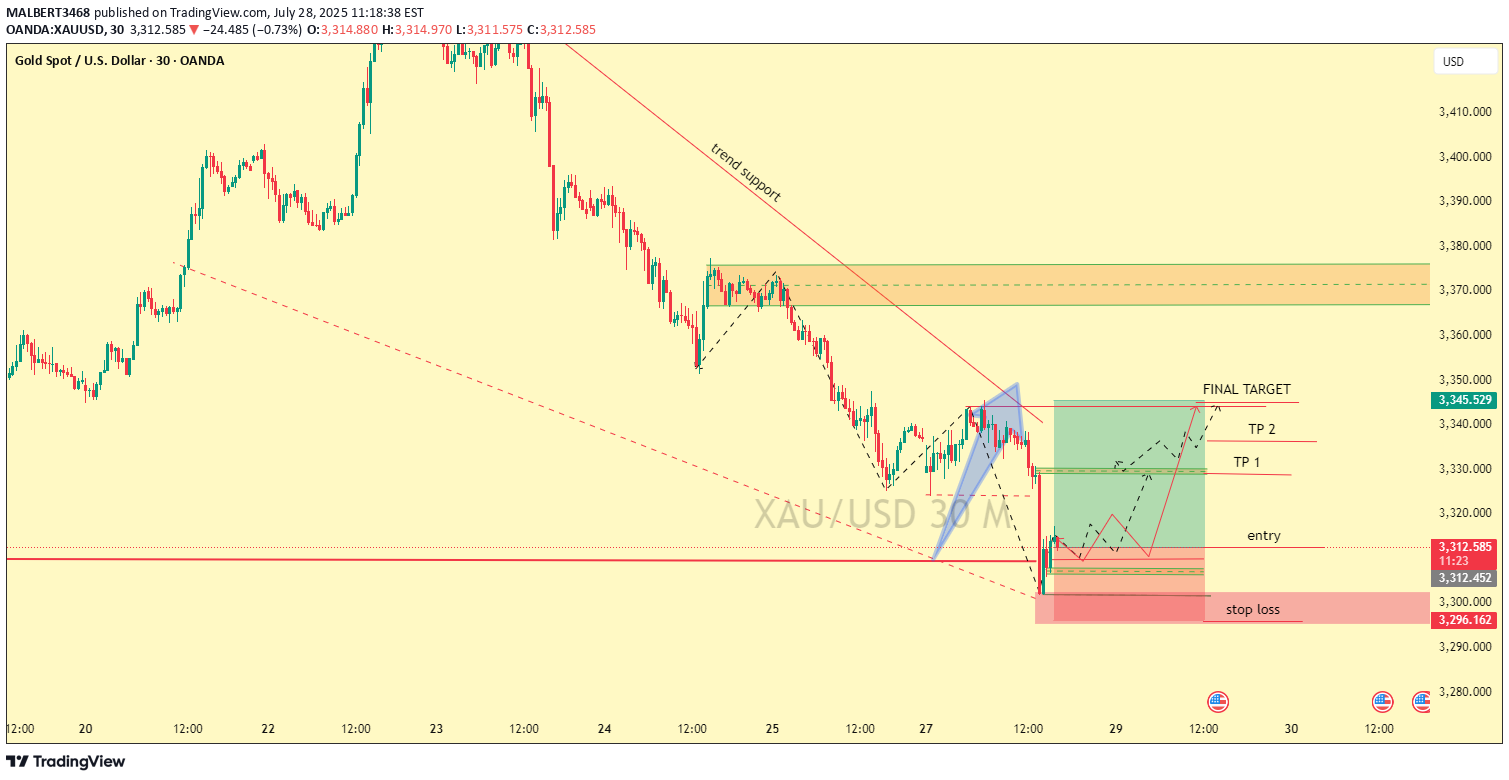
May be consolidation market bullish in uptrend .Market Structure:After a downtrend, price formed a falling wedge, followed by a potential inverse head and shoulders pattern (bullish reversal pattern).Entry Zone: Marked just above the support area, right shoulder, and falling wedge breakout.Targets:TP1: ~3,332.545TP2: ~3,340.850Final TP: ~3,362.928Stop Loss: Below the recent low (~3,291.538)✅ Strengths in the Analysis1. Multiple Bullish Patterns:Falling Wedge (bullish reversal).Inverse Head and Shoulders (strong reversal indication)2. Well-defined Entry/Exit Levels:Clear Entry, SL, and TP points.3. Support Area Holds:Price bounced from a strong historical support zone.4. Confluence with Resistance Break:If price breaks above the neckline (Entry), it confirms the bullish reversal.📈 Trade Management TipsTrail Your Stop: After TP1, move stop loss to break-even.Partial Take Profits: Scale out at each TP level.Watch for Fakeouts: Falling wedge breakouts can sometimes retrace before running🔧 Suggestions for Improvement1. Volume Confirmation:Consider adding volume to confirm the breakout, especially from the falling wedge and neckline of the inverse H&S.2. Ichimoku Context:You are using part of the Ichimoku Cloud. It would help to clearly interpret it:Is the price breaking above the cloud?Are Tenkan-sen and Kijun-sen bullish aligned?3. Candle Confirmation for Entry:Wait for a strong bullish candle (engulfing or breakout) before entering.4. Risk-Reward Ratio:The RR looks good (~2.5:1), but clarify it in text for better decision-making.5. Fundamental Context:Consider macro factors affecting gold (e.g., USD strength, interest rates, geopolitical news).🧠 SummaryYou're trading a bullish reversal setup based on multiple chart patterns and a bounce off a key support zone. This is a well-structured plan with solid technical justification. Just ensure proper confirmation before entry and maintain discipline with risk management.congratullation guys our TP 1 hit around 120+PIPS in profit .
Disclaimer
Any content and materials included in Sahmeto's website and official communication channels are a compilation of personal opinions and analyses and are not binding. They do not constitute any recommendation for buying, selling, entering or exiting the stock market and cryptocurrency market. Also, all news and analyses included in the website and channels are merely republished information from official and unofficial domestic and foreign sources, and it is obvious that users of the said content are responsible for following up and ensuring the authenticity and accuracy of the materials. Therefore, while disclaiming responsibility, it is declared that the responsibility for any decision-making, action, and potential profit and loss in the capital market and cryptocurrency market lies with the trader.