
LouisJack66_trade
@t_LouisJack66_trade

What symbols does the trader recommend buying?
Purchase History
پیام های تریدر
Filter
بیت کوین در آستانه سقوط: آیا حمایت حیاتی ۸۵,۰۰۰ دلار شکسته میشود؟
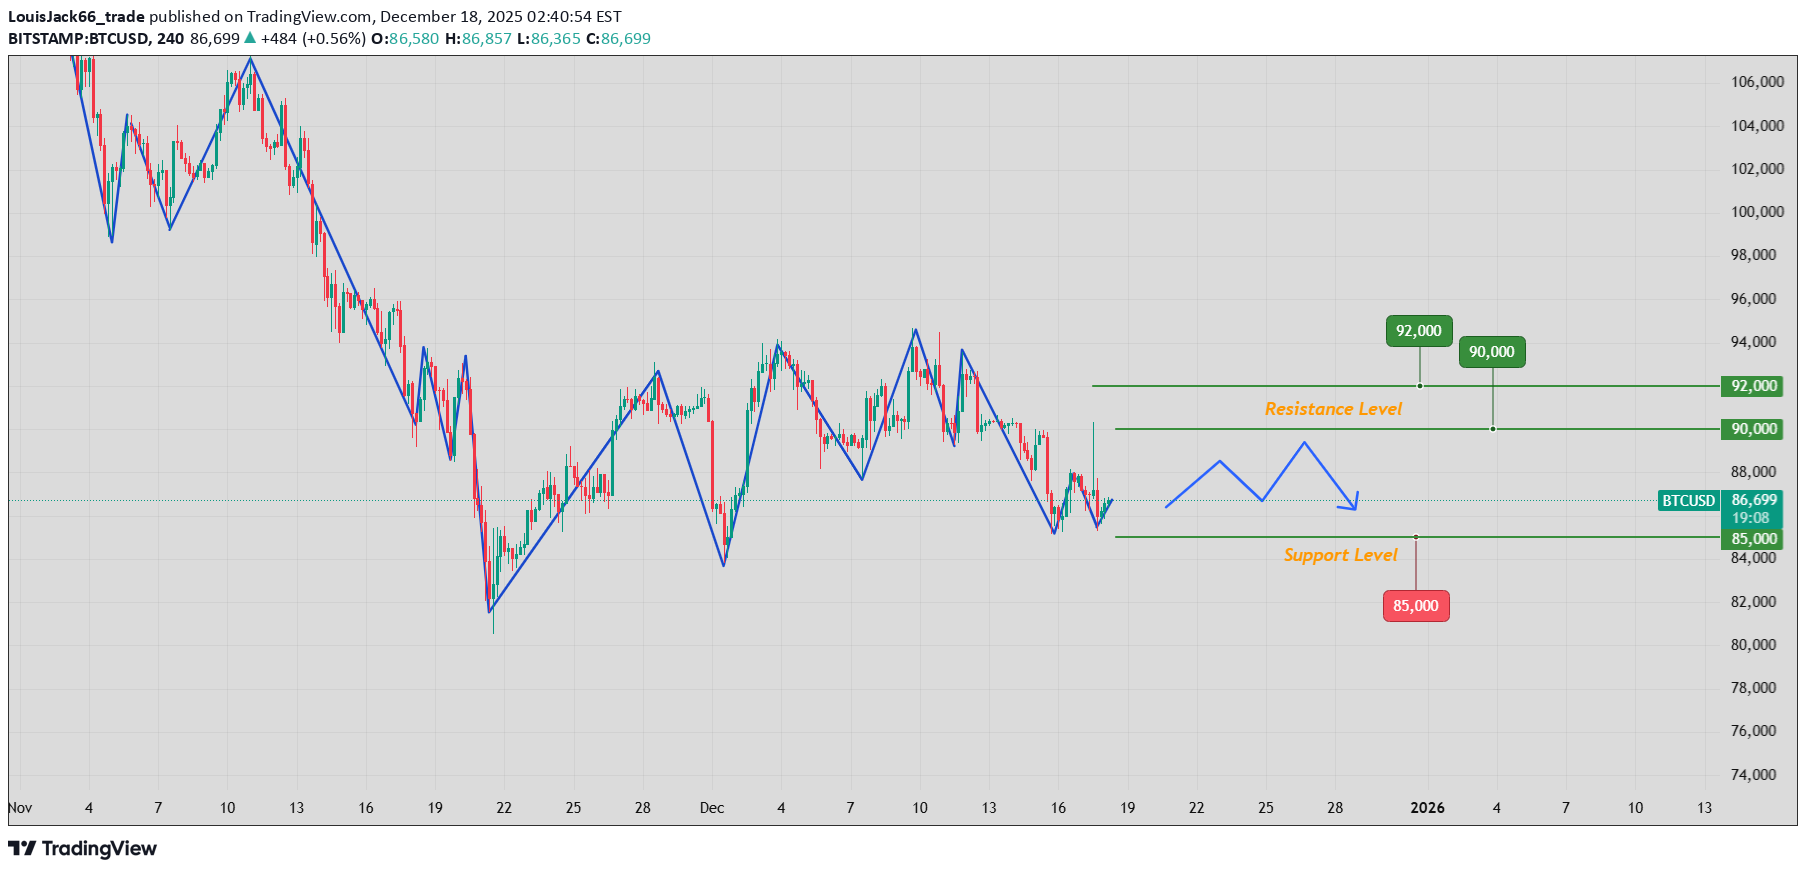
Today, BTCUSD has extended its correction trend that started in October, exhibiting a weak oscillating pattern. Prices have been range-bound around the core zone of $85,000–$86,000. Following the flash crash after the price challenged the $90,000 level, the pair is now lingering near the critical support at $85,000, with bears firmly in control of the market. Support Levels: $85,000 serves as the current core lifeline. This level corresponds to the 0.786 Fibonacci retracement of the uptrend that began in April. A daily close below this threshold will most likely trigger a new round of panic selling, opening the door to the next support zone of $78,000–$80,000. In the short term, a weak support has formed around $86,000, though its effectiveness has already been undermined. From the perspective of the daily EMA indicator, $85,000 also coincides with the EMA 400 level, further underscoring its significance as a support level. Resistance Levels: For any short-term rebound, the primary resistance zone lies at $87,000–$88,000, with $87,200 and $87,500 as key intraday resistance points. Stronger resistance is concentrated at $91,000 (the midpoint of the previous consolidation phase) and $94,700. Additionally, the descending trend line from the October high has formed a robust resistance barrier. Without the support of large-scale spot buying, it will be difficult for any rebound to break through these levels. Trading Strategy: Sell 86500–87000 SL 87500 TP 85000 - 84000 - 83000 Buy 85000 - 85200 SL 84500 TP 86000 - 86500 - 87000Stronger resistance is concentrated at $91,000
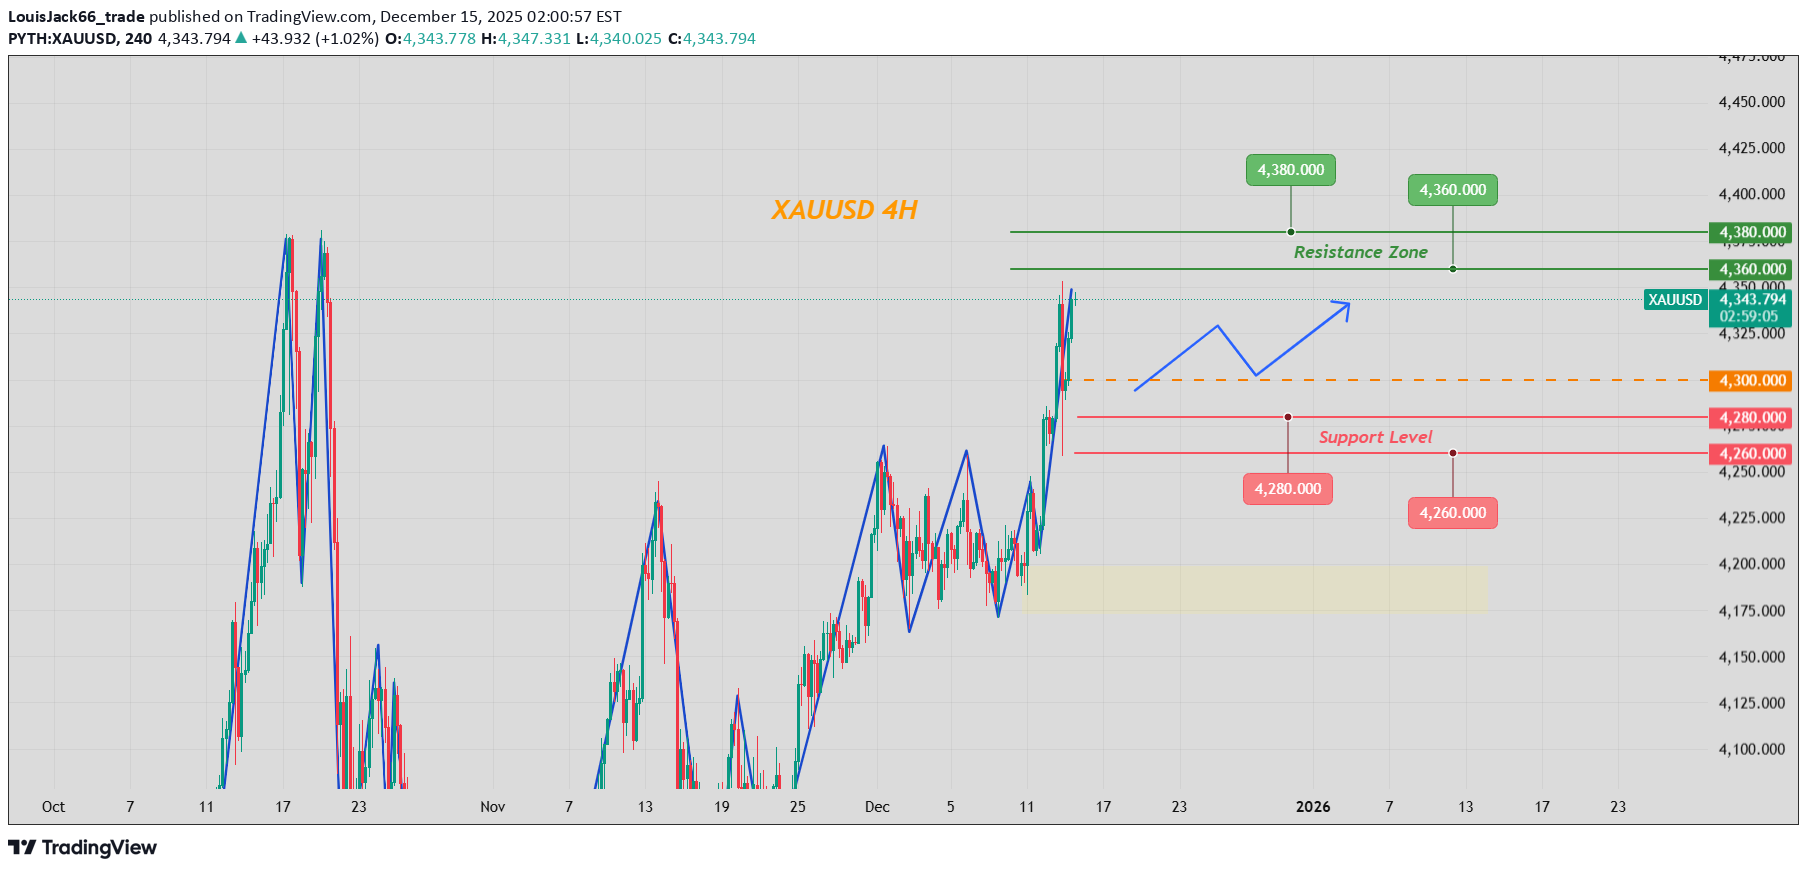
Gold High-Level Consolidation
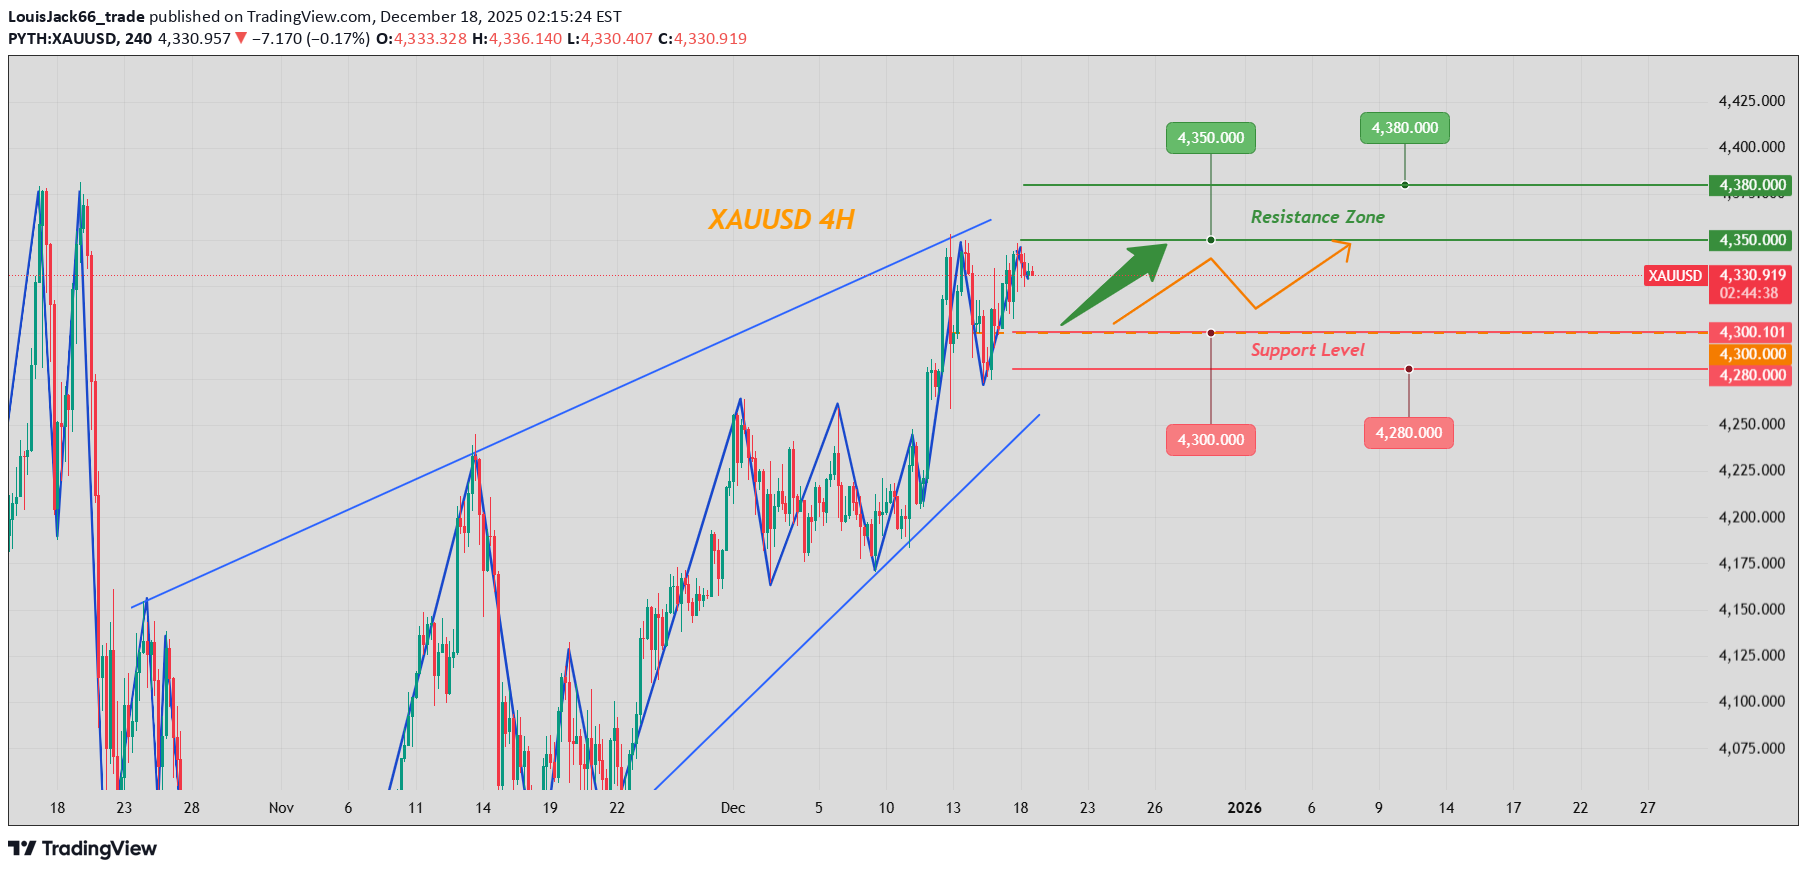
Gold is trading in a high-level consolidation phase today. Despite a mild pullback, prices have held firmly within the recent elevated range, with the underlying bullish trend remaining intact. Meanwhile, a flurry of key data releases and policy announcements scheduled for the evening are highly likely to break the current sideways pattern and trigger sharp volatility. Near-term resistance is concentrated in the $4,348–$4,353 zone, which serves as both a key high of the recent consolidation and a strong intraday pressure level. Further resistance lies near the all-time high around $4,380. On the support side, the primary support is the H1-level Fair Value Gap at $4,320–$4,325. The secondary support zone is $4,300–$4,310, where the hourly support has shifted upward—any pullback to this level will likely attract buying interest. The market is bracing for multiple high-impact events today. These announcements will directly influence the U.S. dollar exchange rate and market expectations for Fed rate cuts. A dovish tilt in the data and policies could propel London gold to break above $4,353 and challenge the $4,381 level. Conversely, cautious signals may drive prices down toward the $4,300 mark. Trading Strategy: Buy 4310 - 4315 SL 4300 TP 4330 - 4340 - 4350 Sell 4350 - 4355 SL 4365 TP 4320 - 4310 - 4300Gold broke through the short-term resistance and charged toward the $4,380 resistance level as we predicted,it’s now pulling back under overhead pressure!
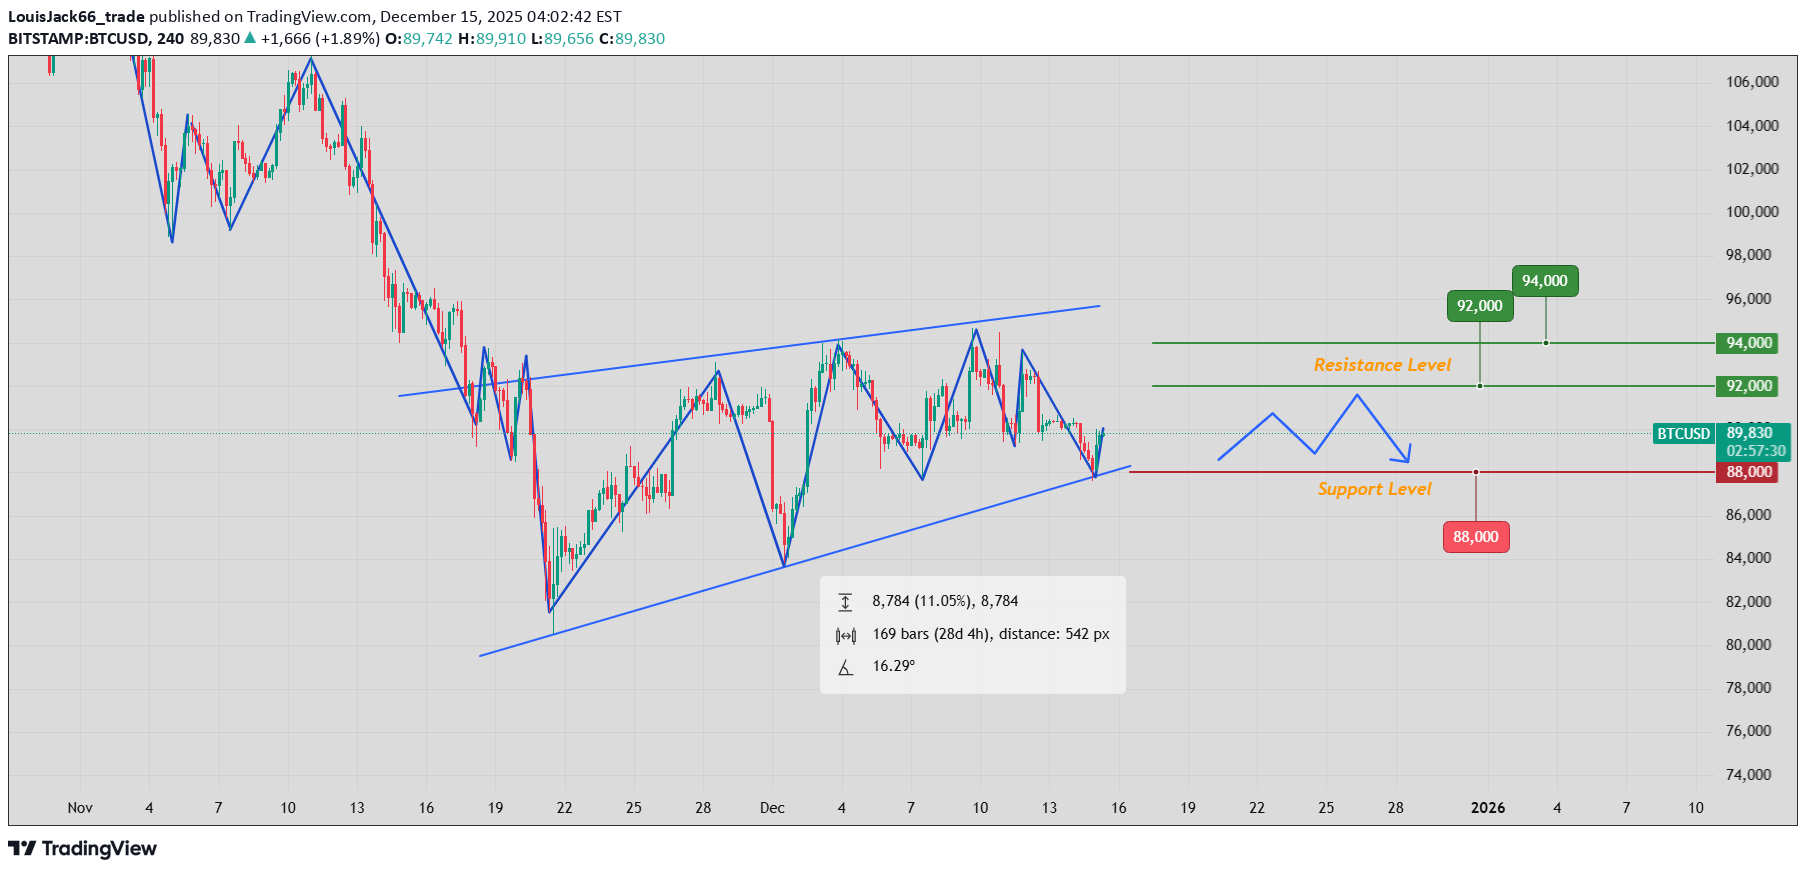
BTCUSD Rebound & Consolidation
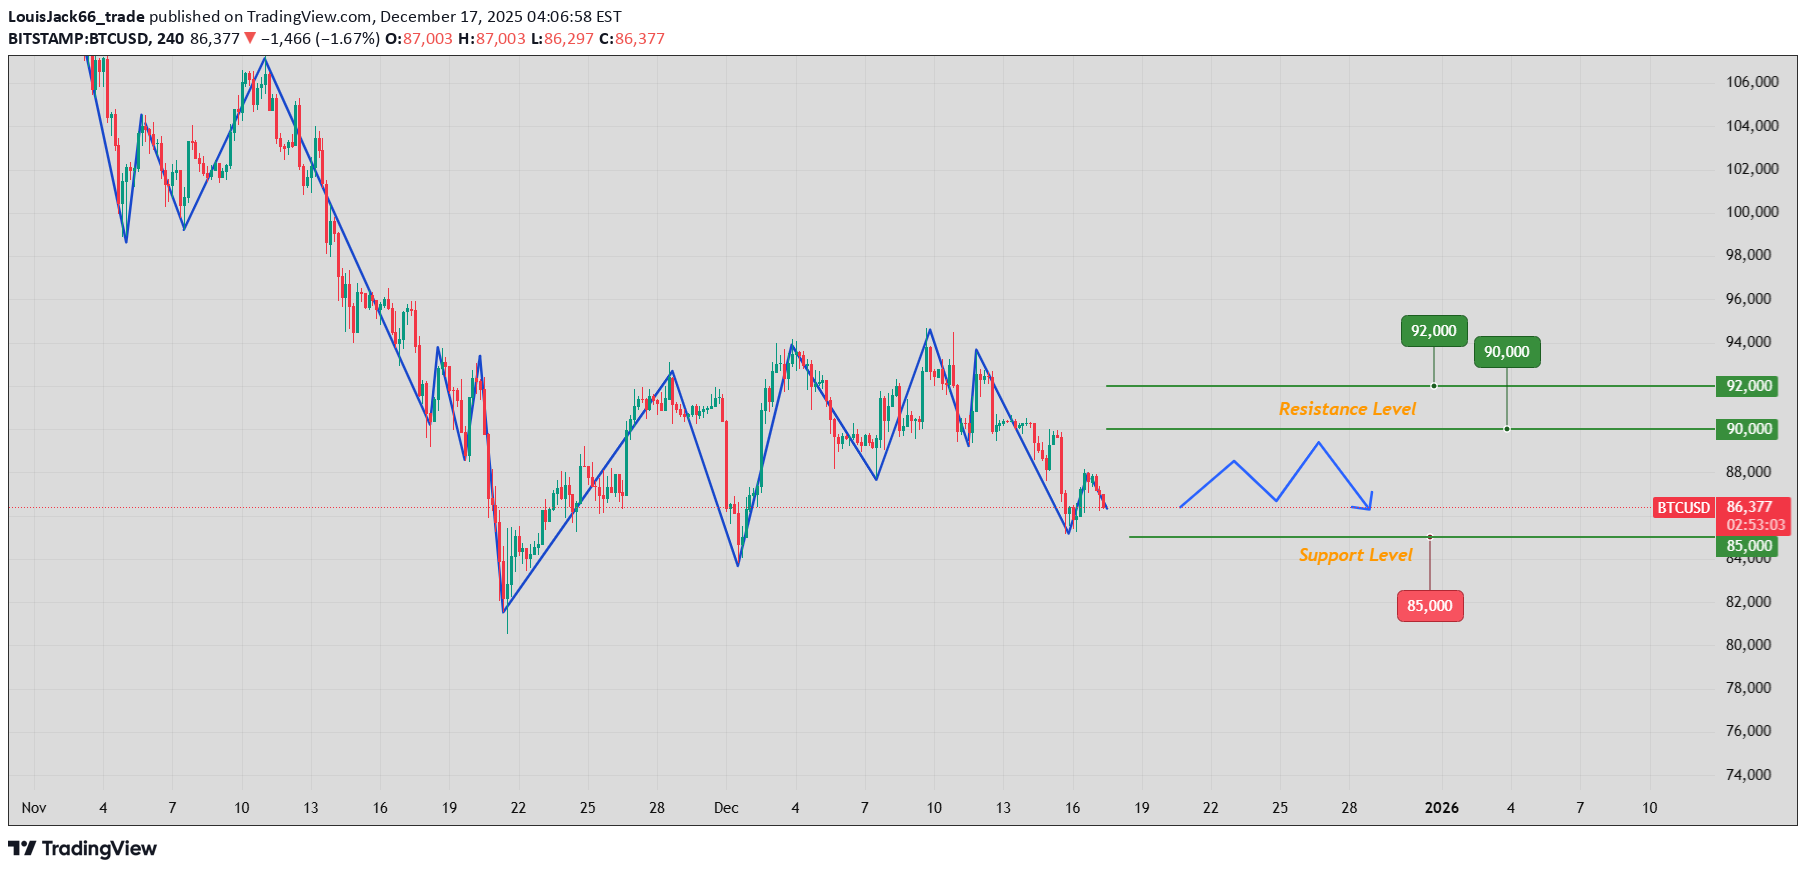
Today, BTCUSD is experiencing a narrow-range consolidation following a oversold rebound. Despite bouncing roughly 3% from its overnight low, the bearish structure on the daily timeframe remains intact. Market sentiment stays cautious, and the short-term trend will still hinge on the defense of key price levels and upcoming macroeconomic data releases. The November U.S. nonfarm payroll data delivered a strong headline but weak internals outcome. It neither altered market expectations for the Federal Reserve’s monetary policy nor provided clear unilateral guidance. Meanwhile, year-end institutional settlements have triggered liquidity tightening, coupled with a slowdown in stablecoin growth, which has weighed on Bitcoin’s short-term risk appetite. Additionally, expectations surrounding the Bank of Japan’s interest rate hike remain uncertain—an unexpected 50-basis-point rate hike could spark a fresh round of correction in Bitcoin prices. On the support front, the $85,000–$86,000 zone serves as the core support range. This level not only marks the early November low but also encompasses the average cost basis of U.S. spot Bitcoin ETFs. Approximately 400,000 BTC were purchased within this range, making it a robust structural support for the year. A breakdown below this zone would open the door to a further decline toward $80,000–$82,000. For resistance, the initial hurdle lies at $88,000–$88,500 (yesterday’s rebound peak), with further resistance at $89,700–$90,500. A decisive breakout above this upper resistance band would pave the way for a potential rally toward $94,000. In summary, BTCUSD is likely to trade within the $85,000–$94,000 range in the short term. Going forward, focus should be placed on the U.S. inflation data and remarks from Federal Reserve officials scheduled for Thursday. Ahead of the release of these key data points and policy signals, the market will most likely adopt a wait-and-see stance, with prices lacking a clear directional bias. Trading Strategy: Buy 86000 - 86500 SL 85500 TP 87500 - 88000 Sell 88000 - 88500 SL 89000 TP 86000 - 85500Target TP zone hit as expected
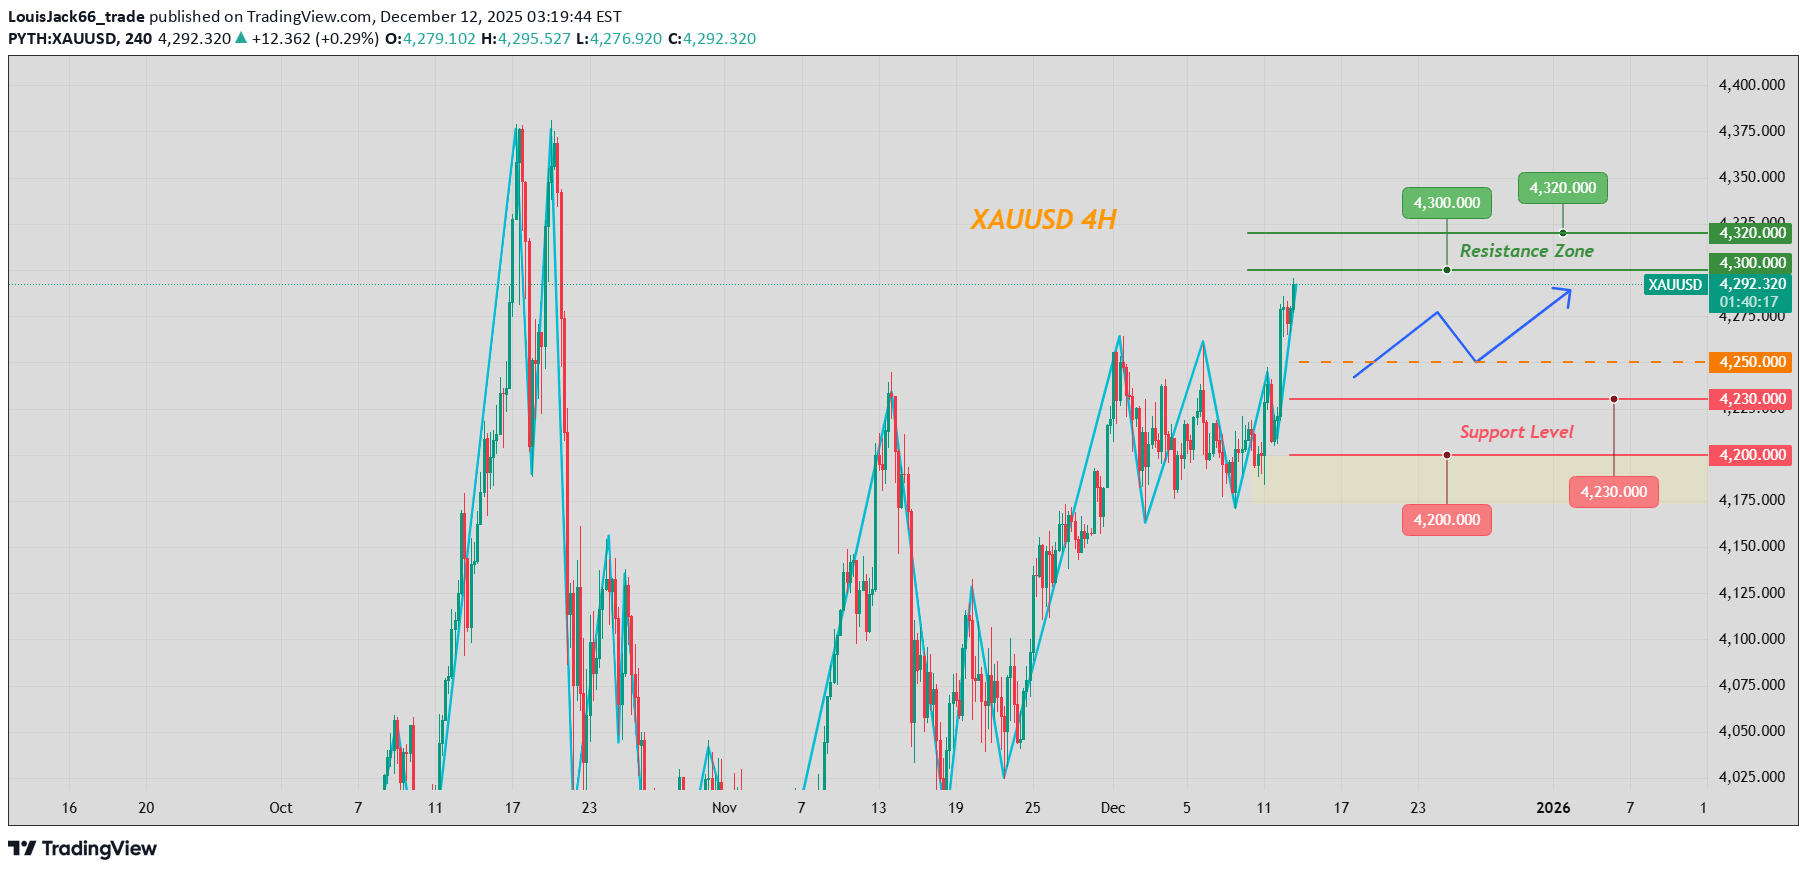
Gold:Bullish Oscillation, Key Levels at $4300–$4350
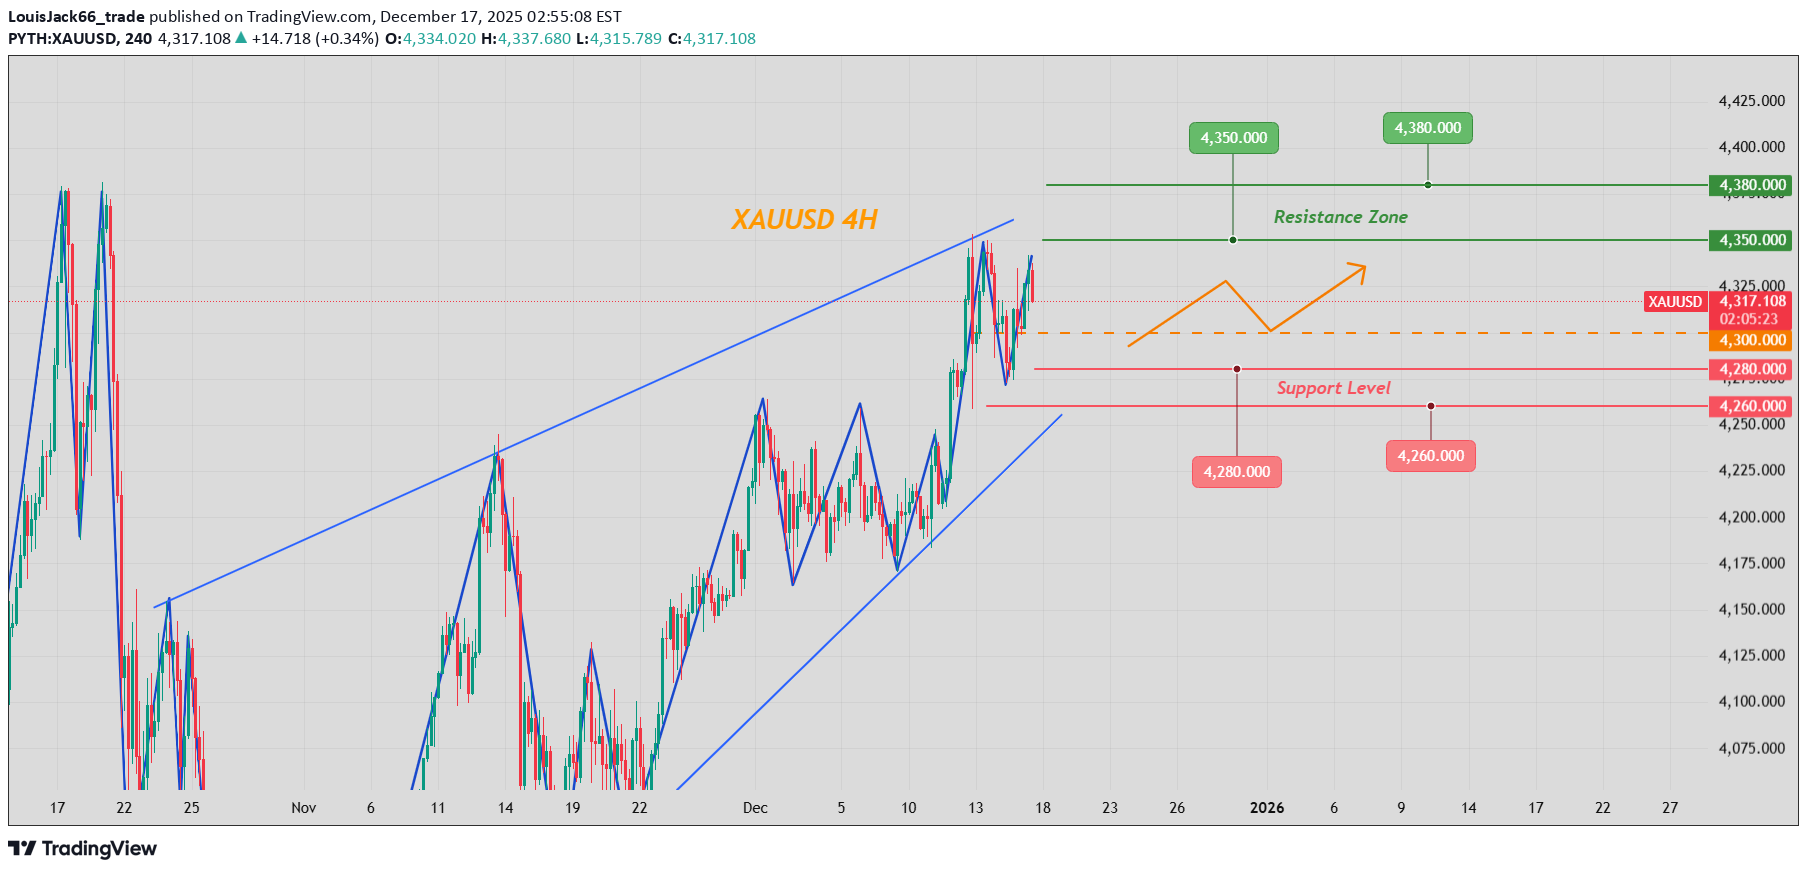
Gold is exhibiting an oscillating pattern with bullish bias, stabilizing after breaking previous highs today. This movement is primarily underpinned by a weak U.S. dollar, expectations of Federal Reserve interest rate cuts, and sustained gold purchases by central banks. In the short term, focus on the resistance zone of $4,345–$4,350 and support zone of $4,300–$4,280. Evening data releases may amplify market volatility. Trading Strategy: Buy 4300 - 4305 SL 4290 TP 4330 - 4340 - 4350 Sell 4345 - 4350 SL 4360 TP 4320 - 4310 - 4300Target TP zone hit as expected
Gold Intraday Signals
Gold maintained a high-range consolidation pattern today, with intense rivalry between bulls and bears. While the broader uptrend from previous sessions remains intact, the price has undergone a phased pullback under the impact of bearish factors, and short-term upward momentum has weakened. On the resistance front, the key short-term resistance zone lies between $4,335 and $4,345, a level that has repelled multiple upward attempts. A decisive breakout above this zone would expose gold to the major resistance range of $4,350–$4,385, where $4,350 is a recent high-point pressure level, and the $4,380–$4,385 interval encompasses the historical peak. For support levels, the immediate focus is on the $4,265–$4,270 support zone, a critical support line from the prior uptrend. A breakdown below this level could trigger a further decline toward the $4,245–$4,255 range, and a decisive breach of that floor may spark a new round of profit-taking. In addition, the combined release of the U.S. October and November Nonfarm Payrolls report today is highly likely to influence Federal Reserve policy expectations, thereby dictating gold’s near-term trajectory. Close attention should be paid to the data outcome. Trading Strategy: Buy 4280 - 4285 SL 4270 TP 4310 - 4320 - 4330 Sell 4335 - 4345 SL 4350 TP 4320 - 4310 - 4300Following the US releases a set of economic indicators today, gold prices surged from $4,301 to $4,312 and now to make a run at $4,320. Reached our anticipated TP range.
ریزش بیت کوین ادامه دارد؟ تحلیل کلیدی سطوح حمایت و مقاومت BTC/USD امروز
Today, the BTCUSD pair exhibited a volatile and weak trend characterized by a decline followed by a pullback. After a sharp drop in the early trading session, it staged a slight rebound but still failed to break free from the recent downward trend overall. Bulls and bears engaged in fierce rivalry around key price levels, which was driven by multiple factors including expectations for macroeconomic policies, institutional attitudes and market sentiment. Resistance Levels The key short - term resistance stands at $90,400, a level that corresponds to the CME futures gap formed over the weekend. It exerts a strong magnetic pull on the price and serves as a crucial juncture determining whether the rebound can gain further momentum. The $90,500 level, where multiple moving averages converge on the 4 - hour chart, also acts as a resistance level. If this level can be breached, the pair will subsequently face a strong resistance zone between $92,000 and $94,000. Only a volume - backed breakout of this zone will enable Bitcoin to be expected to regain upward momentum. Support Levels The current core support zone ranges from $88,000 to $89,000. If this zone is lost, the price may further decline to the key Fibonacci Retracement level of $85,569, or even lower regions, and the subsequent trend will weaken further. Trading Strategy: Sell 91500 - 92000 SL 92500 TP 90000 -89000- 88000 Buy 88000 - 89000 SL 875000 TP 91000 - 91500 - 92000
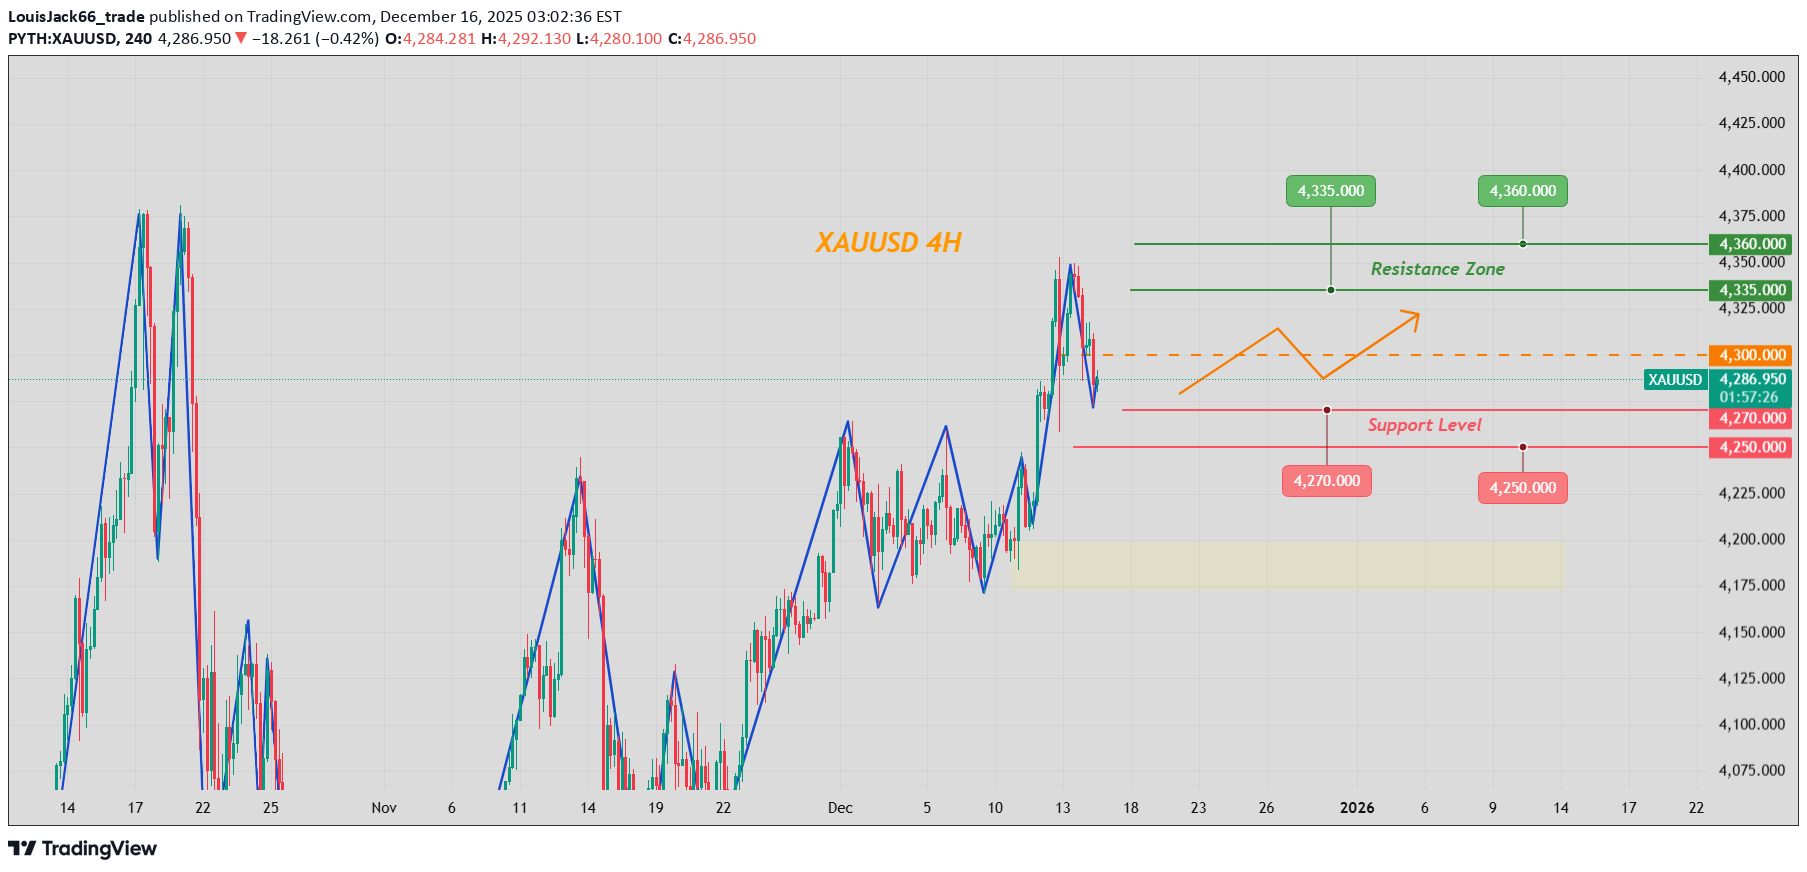
Gold’s High Consolidation
Gold maintained an overall high-range consolidation pattern today. The tug-of-war between bulls and bears intensified amid the lingering impact of Federal Reserve policy decisions and the pending release of key economic data. Its near-term trajectory will hinge heavily on upcoming indicators including the U.S. Core PCE Price Index. In the short term, immediate resistance is concentrated at 4360—a level that has repeatedly capped gold’s upside attempts in recent sessions. Meanwhile, the historical peak of 4380 acts as a major psychological resistance level with significant selling pressure. On the support side, the immediate support lies at 4280, followed by 4260,the intraday low from the previous trading session, where robust buying interest has been demonstrated. The 4200 mark serves as a critical inflection point for the recent trend: holding above this level will keep the medium-to-long-term bullish bias intact, while a decisive break below could trigger a deep correction. The outlook for gold will be largely dictated by data releases such as the U.S. Core PCE Price Index and retail sales figures. A data outcome favorable to gold is likely to propel prices past the 4360 resistance, paving the way for a challenge of the 4380 historical peak. Conversely, data signaling U.S. economic strength may push gold down to test the 4260 support, and potentially the key 4200 level if bearish momentum accelerates. Trading Strategy: Buy 4300 - 4305 SL 4290 TP 4340 - 4350 - 4360 Sell 4370 - 4360 SL 4380 TP 4330 - 4320 - 4310
طلا در اوج ماند: استراتژی خرید و فروش در سطوح کلیدی جدید
The gold maintained an overall strong upward trend today. After surging in the early trading session, it consolidated at a high level, with prices consistently trading above the recent key resistance levels, reflecting a pronounced bullish bias. Its price action is strongly underpinned by favorable fundamental factors, while technical indicators also signal a clear uptrend. The price extended its rally in the morning and did not experience a sharp pullback afterward. However, hampered by resistance around the 4290 level in the short term, there was no unilateral skyrocketing movement. Key Levels: Resistance Zones: Immediate short-term resistance is concentrated in the 4290–4300 range. A decisive breakout above this zone would pave the way for a further advance toward the next key resistance at 4320–4330. Support Zones: Support levels have been gradually shifting upward. The 4250 mark, once a resistance level, has now evolved into a key support zone. The core support range stands at 4220–4230, with an additional robust support at the psychological integer level of 4200,a price point that previously triggered a swift rebound, underpinned by ample buying interest. Trading Strategy: Buy 4250–4255 SL 4245 TP 4280 - 4290 - 4300 Sell 4295–4300 SL 4305 TP 4280 - 4270 - 4260
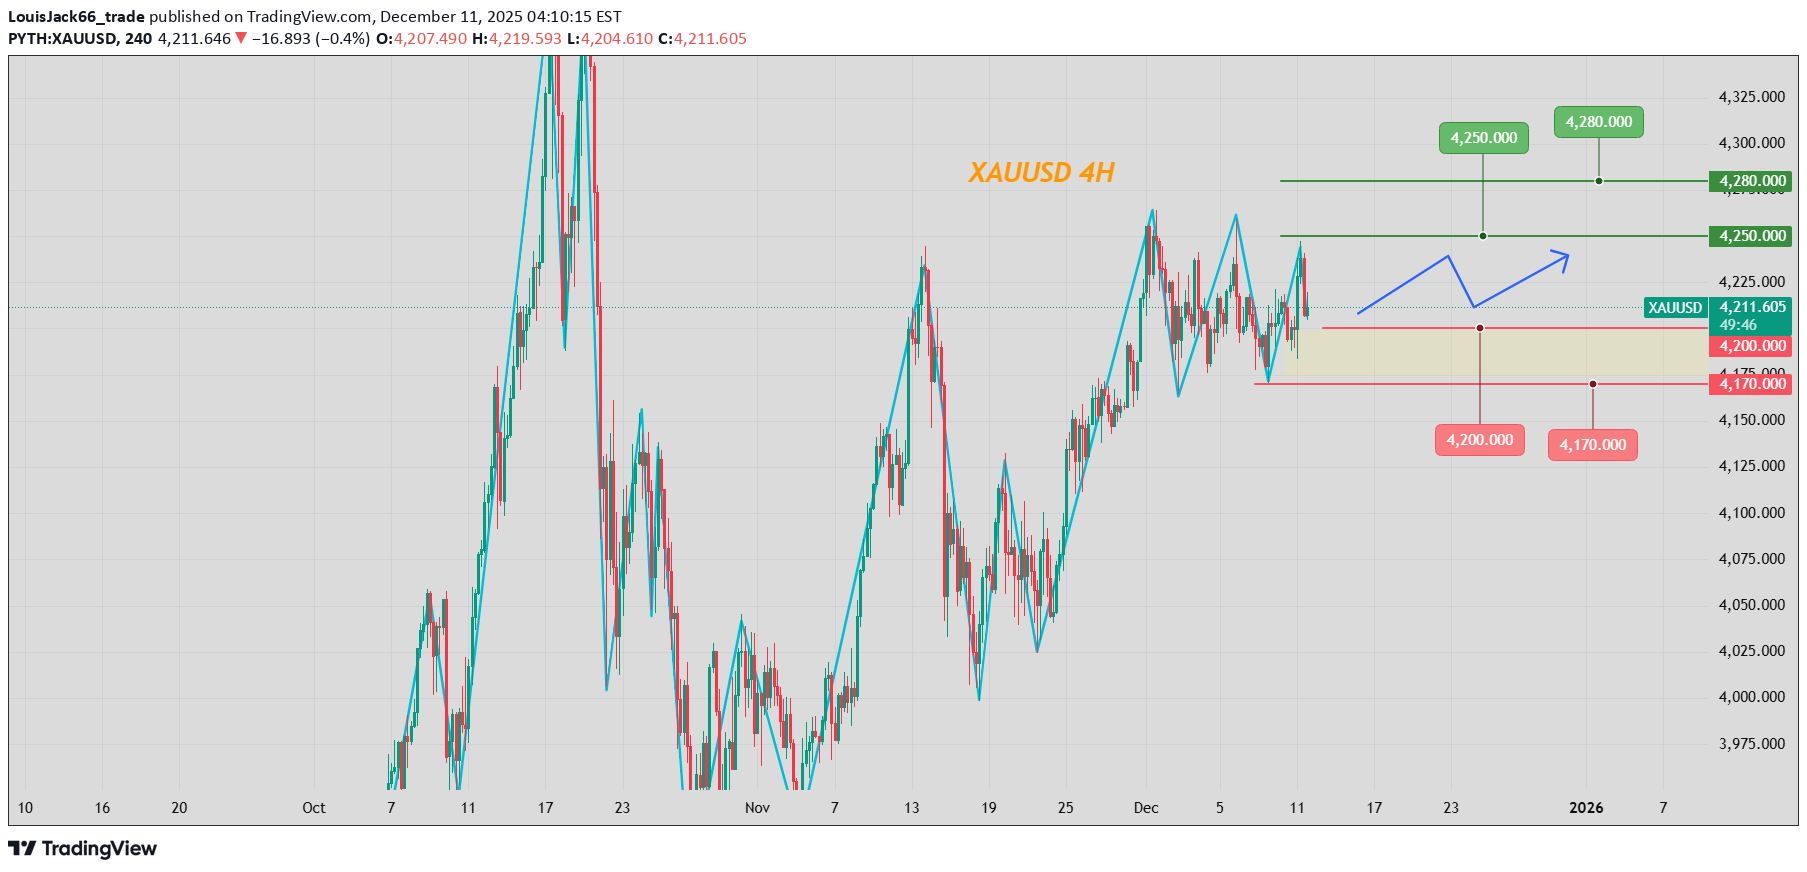
طلا در مرز حساس ۴۲۸۰؛ آیا سقف جدید در راه است یا اصلاح آغاز میشود؟
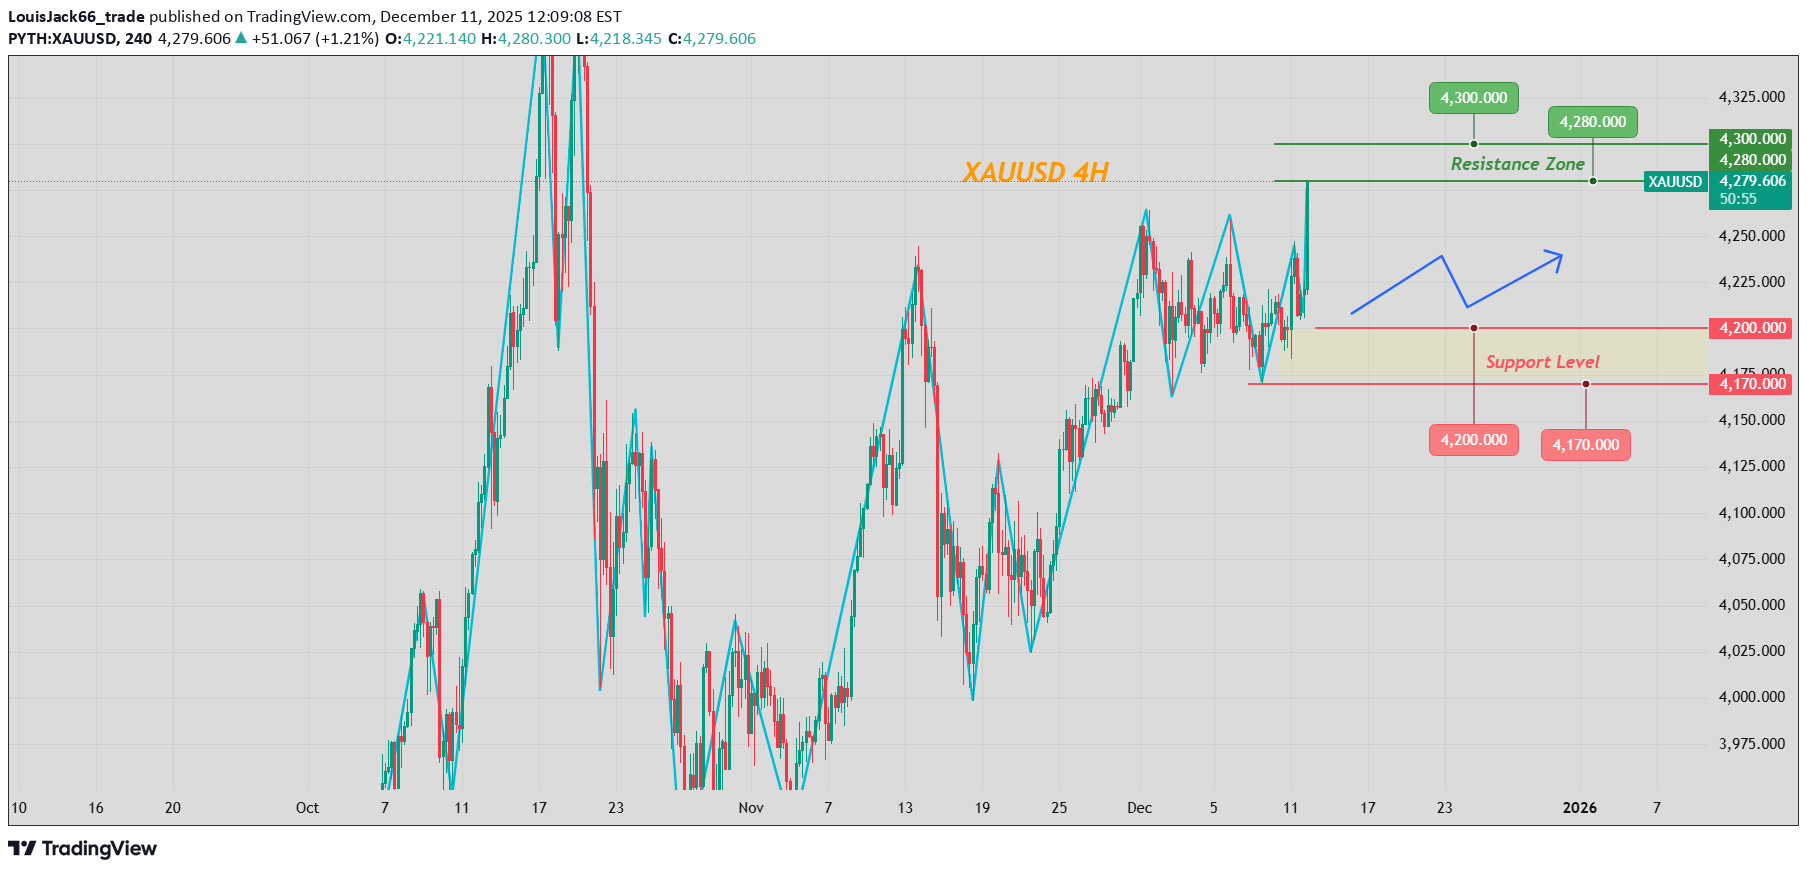
Gold prices pierced the short-term resistance at 4260 and then charged directly toward the 4280 high in line with our ideas earlier, but encountered strong resistance at 4280 and retreated thereafter. It is critical to monitor the breakout potential of the 4280 level now, and impulsive chasing of upward moves is not recommended.Gold prices briefly broke above the 4280 level but failed to hold the breakout, and are now under pressure to pull back for a consolidation phase.
Gold Intraday Market Recap & Trading Strategy
The gold trended with a bullish bias in high-range consolidation following a dip and rebound today. After the Federal Reserve's rate cut announcement in the early hours, prices surged sharply before paring some gains, yet they steadfastly held above the key 4200 level throughout the session. During the Asian trading session, London gold hit an intraday high of 4247.50, then pulled back to an intraday low of 4204.04. Having previously broken out of the 4170–4220 consolidation range, prices once rallied to 4239 right after the rate cut, maintaining a strong posture in high-level trading without being disrupted by the short-term pullback. The bullish momentum is jointly underpinned by fundamental tailwinds from the rate cut and stabilizing technical signals. Key Levels: Resistance Zones: The immediate key resistance lies in the 4250–4260 range. A decisive breakout above this zone would likely pave the way for a further advance toward 4280–4300. Support Zones: The 4200 mark acts as a robust intraday support. Further downside support is anchored in the 4175–4180 range, a level that has proven its resilience through multiple tests in previous sessions. Trading Strategy: Buy 4200 - 4210 SL 4190 TP 4240 - 4250 - 4260 Sell 4260 - 4270 SL 4280 TP 4230 - 4220 - 4210Gold is moving right on the expected path.Gold prices perfectly hit designated take-profit range of 4260 during the U.S. trading session.Gold prices pierced the short-term resistance at 4260 and then charged directly toward the 4280 high in line with our projection, but encountered strong resistance at 4280 and retreated thereafter. It is critical to monitor the breakout potential of the 4280 level now, and impulsive chasing of upward moves is not recommended.
Disclaimer
Any content and materials included in Sahmeto's website and official communication channels are a compilation of personal opinions and analyses and are not binding. They do not constitute any recommendation for buying, selling, entering or exiting the stock market and cryptocurrency market. Also, all news and analyses included in the website and channels are merely republished information from official and unofficial domestic and foreign sources, and it is obvious that users of the said content are responsible for following up and ensuring the authenticity and accuracy of the materials. Therefore, while disclaiming responsibility, it is declared that the responsibility for any decision-making, action, and potential profit and loss in the capital market and cryptocurrency market lies with the trader.