
LoneWolf1425
@t_LoneWolf1425

What symbols does the trader recommend buying?
Purchase History
پیام های تریدر
Filter
LoneWolf1425
هدف بعدی فیبو: افشای قیمت کلیدی ۱.۸۷ دلار و فرصت خرید مجدد ۶۰ سنتی برای FET!
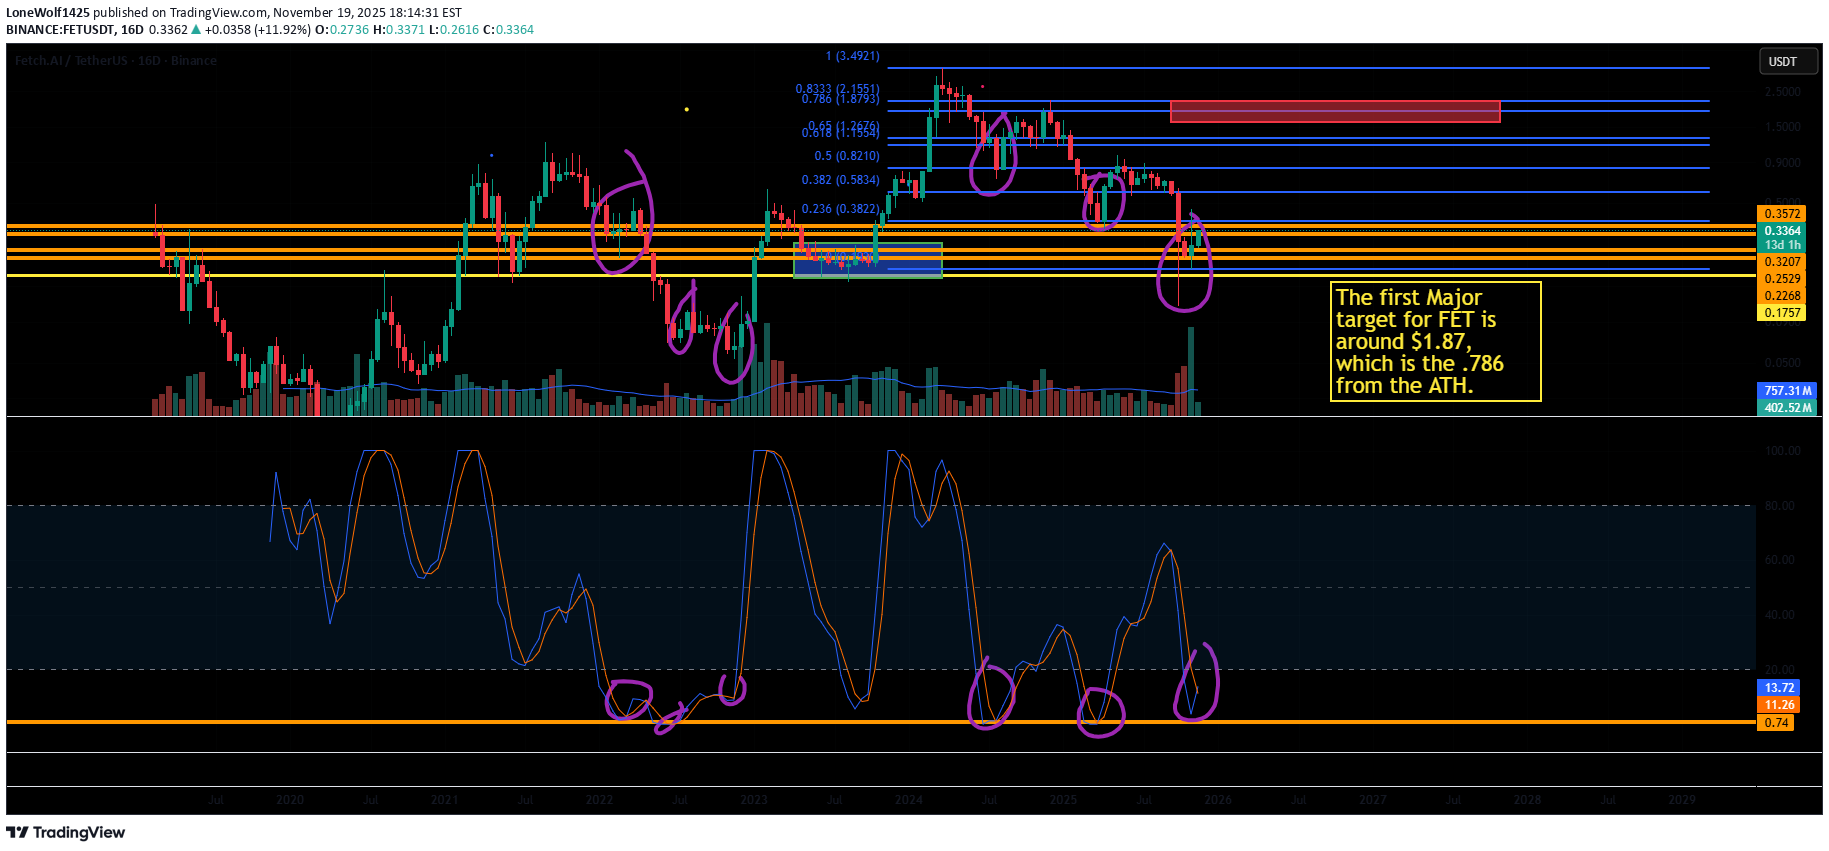
FET has re-done a bear market bottoming pattern again, and everyone is scared by BTC flashing bear market signals currently. Even if BTC is going into a bear market, there will be a nice bear market counter-trend rally coming very soon most likely. I do think that altcoins will finish a bull market during that at the very least. We should have a nice solid 2 months of bullish price action for altcoins. So, in each of its bull markets so far, FET has went straight to the .786 from its previous ATH off of its bear market bottom. This currently sits around $1.87. Then, if we do continue to get a bull market for altcoins at least - FET will do a .50 fib retrace off of the move from the bottom to the .786, which will land it around .60 cents. I will be risking some of my profits there if this works out as planned within this idea. I will talk about the full blown bull market targets in another idea once we get more date in the next couple of months. Thank you!
LoneWolf1425
الگوی تکراری کف بازار خرسی فِت (FET): چرا این ارز دیجیتال به اوج میرسد؟
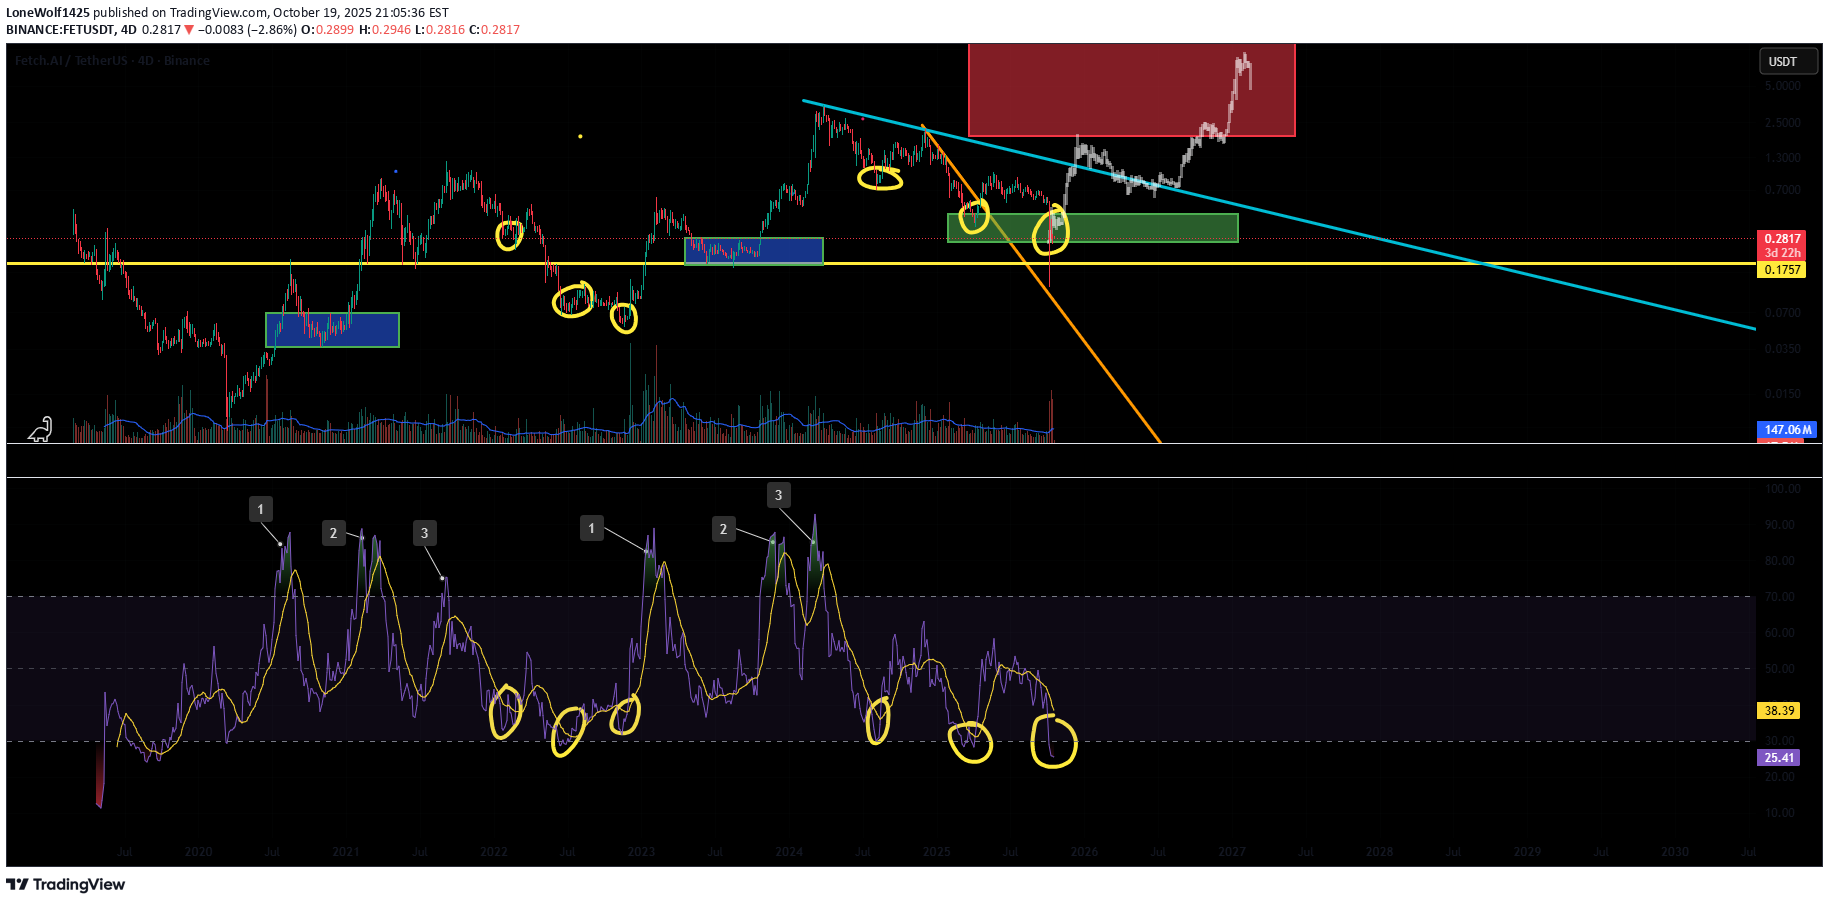
To me, FET is repeating a bear market bottoming pattern now. We are on the 4D chart. As you can see from the previous market cycles, FET shoots up sharply from its market cycle bottom. It then does a .50 fib retracement of the move off of the market cycle bottom, and establishes a strong level of support. These areas can be seen in the light blue boxes: Sep 2020-into Q1 of 2021, and then in May of 2023 - October of 2023. When you look at what FET does in each of its market cycles; It bottoms right in that first area of support that we just discussed. When you take a look at what FET just did, it actually fell into that area of support that we established off of the 2022 market cycle bottom. That is, the level of support that we formed from May - Oct of 2023. We also have a repeat pattern on the 4D RSI. The 4D RSI will have 3 heavily overbought waves during its bull market, and then 3 heavily oversold waves during its bear market. We just completed a 3rd oversold data point on the 4D RSI for FET. This occurrence and the last occurrence both formed an inverse head and shoulders pattern on the 4D RSI. We're actually in an extended period of bearishness for this FET bear market, too. We took a bit longer since we did a premature 200-ish percent bounce off of the bottom in April. With the Bitcoin dominance chart not having completed a market cycle of its own - I do think that altcoins will still have a nice run within a lengthened cycle for the first time ever. There are more repeat patterns, but I just don't have the time to discuss them right now. Thank you!
LoneWolf1425
الگوی تکراری کف بازار خرسی فچ (FET): آیا صعود بزرگ در راه است؟
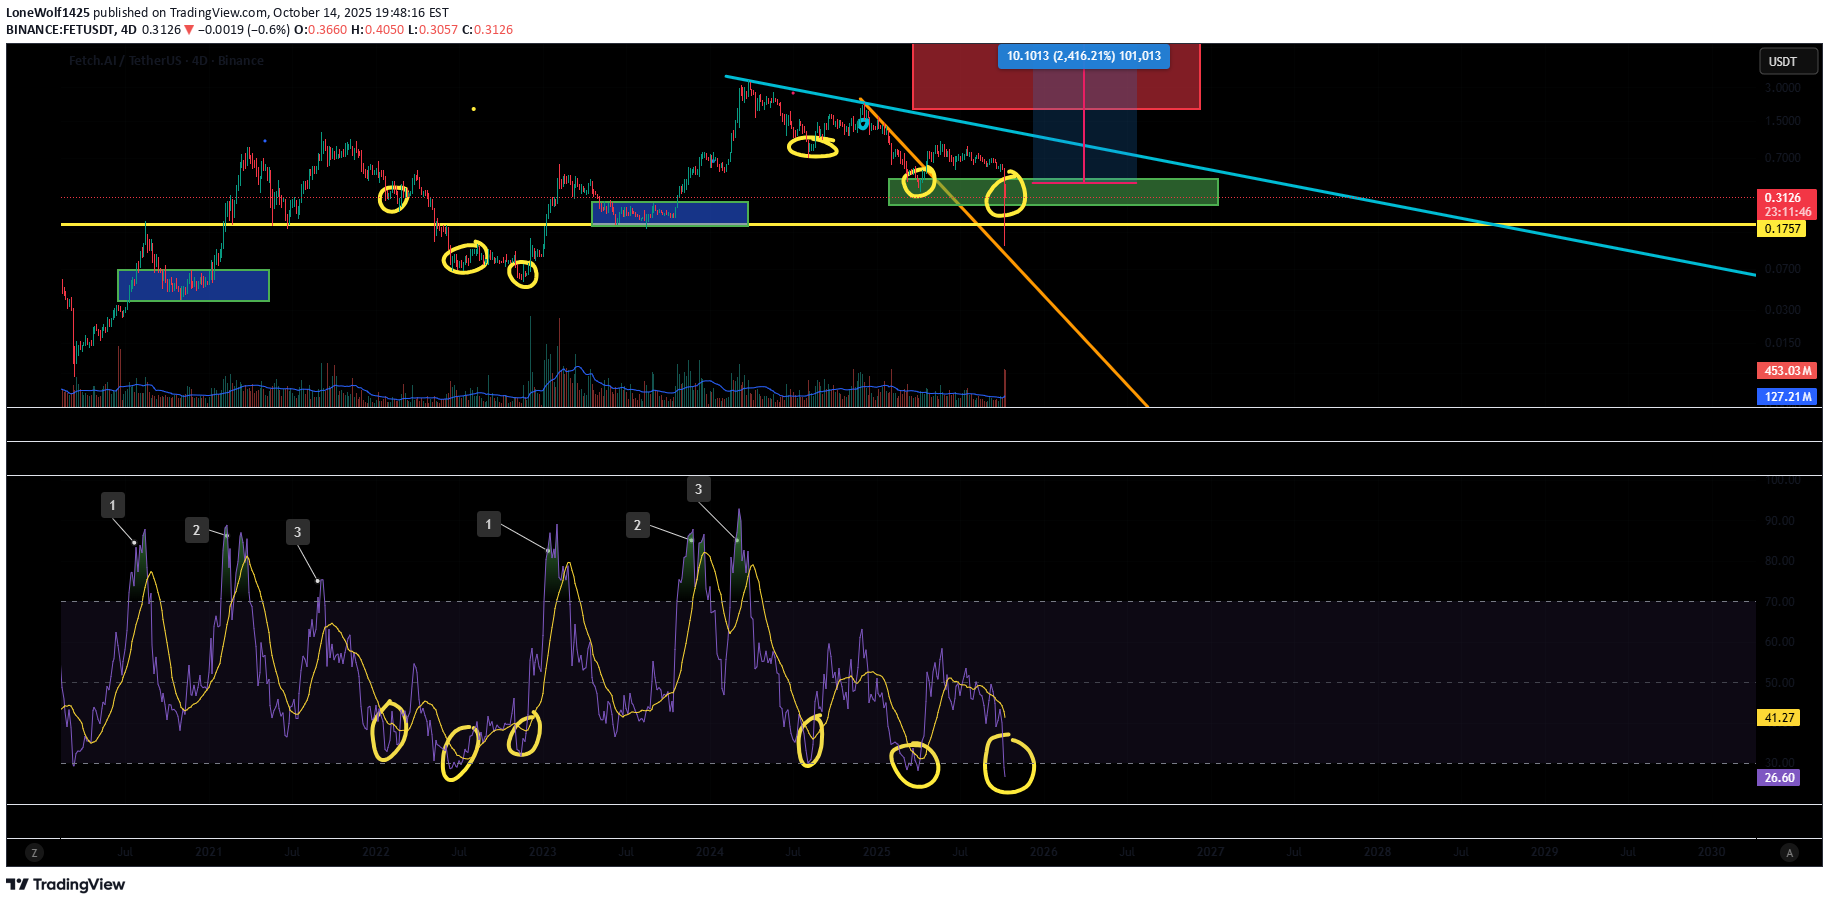
To me, FET is repeating a bear market bottoming pattern now. We are on the 4D chart. As you can see from the previous market cycles, FET shoots up sharply from its market cycle bottom. It then does a .50 fib retracement of the move off of the market cycle bottom, and establishes a strong level of support. These areas can be seen in the light blue boxes: Sep 2020-into Q1 of 2021, and then in May of 2023 - October of 2023. When you look at what FET does in each of its market cycles; It bottoms right in that first area of support that we just discussed. When you take a look at what FET just did, it actually fell into that area of support that we established off of the 2022 market cycle bottom. That is, the level of support that we formed from May - Oct of 2023. We also have a repeat pattern on the 4D RSI. The 4D RSI will have 3 heavily overbought waves during its bull market, and then 3 heavily oversold waves during its bear market. We just completed a 3rd oversold data point on the 4D RSI for FET. This occurrence and the last occurrence both formed an inverse head and shoulders pattern on the 4D RSI. We're actually in an extended period of bearishness for this FET bear market, too. We took a bit longer since we did a premature 200-ish percent bounce off of the bottom in April. With the Bitcoin dominance chart not having completed a market cycle of its own - I do think that altcoins will still have a nice run within a lengthened cycle for the first time ever. There are more repeat patterns, but I just don't have the time to discuss them right now. Thank you!
LoneWolf1425
ETH - kiss of death repeating pattern confirmed - now what?
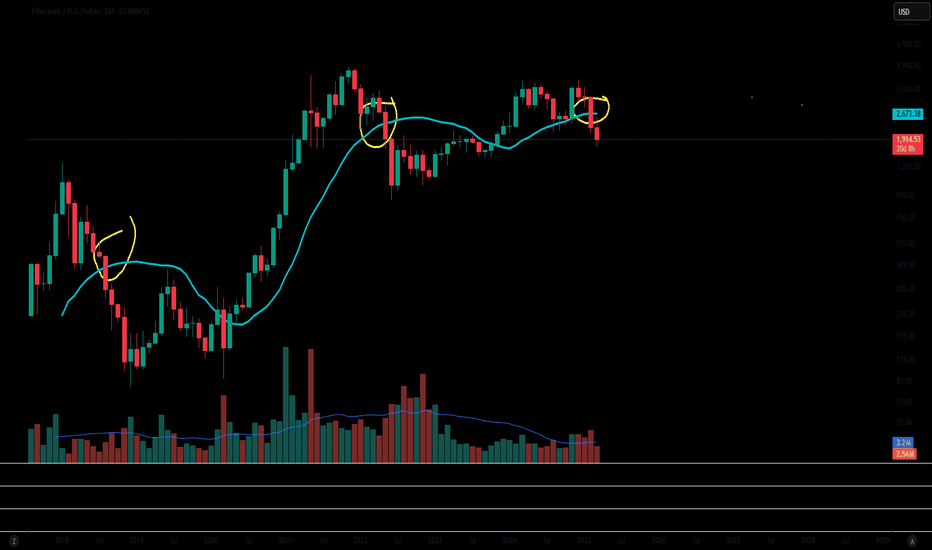
Fact: Every time in history that we have closed a breakthrough candle on the monthly chart through the 21 SMA on ETHUSD, we have entered a bear market. Fact: We did just that with February's monthly candle. The same exact pattern has repeated 3x already. Will this be any different this time?
LoneWolf1425
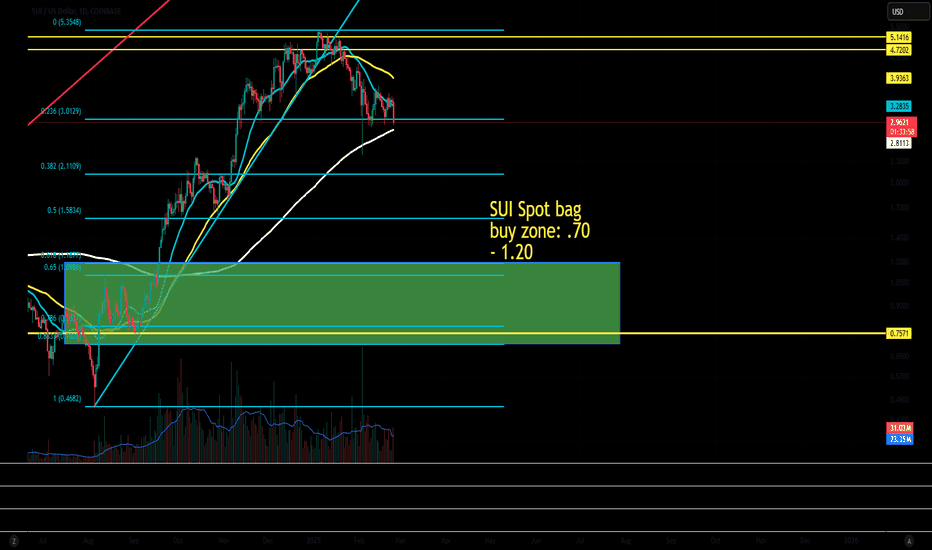
SEI - good long zone, needs to flip .26 as support

SEI is in a great zone of interest right now under .26 cents. If we can break the blue downtrend, and build .26 cents as support, we might have something here. The next milestone would be building .33 cents as support. Right now SEI is a good swing trade to .26 cents, and .33 cents. If we actually do get a moonshot from SEI, then I see anywhere from 1.80-ish to $3.85 as a nice super bullish profit taking zone. That's thinking ahead to later this year if BTC didn't already put its top in. That's all for now! Thank you!
LoneWolf1425
FET: 5H Morning Star, dbl bottom. Trade to $1.40ish.

We finally have confirmation candles on our short term base for FET. I have 3 profit taking zones up to $1.40 on here. Only have your stop/loss giving you a 2% at the most loss each trade! Thank you!
LoneWolf1425
LoneWolf1425
PENGU Update: Not looking as good.
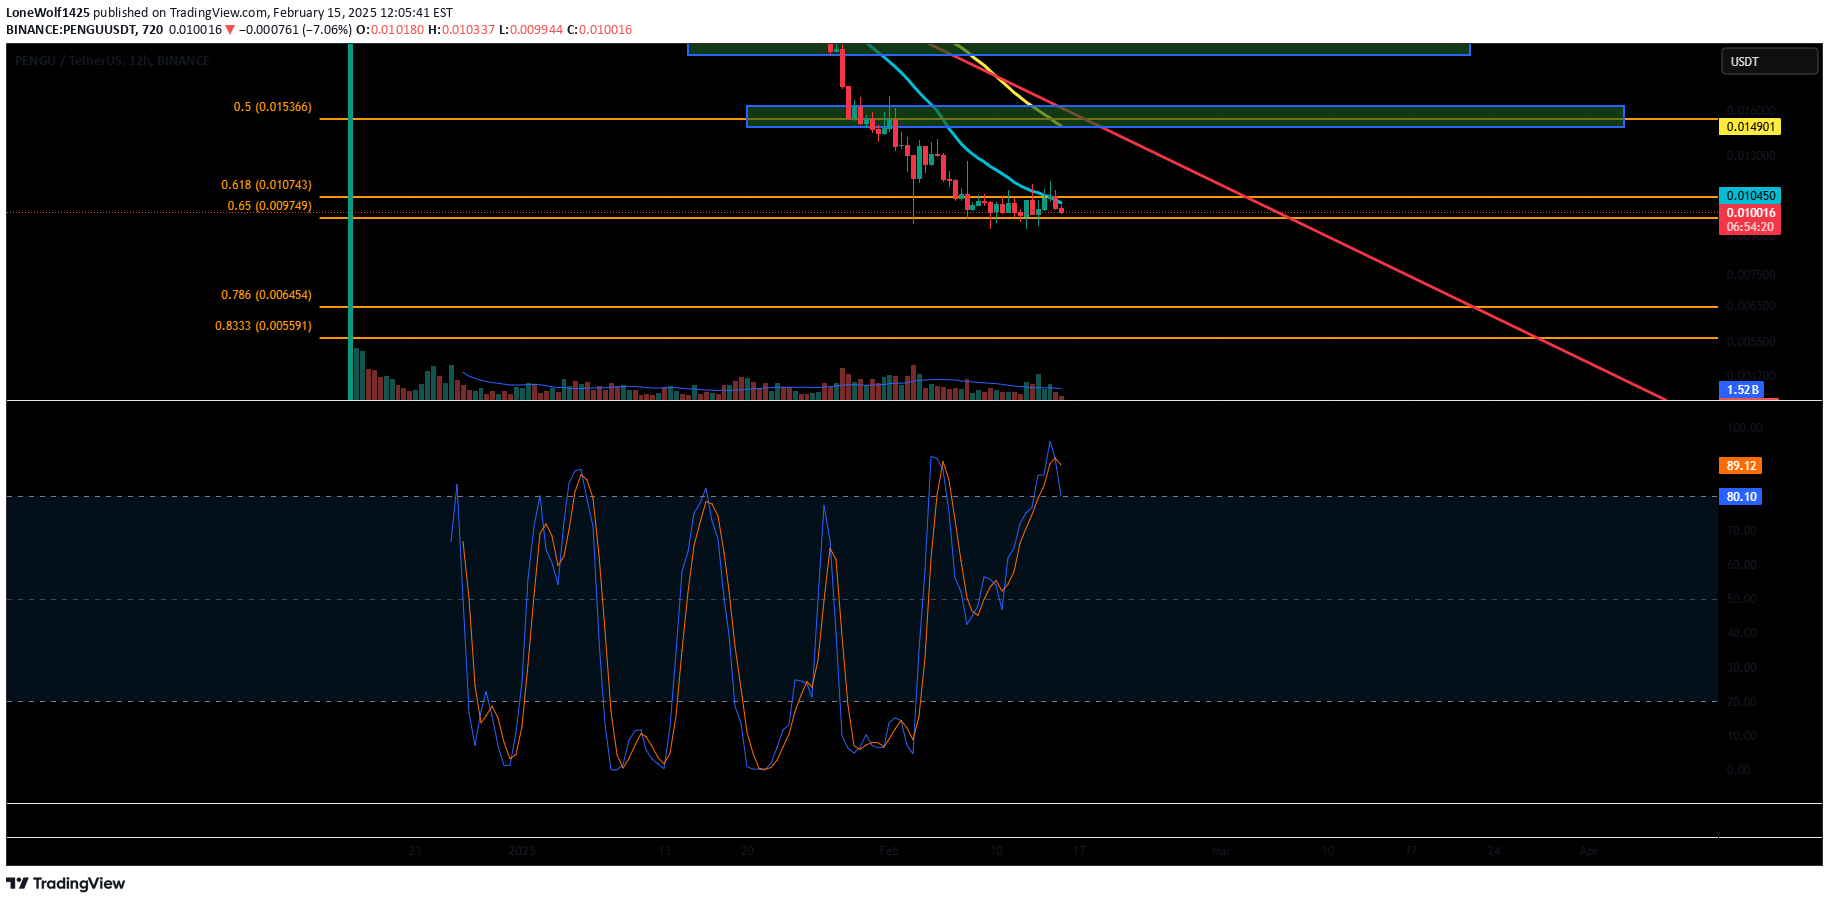
I was hopeful for a nice rally from here, but PENGU is now looking quite questionable after its failed breakout. It has room to make it to the next fib level down which is the .786 pocket if it wants to. That is from .005591-.006454. We could still pivot from this area, but I wanted to post this because I called a long from this area, and now it is looking a lot more grim after we got reversal candle on the 12H, followed by a confirmation candle. That is strong for a new coin that is in a downtrend. Thank you!
LoneWolf1425
Long PENGU - try to get it to risk free
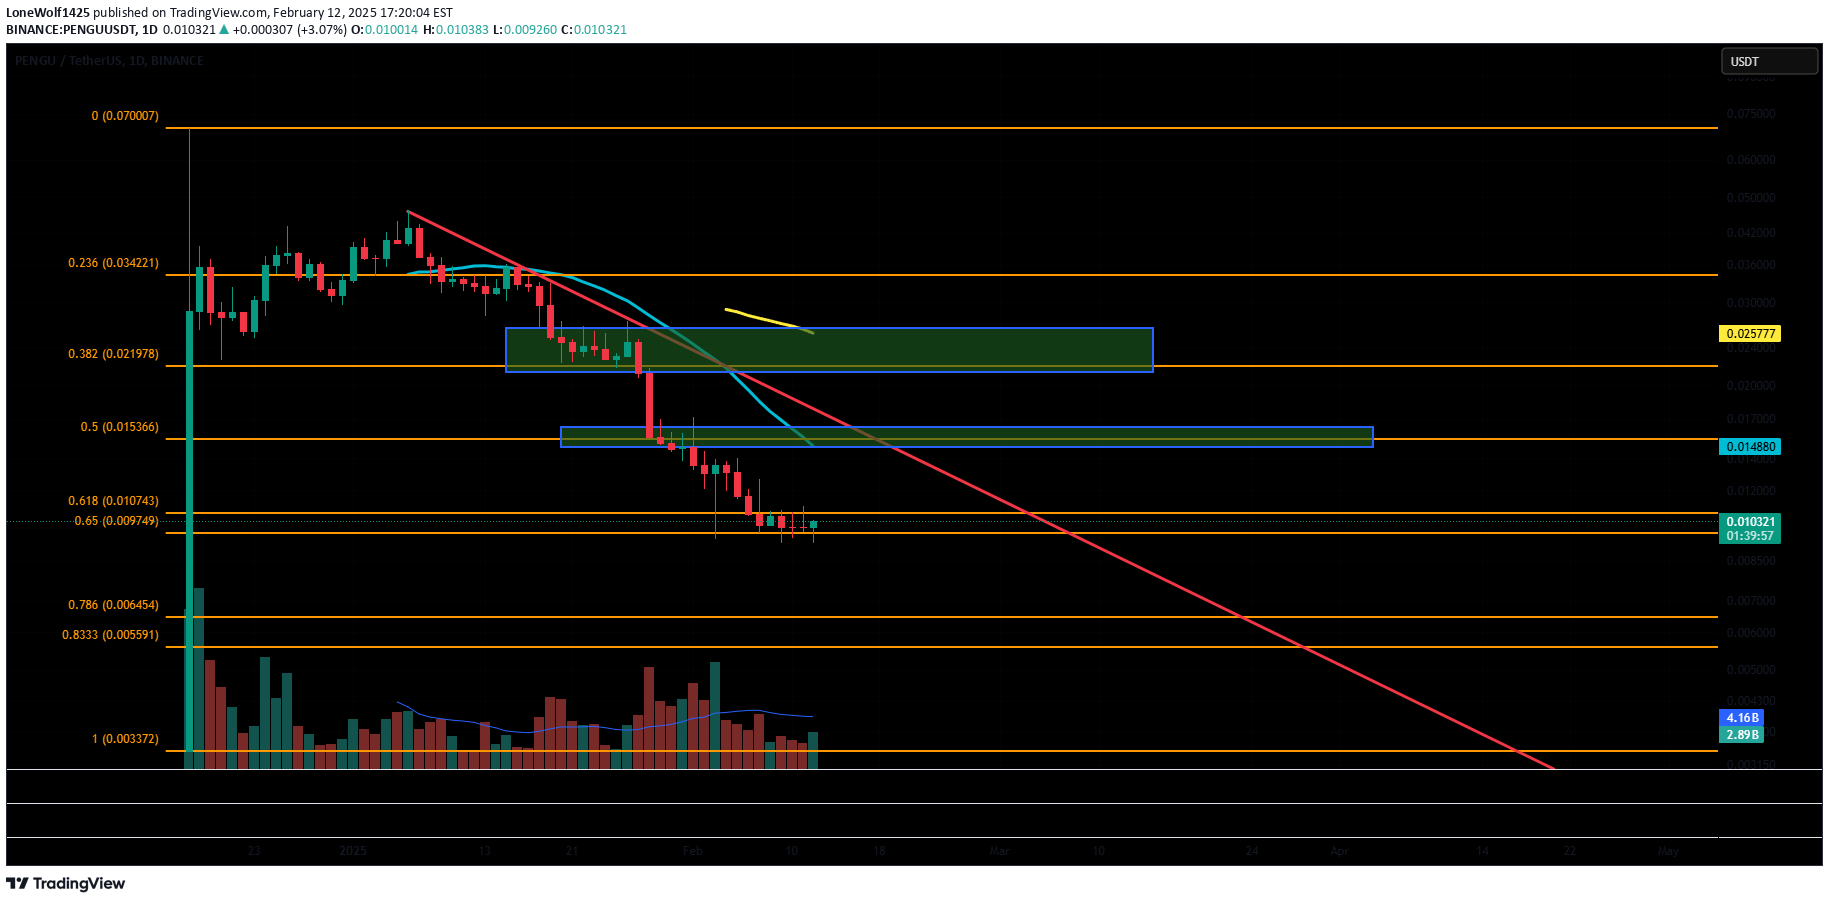
PENGU I think may be ready to go. It has been accumulating in the .618 pocket for a few days now. It was just freshly listed on Coinbase. The daily RSI has been chilling around 24. This is building a lot of pressure. Ideally grab it while it is still in the .618 pocket up to .0107 cents. Stop/loss just below the latest swing low. I would take profits at the 2x green boxes if we can make it there. First TP area is .0148-.0163. Second TP is .0213 - .0265. We need to break that red downtrend and hold it as support to do any sort of serious movement. There are of course more upside targets, but the focus for now is getting this to risk-free. Thank you!
LoneWolf1425
BTC - likely scenario

Just some thoughts on BTC: This bull market has seen a lot of choppy side-ways corrections. I think that we finish one out here, too. If we survive 92k again here, I think that we can possibly do another fake-out to the upside, perhaps slightly overshoot our current highs or match them. Then we would yet again go and hit the bull market trendline that has been tested 3x already. The same bull market trendline where the corrections have landed each time for this cycle. Then we would head toward the BTC top later this year, where we would then have our alt season into the BTC top.
Disclaimer
Any content and materials included in Sahmeto's website and official communication channels are a compilation of personal opinions and analyses and are not binding. They do not constitute any recommendation for buying, selling, entering or exiting the stock market and cryptocurrency market. Also, all news and analyses included in the website and channels are merely republished information from official and unofficial domestic and foreign sources, and it is obvious that users of the said content are responsible for following up and ensuring the authenticity and accuracy of the materials. Therefore, while disclaiming responsibility, it is declared that the responsibility for any decision-making, action, and potential profit and loss in the capital market and cryptocurrency market lies with the trader.