
Kriptomandala
@t_Kriptomandala

What symbols does the trader recommend buying?
Purchase History
پیام های تریدر
Filter
BTC Downtrends Continues

BTC Downtrends Continues Hello everyone, I will try to write my thoughts about BTC and other high volumes when I am available. If you share your comments and requests with me, we can share our thoughts with other analyzes in a more motivated way. In the chart; - Outside of the yellow colored areas, I expect sharp movements in the price. - The orange and purple gann lines are important. If the price stays below, sharp pullbacks can be seen. - The Area 1 move will not be completed unless we can go above $28340. - Area 2 movement starts below $20000 and below the yellow area is the risky area. - Although the green 2Ma support works as a support in March, it may not be strong in the pullback again. I wish everyone a positive life. Thanks.
BNB Geniş Spektrumda Güvenli

BNB yi her zaman BTC hareketlerinde takip etmek gerekiyor. Kısaca görünümü özetlersek;BNB 147$ - 692$ bölgesi aralığını temel bölge olarak kabul ettiğimde sarı renkli destek bölgesi içinde hareket ettiği sürece hareket yatayda %40 değişim ile devam edecektir. 266$ - 383$ Sarı destek bölgesi geniş bir aralık gibi gözükse de bize güvenli bir trade imkanı sağlayacaktır.BTC nin 26K seviyesini tekrar denemesi ile 298$ seviyesi ile tekrardan bir yükseliş hareketi içine girebilir. İleride ki dönemde BTC dip hareketini beklediğimden aşağıda 180$ bölgesini bir kenarda tutmayı planlıyorum.266$ altına sarkmadığı sürece sert geri çekilmelerin gelmesini beklemiyorum. 266$ kırılımı ile aşağıda turuncu gann çizgisi ve 205$ seviyelerine doğru bir göz kırpma görülebilir.383$ geçilmedikçe yükseliş için herhangi bir görüşü benimsemem.Bir süre aza tamah edip güvenli seviyelerle işlem yapmak her coinde konforlu olacaktır.Herkese pozitif bir yaşam dilerim.12 Mayıs analizinde belirttiğim 266$ altında ki kırılımda 205$ seviyesine bir hareket gelebileceğinden bahsetmiştim.205$ seviyesine iğne sonrasında tepki alsa da aşağıdan gelen turuncu kesikli çizgi ye dikkat edilmeli. Turuncu çizginin kırılımı gerçekleşirse aşağı da ki dip bölge hareketi BTC'nin çekilmesiyle harekete geçecektir.205$ alım sonrası tepe bölge satış hedefi 690$ gerçekleşti ve işlem kapatıldı. Henüz açık işlemim yok ama izlemeye devam ediyorum.
ETH 2000$ Altında Güvende Değil

ETH için görünümü önce kısa vade ara destek bölgeleri ve ardından genel görünüme geçiş yaparak değerlendirmek istiyorum.ETH sarı renkli destek bölgesi aralığı 2000$ - 2808$ aralığı altında kaldığı sürece kanal alt desteği 1152$ seviyelerine doğru göz kırpmaktadır. Bulunduğu bölgede 1720$ altında kalmadığı sürece bu düşüşü erteler. 1824$ üstü harekette ise tekrardan direnç bölgesine doğru bir hareketin aralıklarla tetiklenmesi gerçekleşir.Ara Destek 1 bölgesi altında kalmak aşağı yönlü hareketi, üstünde kalmak ise tepe direnç bölgesine götürecektir.Genel görünümde mor renkli gann çizgisi değeri bugün 1670$ seviyesindedir. Bu değer altına sarkması satış baskısını arttırmaktadır.Kısaca Görünümü Özetlersek;Mor gann seviyesi altında kalmadığı sürece sert hareket beklenmemeli.Gann kırılımı ile Trend Hattı 1 çizgisine yaklaşması durumunda trend üstündeki hareket takip edilmelidir.BTC nin sert geri çekilmesi yani 20K seviyelerine doğru bir hızlı geri çekilmesinde bu trend kırılımı ciddi önem taşımaktadır.Uzun dönemde her 3 4 senede gerçekleşen dünya düzeni üzerinde ki ani gelişen olaylara karşı aşağıda 750$ ve 580$ aralığında alım yakalamak ileri ki dönem için iyi bir fırsat seviyesidir.Herkesin huzurlu pozitif bir yaşam geçirmesini dilerim.Görünüm BTC ye bağlı olarak hala negatif görünümde ama Turuncu gann seviyesine dikkat edilmesi gerekiyor. 1500$ 1478$ bölgesine bir düşüş hareketi görülebilir.BTC de aşağı yönlü hareketin zamanla geleceğini beklediğimden aşağıda belirttiğim dip bölgeler için hala zaman gerekiyor.2 yılda sadece 2 işlem ve gann çizgisinde 3. kez temas ettik ve 1855$ kritik seviye üstünde kalamazsa ve mor gann altında aylık kapanışta dikkatli olmak gerekiyor.
Beklenen Zaman Dilimi Geldi

I drew attention in my previous sharing May 12 We approached the history. The withdrawals underneath have accelerated and the market will only be shaped according to the future movement. Although there is a decomposition in some coins, we are in a risky time range in general. As a total volume, the market volume has a negative appearance. In the A1 region movement, the blue zone has been important for months as a risky region of $ 400, $ 400. It will give us clear signals to remain under or above this area. You can interpret the situation I explained in the A1 region in the same way in A2. Two levels can give you ideas in terms of making you convenience in my sharing. Upper value at 4h closes above green line value You can interpret it as a movement to the support level at 4H closes under red value. I wish everyone to have a pleasant weekend. Stress -free positive life.4H closing is below 27261 below $ 2 for the first time after a hard decline movement can come into the area we have entered into the region now everyday closing here will show us the situation tomorrow. For a while, the blue zone will work as support. We have entered into the blue zone. Unless the closing of 4H below $ 27260, there may be an upward movement attempt. The $ 27675 level is an important level of resistance for now. Staying under the blue zone this time A2 at the level of $ 25587. As long as the A1 Blue Area cannot enter the Blue area, movement into the A2 region can be seen by paying attention to $ 26611.
BTC Kritik Seviyede Haftalık Kapanış Dikkat

BTC I wanted to tell you about the work I have followed for a long time by summarizing you in a new video. If we briefly summarize the situation according to the gann and fib levels I follow; $ 20000- I will try to sit down according to the weekly closing of the $ 20300 zone movement According to the work of the past gann, I think that there is a time in which the movement should be cautious. I would like you to watch my evaluation and present your own ideas as a comment. Take care of yourself. Silicon Valley Bank's scenario with news until the morning can cause a positive start in the US markets tomorrow. $ 20300 $ 20300 $ closed the day from the channel to the top of the channel. The gradual rise in this type of full algorithm makes me a little uneasy. We still move in the falling channel movement, and the bottoms of the BTC so fast can not naturally react quickly. In the withdrawal, it shows more harsh movements. Not to go below $ 21350 and we stay above $ 22000, that is, we are away from the yellow area and the channel breakage can be moved to orange and purple gann levels. With the opening of the US stock exchanges, we will learn which direction will be in the direction. We are moving in the channel, but as long as we stay on the yellow zone, some intermediate jumps can be seen, but after entering the region should be taken into consideration. We said that we can not do the weekly closing for Purple Gann and again that purple line is around $ 24050 today. We are entering a very critical area at the beginning of the week. It will be a long week. Tomorrow Fed statements after the European Central Bank may not give us comfortably. I will present you two different opinions. 1) Resistance levels in the continuation of the daily rise. 2) Until the monthly closing BTC Dominance previously previous region work. 1- First of all, let's look at the critical hill areas in the general daily view. 2- Now I will share an appearance to be considered. In June 2022, when Dominance was working over the region in the first image below, this upward break movement, then more harsh withdrawal, allowed him to come into the region. Thus, the monthly closing was in the region. Now let's look at my monthly look. This breakdown movement came back in the last week of the month to close in the region. I share the monthly view below. I pay attention to the monthly closing value. When I copied his movement to the Purple Gann line from the bottom of the channel on February 16, this purple Gann Tepe work was again with a similar rise. Towards this weekend and monthly closing, this similarity will return to a difference. The price has reached two resistance levels in the yellow zone. Two of the resistors have passed the last most important level of $ 28355. With a weekly closing above this, 30K is expected to sell down the 31k hill. Monthly closing will be very important. Be cautious. There is still a serious rise in dominance, the harsh retreats can get a lot of wound. If the closing of 4 hours over $ 28355, $ 29347 and $ 29980 yellow area should be taken into consideration. I shared on the graphic graphically progress. I am waiting to see more by the end of the month. We are in a safe area within the A1 area. The Blue Zone Hill has worked temporarily, but it should be paid to the $ 26600 zone. Even though it decreases to the level of $ 27260, and then the support is re -rising, I think the downward movement will continue gradually. This weekend can be closed with a bottom work at the level of $ 26600.4h as long as the graph can not remain above $ 27675, the A2 should be taken into consideration.
Enjin Orta Vade Projeksiyon

Hello, With a new sharing, I will simply share my idea without confusing them. Color in the graph Gann Since the values of my lines change day by day, I will share the updates about these data as I do in other ideas as a comment under the idea. What I have written below will easily help you adopt the idea. Horizontal line Among the channels seen yellow It will give the most basic idea to pay attention to the regions I share in color. Yellow At daily closures on the upper limit value of the region top duct targeted. Yellow If the region remains below alt limit value, the following is below. horizontal line Target position. In the form of a cut line in the upward direction Gann If we approach their levels, these levels will serve as resistance. In January purple colored gann As a result of breaking, we saw the movements in the upward direction. Downward Gann The lines will work in support. It can be said in the idea that the withdrawal will accelerate if it remains under it. Medium maturity $ 0.5686 Our sales level is before the intermediate resistance channel closes $ 0,6280 level and then $ 0.7130 level can be targeted. In every withdrawal yellow As long as it does not enter the region, active movement should be expected in the upward direction. In the downward movement $ 0.4950 If it falls below the level, first orange gann Our line and then purple The colorful line will work as the basic support level. $ 0.3950 is the basic level of support. If the BTC can not break the falling Gann level this week, some coins may enter the withdrawal period. I wish everyone a pleasant life. Obstetric Gann Break and the downward hard drawing with the purple line should be paid attention to the level of $ 0.3947. BTC As the decrease harden, the yellow zone is the support area below. Now we can target the decline in BTC up to the basic support zone. Purple Gann on top of the comfortable position should not be taken. In order to stand strong before the ascension, it should be taken care of daily and especially weekly closing above $ 0.3947. The movement over $ 0.3947 puts us into the upper area that will lead us to $ 0.7. I expect a new bottom to work if it falls below the levels I have mentioned as the basic support zone below. $ 0.5 GANN level and the first theme of the yellow resistance zone took place. It will be risky to expect it to move up without permanence in this yellow area.
AVAX Destek Bölge Sonrası Projeksiyon
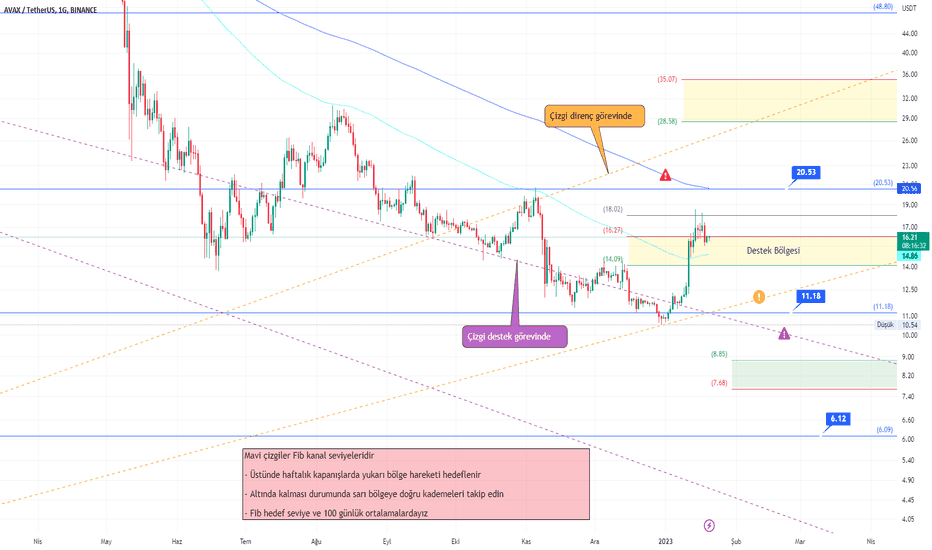
If we briefly summarize the appearance for AVAX; Orange via line support $ 10.50 The exit movement is still in progress. Found yellow As it moves in the region, it will try to stand strong in the small decrease of BTC, but it is likely to break down in this region when BTC has hard withdrawal. $ 16,27 yellow The first target after passing the upper value of the region $ 18.0 and then $ 20.50 I have mentioned their levels in the past sharing before. I wanted to share the movement in this region under another idea because the downward BTC movement was postponed for a while. Yellow in the upper movement blue colourful 200 It is useful to follow the daily average. 200 Even if the closing above the day is not yet 100 It is positive that we stay above the average daily. Yellow If the region is broken downward $ 13 And $ 11,20 The level will be the target. In case of a very harsh fall, as I mentioned in my previous idea sharing, below green A sagging can be seen up to the region range. Please pay attention to orange and purple -colored cut lines will work as resistance and support according to the location. I wish everyone a positive life. As long as it remained on the support zone and due to the lack of withdrawal of the BTC. After closing above $ 20,53, $ 25 and $ 28 can be targeted. The only issue to be considered is that BTC is now approaching a critical region. Below is the 200 -day average and support zone in the forward term. Unless the alt limit of this region is less than $ 14, the top movement in this region can be targeted again. The situation will be shaped according to the decrease of BTC. The $ 13 level opens the front of the hard sales pressure, especially if it hangs under critical. Orange gan breaks took place in a risky period signal.
Compound (COMP) Orta Vade Projeksiyon

BTC From the beginning of January with the rise period of all coins, such as the rise in the rise. The blue line will come up with more accelerated up movements after the weekly closing above the 200 -day average. It will gradually put itself on the level of $ 62.67 on this level. If the movement is spread here in the range of $ 53.64 - $ 62.67, we can still accept the upper regions target. Alt I have colored the areas where it can hold on the targets yellow. Below are the intermediate support zone. The importance of permanence in the region is great if the closing in this region and the average can be thrown on it. As the significant decrease deepens in this region, it is necessary to predict that the movement of the purple gann line will continue below. A critical support level of $ 33.72 can be seen in the case of a 29,604 level bottom work if it is broken. Below, we have another area against the harsh movements of BTC. Purple Gann level should always be noted aside. I haven't updated since May, but in July, it has reached the target area. $ 29.5 is an important level in the downward movement of BTC, although the $ 29.5 region is supported if it remains under this region.
EGLD Orta Vade Projeksiyon

Her projede olduğu gibi EGLD de yılbaşından itibaren yükselişini sürdürüyor.Bu görünümü ve senaryoları değerlendirirsek;Öncelikle 41,27$ üstünde yani kritik bölgenin alt değerinin altına inmemesi önemli. 41,27$ - 48,80$ aralığında yataya yayılması yükseliş için olumlu bir altyapıyı sağlar. Bu bölgede turkuaz renkli 100 günlük ortalama üstünde haftalık kapanış sonrası yukarı yönde hedefleri daha rahat konuşabiliriz.Sarı kritik bölge altında kalınması durumunda ise 38$ ve altında tekrar 33,65$ hedeflenmelidir.Dikkat edilmesi gereken bir başka konuda turuncu ve mor kesikli çizgiler yerine göre direnç ve destek görevi yapabilirler.Herkese pozitif bir yaşam dilerim.Kritik aralık içinde haftalık kapanış sonrası takip edilmeli.Haftalık kapanış sonrası yukarı hareket devam etti ve şimdi 46,8$ seviyemiz yeni hedef. BTc nin hareketinde geri çekilmemesine bağlı bu yükseliş.Kritik bölge tepesi 46,80$ seviyesine ulaştık. Sarı bölge içinde kaldığı sürece tekrar yukarı hareketi zorlayacaktır. 10 günlük ortalama üstünde kalabildik ve bu yukarı hareketinde devamlılığını getirecektir. BTC de geri çekilme olmadığı sürece sarı bölgede kalmak ileri de 51$ ve 57$ seviyelerini getirecektir.Kritik aralık içinde devam ediyoruz. BTC kritik bir bölge içinde ve kendisini yukarı atamaması durumunda burada da alt bölgeye kadar geri çekilme gelebilir.Bir süre BTC ye bağlı olarak analiz edilmeli.52$ Fib seviyesi ardından kritik aralık altına sarkmamızla beraber aşağı yönlü hareket devam ediyor. Şimdilik 33,66$ seviyesi en kritik değer ama BTC nin haftalık kapanışına dikkat etmek gerekecek.Kritik aralık altında kalarak önceki dip seviye olan 33,66$ seviyesine doğru yaklaşıyoruz. 26K altında ki kapanışlar bizi aşağıda ki sarı bölge 31$ seviyesine doğru çekecektir.Beklenen 22$-26$ aralığında ki bölgeye giriş yaptı. Uzun süredir bölge hareketine girene kadar paylaşımda bulunmadım.Bu alan içinde turuncu gann hareketine dikkat edilmesi gerekiyor. 24$ altında belki bir çalışma ile 22,4$ bölgesi test edilebilir. Turuncu çizgi üzerinde kalmamız önemliTepe bölgede aynı şekilde mor renkli gann hareketine dikkat edilmesi gerekiyor.Diğer Mina coin'de olduğu gibi 2 yılda yine 2 kez alım satım işlemi yaptım. Sarı bölgeden alım ve tepe Fib hedefi 57 satış.Acele etmeden 15,8 seviyesini test edip etmeyeceğini görmek istiyorum. Gelmesi durumunda alım için emrim bekliyor ama haftalık kapanışın altında kalması durumunda BTC'nin sert işlemlerinde alt sarı bölgesine kadar sabırla beklerim.
Tezos (XTZ) Orta Vade Projeksiyon

One of the coins that continued to leave as of January 1 was Tezos (XTZ). If we evaluate the scenarios on this output movement; $ 0.950 and $ 1,080 If it is spread to the bed in the range, the bottom of the channel below $ 0.750 and Kanal Hill $ 1.35 It will show us that it is in accumulation in the range. In this output movement $ 1.08 We saw rise to our fib level and turquoise It reached a 100 -day average. This is 100 days turquoise After the weekly closing above the colorful line, we can keep the top targets active. Before a turquoise Let's throw it on the line. In the downward movement $ 0.940 If it remains under me again $ 0.750 I expect to retreat to the level. Therefore yellow It will give us confidence that it remains in the region range and the movement in the horizontal. Shown with cut lines purple and orange Pay attention to Gann lines. Resistance can serve as a task of resistance. This recently $ 1,20 corresponds to the level. The next week will be on vacation for the New Year celebrations, and if the rise in the US stock exchanges returns during that time, it may be likely to see a decrease on the BTC side. I wish everyone peaceful sleep and positive life.1.17 $ $ $ 1.19, but after this region, the actual movement should be expected. If it remains above the $ 1,1920 level, the $ 0.257 level can be considered as a critical resistance zone. As long as it does not hang under the purple line, the upward movements will continue. We act within the yellow support zone with purple gann breakage. 0.940 $ should be taken into consideration, if it hangs under the cautious approach for a while. $ 0.852 $ will want to test the blue levels below with its current stop and deepening. If the peak value of the yellow area between $ 1,750 and $ 1,354 remains $ 1 above $ 1, the movement is expected to move down if the yellow zone remains below $ 0.941. It is currently moving in the blue zone. This dar In the blue area, unless 4 hours of closing under the $ 0.885 zone, the closure of $ 0.906 and the purple gann level will be 0.941 $ 0.941. This appearance is the priority indicator for XTZ, but it will increase sales pressure for every closing decrease in which BTC remains below $ 27260. The appearance of the BTC should not be ignored when processing. In BTC, the downward movement can be targeted as the downward movement continues. Since the initial price falls below the price, I will need to update the graph again in the opposite direction, but the basic values I shared below should be paid attention. Now pay attention to $ 0,577 and $ 0.492 in the area between $ 0.380. Under $ 0.492, the target is now the task of support in a hard sales movement of $ 0.380. BTC The main indicator is all coins without breaking critical resistance zones. Enjoyable weeks to everyone.
Disclaimer
Any content and materials included in Sahmeto's website and official communication channels are a compilation of personal opinions and analyses and are not binding. They do not constitute any recommendation for buying, selling, entering or exiting the stock market and cryptocurrency market. Also, all news and analyses included in the website and channels are merely republished information from official and unofficial domestic and foreign sources, and it is obvious that users of the said content are responsible for following up and ensuring the authenticity and accuracy of the materials. Therefore, while disclaiming responsibility, it is declared that the responsibility for any decision-making, action, and potential profit and loss in the capital market and cryptocurrency market lies with the trader.