
KironKavanagh
@t_KironKavanagh

What symbols does the trader recommend buying?
Purchase History
پیام های تریدر
Filter
KironKavanagh
A comprehensive Analysis on XAUUSD

Chart 1: XAUUSD H1 (1-Hour Timeframe) •Wave Structure: The chart shows a correction after the completion of Wave (i), followed by a corrective Wave (ii), which is a typical Elliott Wave pattern. •Entry Point: The price appears to be in the early stages of Wave iii, suggesting that entering a long position at the current level could be beneficial. •TP: The target for Wave iii can be set near the 2650 level, corresponding with the resistance level. •SL: A stop loss should be placed below the low of Wave ii, around 2364, to protect against a potential downturn. Chart 2: XAUUSD H4 (4-Hour Timeframe) •Wave Structure: The 4-hour chart shows the completion of Wave (ii) and the beginning of Wave iii of a larger degree. This suggests further upside potential in the medium term. •Entry Point: Consider entering a long position on a pullback to the 2400-2420 area, which aligns with previous support/resistance levels. •TP: The target for this trade could be set around 2560 to 2650, aligning with the upper resistance levels marked in the chart. •SL: A stop loss should be set below the low of the recent corrective structure, around 2364. Chart 3: XAUUSD Daily Timeframe •Wave Structure: The daily chart suggests the market is in a Wave 3 of a larger degree, which typically is the strongest wave in Elliott Wave theory. This indicates a potential continuation of the upward trend. •Entry Point: The daily chart also supports a long position on pullbacks, with entry around 2400-2420 as the price consolidates and gains momentum. •TP: The long-term target could be the 2650 level or even higher at 2750, aligning with the resistance and projected wave targets. •SL: A more conservative stop loss can be placed below the 2364 level, which represents a key support area and below the Wave ii low. Summary of Trade Ideas: 1.H1 Chart: Long position with entry around the current price, TP at 2650, SL at 2364. 2.H4 Chart: Long position on a pullback to 2400-2420, TP at 2560-2650, SL at 2364. 3.Daily Chart: Long position on pullbacks to 2400-2420, TP at 2650-2750, SL at 2364.
KironKavanagh
A complete analysis on XAUUSD

Chart 1: XAUUSD H1 (1-Hour Timeframe) •Wave Structure: The chart shows a correction after the completion of Wave (i), followed by a corrective Wave (ii), which is a typical Elliott Wave pattern. •Entry Point: The price appears to be in the early stages of Wave iii, suggesting that entering a long position at the current level could be beneficial. •TP: The target for Wave iii can be set near the 2650 level, corresponding with the resistance level. •SL: A stop loss should be placed below the low of Wave ii, around 2364, to protect against a potential downturn. Chart 2: XAUUSD H4 (4-Hour Timeframe) •Wave Structure: The 4-hour chart shows the completion of Wave (ii) and the beginning of Wave iii of a larger degree. This suggests further upside potential in the medium term. •Entry Point: Consider entering a long position on a pullback to the 2400-2420 area, which aligns with previous support/resistance levels. •TP: The target for this trade could be set around 2560 to 2650, aligning with the upper resistance levels marked in the chart. •SL: A stop loss should be set below the low of the recent corrective structure, around 2364. Chart 3: XAUUSD Daily Timeframe •Wave Structure: The daily chart suggests the market is in a Wave 3 of a larger degree, which typically is the strongest wave in Elliott Wave theory. This indicates a potential continuation of the upward trend. •Entry Point: The daily chart also supports a long position on pullbacks, with entry around 2400-2420 as the price consolidates and gains momentum. •TP: The long-term target could be the 2650 level or even higher at 2750, aligning with the resistance and projected wave targets. •SL: A more conservative stop loss can be placed below the 2364 level, which represents a key support area and below the Wave ii low. Summary of Trade Ideas: 1.H1 Chart: Long position with entry around the current price, TP at 2650, SL at 2364. 2.H4 Chart: Long position on a pullback to 2400-2420, TP at 2560-2650, SL at 2364. 3.Daily Chart: Long position on pullbacks to 2400-2420, TP at 2650-2750, SL at 2364.
KironKavanagh
Comprehensive Analysis on XAUUSD Using Elliott Wave Analysis

1. Short-term (H1 Chart): •Wave Structure: •The chart shows a completed five-wave impulse pattern, denoted as (i), with a subsequent correction likely underway, labeled (ii). •The first wave (i) consists of five sub-waves (i, ii, iii, iv, v). •The correction wave (ii) appears to be forming an A-B-C structure. •Fibonacci Retracement: •The correction wave (ii) is approaching the 23.6% retracement level, with potential support at the 38.2% level around 2291.674. •Indicators: •MACD: Shows a significant bearish momentum, indicating that the downward correction might continue. •RSI: The RSI is at 26, suggesting the market is in oversold territory, which might indicate a potential reversal soon. 2. Mid-term (H4 Chart): •Wave Structure: •The H4 chart depicts a more extensive wave structure, showing the correction wave (ii) of a larger degree. •The entire move from 9 April 2024 appears to be an extended impulse wave with a complex corrective pattern. •Fibonacci Levels: •The 38.2% retracement of the larger wave structure coincides with the 2291.674 level, providing a strong potential support zone. •Further significant levels include the 50% retracement around 2161.568 and the 61.8% level at 1988.706. •Indicators: •MACD: Extremely bearish, confirming the downward pressure. •RSI: At 24.81, indicating deep oversold conditions, hinting at a possible short-term reversal or consolidation. 3. Long-term (Daily Chart): •Wave Structure: •The daily chart illustrates a long-term bullish trend with a primary five-wave sequence completed and a corrective wave (2) following. •The structure indicates that the market is in wave 3 of a larger degree, suggesting a continuation of the upward trend after the completion of the current correction. •Key Levels: •The 38.2% retracement level of the entire upward move is around 2291.674, matching the mid-term and short-term charts’ key support. •The projected target for wave 3 is around the 2650.000 level. •Indicators: •MACD: Shows a bearish crossover, suggesting a continuation of the corrective phase. •RSI: At 44.91, indicating a moderate bearish momentum but not yet oversold, suggesting there could be more room for the correction before resuming the upward trend. Trading Strategy: Long Entry Points: 1.Short-term: •Consider entering long around the 38.2% retracement level (2291.674), watching for bullish reversal signals such as bullish divergence on RSI or a bullish crossover on the MACD. 2.Mid-term: •Accumulate long positions within the 2291.674 to 2161.568 range, focusing on the 50% retracement level for stronger support confirmation. 3.Long-term: •Strong long-term buy signals would be around the 2291.674 level or lower, especially if the price approaches the 61.8% retracement level (1988.706), looking for confirmation from MACD and RSI for a reversal. Stop-Loss Placement: •Place stop-losses below the 50% retracement level (around 2161.568) to protect against deeper corrections. Target Levels: •Initial target levels can be set at the previous high around 2560.000 and extend towards the wave 3 target of 2650.000 in the long-term.
KironKavanagh
Elliott Wave Analysis on Ethereum (ETH/USD)

Major Wave Structure 1.Primary Waves •W-X-Y-XX-Z: The chart begins with a complex corrective structure indicating a prolonged corrective phase. •1-2-3-4-5: Following the complex correction, an impulsive wave structure is apparent, suggesting the beginning of a new trend. 2.Subwaves •Each primary wave consists of smaller-degree waves, identified using numerical (1, 2, 3, 4, 5) and alphabetical (A, B, C) labels. Detailed Breakdown Corrective Phase (W-X-Y-XX-Z) •Wave W: Indicates an initial corrective phase, typically forming a zigzag pattern. •Wave X: A connecting wave that can take the form of a triangle, flat, or zigzag. •Wave Y: Another corrective wave similar to wave W. •Wave XX: Another connecting wave, similar in structure to wave X. •Wave Z: The final corrective phase in the complex structure. Impulsive Phase (1-2-3-4-5) •Wave 1: Initial impulsive wave marking the beginning of a new trend. •Wave 2: Corrective phase, typically retracing part of wave 1. •Wave 3: The strongest and usually the longest wave, often extending to 161.8% of wave 1. •Wave 4: Another corrective wave, usually less severe than wave 2. •Wave 5: Final wave in the impulsive phase, often displaying divergence with indicators like MACD or RSI. Fibonacci Levels •Fibonacci retracement levels are crucial in identifying potential reversal points and are marked on the chart: •23.6% Retracement: Around 3367.855, indicating a potential resistance level during a pullback. •38.2% Retracement: Near 3279.830, suggesting a significant support level. •50% Retracement: Often considered a strong support or resistance level, located around 3219.320. Future Projections 1.Current Scenario •The chart indicates that Ethereum is currently forming wave (2), which is expected to continue downwards, with potential support around 3279.830 or 3219.320. 2.Wave (3) Projection •After completing wave (2), an upward impulsive phase (wave (3)) is likely to begin. This wave could extend towards new highs, potentially targeting levels above the previous peak of wave (1). Conclusion •Short-Term: Expect a downward correction in wave (2), with support around 3279.830 or 3219.320. •Medium-Term: A strong upward movement is expected to follow in wave (3), potentially reaching new highs. •Long-Term: Continuation of the upward trend in waves (4) and (5), with final targets determined by the extent of wave (3). Trading Strategy •Entry: Consider entering long positions near the end of wave (2), using Fibonacci support levels around 3279.830 or 3219.320 as potential entry points. •Stop-Loss: Place stop-loss orders below the 50% retracement level to protect against deeper corrections. •Targets: Set initial profit targets around the previous peak of wave (1) and adjust positions based on the development of wave (3).
KironKavanagh
Elliott Wave Analysis on Ripple (XRP/USD)

Major Wave Structure 1.Primary Waves •W-X-Y-XX-Z: The chart begins with a complex corrective structure, which is common in Elliott Wave Theory to describe prolonged corrective phases. •1-2-3-4-5: Following the complex correction, an impulsive wave structure is apparent. 2.Subwaves •Each primary wave consists of smaller-degree waves, identified using numerical (1, 2, 3, 4, 5) and alphabetical (A, B, C) labels. Detailed Breakdown Corrective Phase (W-X-Y-XX-Z) •Wave W: Indicates an initial corrective phase, typically forming a zigzag pattern. •Wave X: A connecting wave that can take the form of a triangle, flat, or zigzag. •Wave Y: Another corrective wave similar to wave W. •Wave XX: Another connecting wave, similar in structure to wave X. •Wave Z: The final corrective phase in the complex structure. Impulsive Phase (1-2-3-4-5) •Wave 1: Initial impulsive wave marking the beginning of a new trend. •Wave 2: Corrective phase, typically retracing part of wave 1. •Wave 3: The strongest and usually the longest wave, often extending to 161.8% of wave 1. •Wave 4: Another corrective wave, usually less severe than wave 2. •Wave 5: Final wave in the impulsive phase, often displaying divergence with indicators like MACD or RSI. Fibonacci Levels •Fibonacci retracement levels are crucial in identifying potential reversal points and are marked on the chart: •23.6% Retracement: Around 0.58025, indicating a potential resistance level during a pullback. •38.2% Retracement: Near 0.54160, suggesting a significant support level. •50% Retracement: Often considered a strong support or resistance level, located around 0.51587. Future Projections 1.Current Scenario •The chart indicates that Ripple is currently forming wave (3), which is expected to continue upwards, with potential resistance around 0.65795. 2.Wave (4) Projection •After completing wave (3), a corrective phase (wave (4)) is likely. This wave could retrace to the 38.2% or 50% Fibonacci levels, around 0.54160 or 0.51587, respectively. 3.Wave (5) Projection •Following wave (4), the upward trend is expected to resume in wave (5), potentially targeting new highs above the previous peak of wave (3). Conclusion •Short-Term: Expect continued upward movement in wave (3), with resistance around 0.65795. •Medium-Term: A corrective phase (wave (4)) is expected, targeting support around 0.54160 or 0.51587. •Long-Term: After wave (4), the upward trend should continue in wave (5), potentially reaching higher levels. Trading Strategy •Entry: Consider entering long positions near the end of wave (4), using Fibonacci support levels around 0.54160 or 0.51587 as potential entry points. •Stop-Loss: Place stop-loss orders below the 61.8% retracement level to protect against deeper corrections. •Targets: Set initial profit targets around the resistance level of wave (3) and adjust positions based on the development of wave (5).
KironKavanagh
Elliott Wave Analysis On BTC

I usually use separate chart software for much of my technical analysis, so this prediction is based on alternative software in addition to tradingview Major Wave Structure 1.Primary Waves •W-X-Y-XX-Z: The chart indicates a complex corrective pattern, often referred to as a double or triple three. •1-2-3-4-5: Following the complex correction, the chart shows an impulsive wave structure. 2.Subwaves •Each primary wave consists of smaller-degree waves, labeled in both numerical and alphabetical sequences. Detailed Breakdown 1.Corrective Phase (W-X-Y-XX-Z) •Wave W: Initial corrective phase, typically a zigzag or flat. •Wave X: Connecting wave, often taking the form of a triangle or flat. •Wave Y: Another corrective wave similar to wave W. •Wave XX: Another connecting wave. •Wave Z: Final corrective phase in the complex structure. 2.Impulsive Phase (1-2-3-4-5) •Wave 1: Initial impulsive wave marking the start of a new trend. •Wave 2: Corrective phase, retracing part of wave 1. •Wave 3: The strongest wave, often extending to 161.8% of wave 1. •Wave 4: Another corrective wave, usually less severe than wave 2. •Wave 5: Final wave in the impulsive phase, often showing divergence with indicators like MACD or RSI. Fibonacci Levels •Fibonacci retracement levels are key in identifying potential reversal points. •23.6% Retracement: Around 65615.200, indicating a potential resistance level during a pullback. •38.2% Retracement: Near 63986.000, suggesting a significant support level. •50% Retracement: Typically considered a strong support or resistance level. Future Projections 1.Wave (3) •Currently, wave (3) appears to be forming, which is typically the most extended and powerful wave in the impulsive phase. This wave is projected to continue upwards, with potential resistance around 67506.460. 2.Wave (4) •After completing wave (3), a corrective wave (4) is expected. This wave could retrace to the 38.2% or 50% Fibonacci levels, around 63986.000. 3.Wave (5) •Following wave (4), wave (5) would resume the upward trend, potentially targeting new highs above the previous peak of wave (3). Conclusion •Short-Term: Expect continued upward movement in wave (3), with resistance around 67506.460. •Medium-Term: A corrective phase (wave (4)) is likely, targeting support around 63986.000. •Long-Term: After wave (4), the upward trend should resume in wave (5), potentially targeting higher levels. Trading Strategy •Entry: Consider entering long positions near the end of wave (4), using Fibonacci support levels around 63986.000 as potential entry points. •Stop-Loss: Place stop-loss orders below the 50% retracement level to protect against deeper corrections. •Targets: Set initial profit targets around the resistance level of wave (3) and adjust positions based on the development of wave (5).
KironKavanagh
Analysis of Gold (XAU/USD) Focusing on Elliott Wave

Comprehensive Analysis of Gold (XAU/USD) Focusing on Elliott Wave Daily Chart Analysis 1.Wave Structure: The daily chart indicates that the fifth wave of a larger degree (5) is in development, with wave 3 of (5) forming as part of it. 2.Correction and Impulse Waves: The chart shows the completion of a fourth wave correction (iv) within wave 3 of (5), suggesting that wave v of 3 is forming. 3.Critical Levels: •Support: 2347.67 •Resistance: 2560.00 – 2650.00 4-Hour Chart Analysis 1.Wave (iv) Completion: The H4 chart supports the daily chart analysis, showing the completion of the fourth wave iv of 3. 2.Development of Wave v: The chart suggests that wave v of 3 is in progress. 1-Hour Chart Analysis 1.Formation of Wave (i): The first wave of a smaller degree (i) of v has formed, indicating the beginning of an upward move. 2.Correction (ii): A local correction started developing as the second wave (ii) of v. Key Observations: 1.Trend Continuation: If the correction completes without breaking the critical support at 2347.67, the expectation is for XAU/USD to rise towards the 2560.00 – 2650.00 levels. 2.Downside Risk: A breakout below 2347.67 could invalidate the bullish scenario, leading to further declines towards 2161.56 – 1988.70. Technical Indicators: 1.MACD: The MACD indicates a slight bearish momentum in the short term but has not confirmed a strong downtrend. 2.RSI: The RSI on the H1 chart shows the market is approaching oversold conditions, suggesting a potential reversal. Elliott Wave Patterns •Primary Waves: The charts collectively suggest the formation of primary waves 1, 2, 3, 4, and 5 within the larger degree fifth wave (5). •Corrective Patterns: Several ABC corrective patterns are visible, supporting the continuation of the larger degree impulse wave. Summary: •The analysis across multiple time frames indicates that XAU/USD is in the process of completing wave (ii) of v. Upon completion of this correction, if the critical support level of 2347.67 holds, a continuation towards the resistance levels of 2560.00 – 2650.00 is expected. •Traders should watch the 2347.67 level closely, as a break below this support could lead to a significant downside move. This comprehensive analysis combines Elliott Wave theory with critical support and resistance levels, supported by technical indicators like MACD and RSI, to provide a robust forecast for gold’s price movements. Market Sentiment: •COT Longs: 84.37% •COT Shorts: 15.63% •Retail Longs: 57% •Retail Shorts: 43% Economic Growth Data: •GDP Current: 1.40% •GDP Forecast: 1.30% (Change: -0.10%) •ISM mPMI and sPMI show minor negative changes. Labor Market Data: •NFP: 206k (Change: -12k) •Unemployment: 4.10% (Forecast: 4.00%, Change: 0.10%) Inflation Data: •CPI: 3.0% (Forecast: 3.3%, Change: -0.3%) Opinion: The overall bullish sentiment for gold is supported by strong long positions from both COT and retail traders. The economic indicators such as GDP, ISM indices, and CPI are showing slight weaknesses, which might support a safe-haven asset like gold. Given the slight decline in inflation expectations and stable unemployment, gold could see positive movement if economic conditions worsen.
KironKavanagh
Gold update for 22-26 July

Profit-Taking: After gold reached near-record highs earlier in the year, many investors started selling to lock in profits. This is a common reaction after significant rallies, contributing to downward pressure on prices . Strengthening U.S. Dollar: The U.S. dollar has been strengthening, which typically leads to a decline in gold prices as it becomes more expensive for investors holding other currencies. This inverse relationship between the dollar and gold has been a significant factor in the recent sell-off . Interest Rate Expectations: There has been a shift in expectations regarding the Federal Reserve’s interest rate policy. Initially, there was speculation about multiple rate cuts in 2024, but recent data and Fed statements suggest only one potential cut for the rest of the year. Higher real yields and a less dovish outlook from the Fed reduce the appeal of gold as an inflation hedge . Technical Selling: Technical factors also played a role, with some analysts pointing to chart patterns suggesting a bearish outlook in the short term. Patterns such as the head-and-shoulders formation indicate potential further declines if key support levels are breached . Top-Down Analysis of Gold (XAU/USD) Monthly Chart Analysis •Trend: The overall trend on the monthly chart is bullish, with gold making higher highs and higher lows. •Key Levels: •Support: Around 2,000, which has acted as a significant psychological level. •Resistance: The previous high near 2,500. Weekly Chart Analysis •Trend: The weekly trend also shows a bullish structure, maintaining higher lows. •Key Levels: •Support: Around 2,300 and 2,200, where consolidation has occurred in the past. •Resistance: The recent high around 2,500. Daily Chart Analysis •Trend: The daily chart indicates a bullish trend with a recent pullback from highs. •Moving Averages: The 50-day and 200-day moving averages are both sloping upwards, confirming the bullish trend. •Key Levels: •Support: Around 2,350 and 2,250, where recent consolidations and previous demand zones are located. •Resistance: Recent highs around 2,500. 4-Hour Chart Analysis •Trend: The 4-hour chart shows a short-term downtrend within the context of the broader bullish trend. •Key Levels: •Support: Around 2,350 and 2,300, aligning with the daily support zones. •Resistance: Immediate resistance around 2,450 and the recent high near 2,480. 1-Hour Chart Analysis •Trend: The 1-hour chart is in a corrective phase, showing a series of lower highs and lower lows. •Key Levels: •Support: Immediate support around 2,380 and stronger support at 2,350. •Resistance: Short-term resistance at 2,430 and 2,450. 15-Minute Chart Analysis •Trend: The 15-minute chart shows the recent downtrend but with signs of potential reversal as RSI indicates oversold conditions. •Key Levels: •Support: Immediate support at 2,400, with next levels at 2,380. •Resistance: Resistance at 2,420 and 2,430. Summary •Long-Term Trend: Bullish •Medium-Term Trend: Bullish with a recent pullback •Short-Term Trend: Corrective downtrend within a larger bullish context Trading Strategy •Buy the Dip: Look for buying opportunities around key support levels (2,350 and 2,300). •Confirmation: Wait for bullish confirmation signals like a higher low or bullish candlestick patterns at these support levels. •Targets: Initial targets can be set at 2,450 and 2,500. •Risk Management: Use stop-loss orders just below key support levels to manage risk. By considering the analysis from higher time frames to lower time frames, this approach allows aligning the overall bullish trend with short-term corrective phases to find optimal entry points.
KironKavanagh
Top-Down Analysis on US30 (Dow Jones Industrial Average)
Weekly Time Frame Analysis 1.Market Structure: •The Dow Jones Industrial Average (US30) is in an overall uptrend, making higher highs and higher lows. •The recent price action shows a strong bullish momentum with the price approaching a significant resistance area. 2.Key Levels: •Resistance: 41,500 (recent highs), 42,000 (psychological level) •Support: 39,000 (previous swing low), 37,500 (strong support) 3.Indicators: •RSI: Around 70, indicating overbought conditions which may suggest a potential pullback. •Moving Averages: The price is trading above the 50-week and 200-week moving averages, confirming the uptrend. Daily Time Frame Analysis 1.Market Structure: •The daily chart confirms the uptrend with a recent breakout above 40,000. •The price has encountered resistance around 41,250 and is currently retracing. 2.Key Levels: •Resistance: 41,250 (recent high), 41,500 (next target) •Support: 40,000 (immediate support), 39,000 (daily support aligning with weekly support) 3.Indicators: •RSI: Around 65, showing bullish momentum but nearing overbought territory. •Moving Averages: The price is well above the 50-day and 200-day moving averages, indicating strong bullish sentiment. 4-Hour Time Frame Analysis 1.Market Structure: •The 4-hour chart shows a clear bullish structure with minor corrections. •Recent price action indicates a pullback after a strong rally, testing the 40,500 support area. 2.Key Levels: •Resistance: 41,000 (short-term resistance), 41,250 (key resistance) •Support: 40,500 (immediate support), 40,000 (strong support) 3.Indicators: •RSI: Around 50, suggesting neutral conditions with potential for either continuation or further pullback. •Fair Value Gaps (FVG): Small gap observed around 40,700 - 40,900, potentially attracting buy orders. 1-Hour Time Frame Analysis 1.Market Structure: •The 1-hour chart indicates a bullish trend with a current retracement phase. •The price is testing the 40,500 support after failing to break above 41,250. 2.Key Levels: •Resistance: 41,000 (immediate resistance), 41,250 (short-term target) •Support: 40,500 (current support), 40,200 (further support) 3.Indicators: •RSI: Around 40, indicating a potential buying opportunity as it approaches oversold conditions. •Moving Averages: Price is testing the 50-hour moving average, which could act as dynamic support. Summary: •Long-Term Trend: Bullish •Short-Term Trend: Bullish with a current pullback •Key Levels to Watch: •Resistance: 41,250, 41,500 •Support: 40,500, 40,000 Trading Plan: •Long Positions: Consider buying at the current support levels around 40,500 with a target of 41,250, and a stop loss below 40,000. •Short Positions: Look for shorting opportunities if the price fails to break above 41,250, targeting 40,000 with a stop loss above 41,500. This analysis provides a comprehensive view of the US30 across multiple time frames, identifying key levels and potential trading opportunities.
KironKavanagh
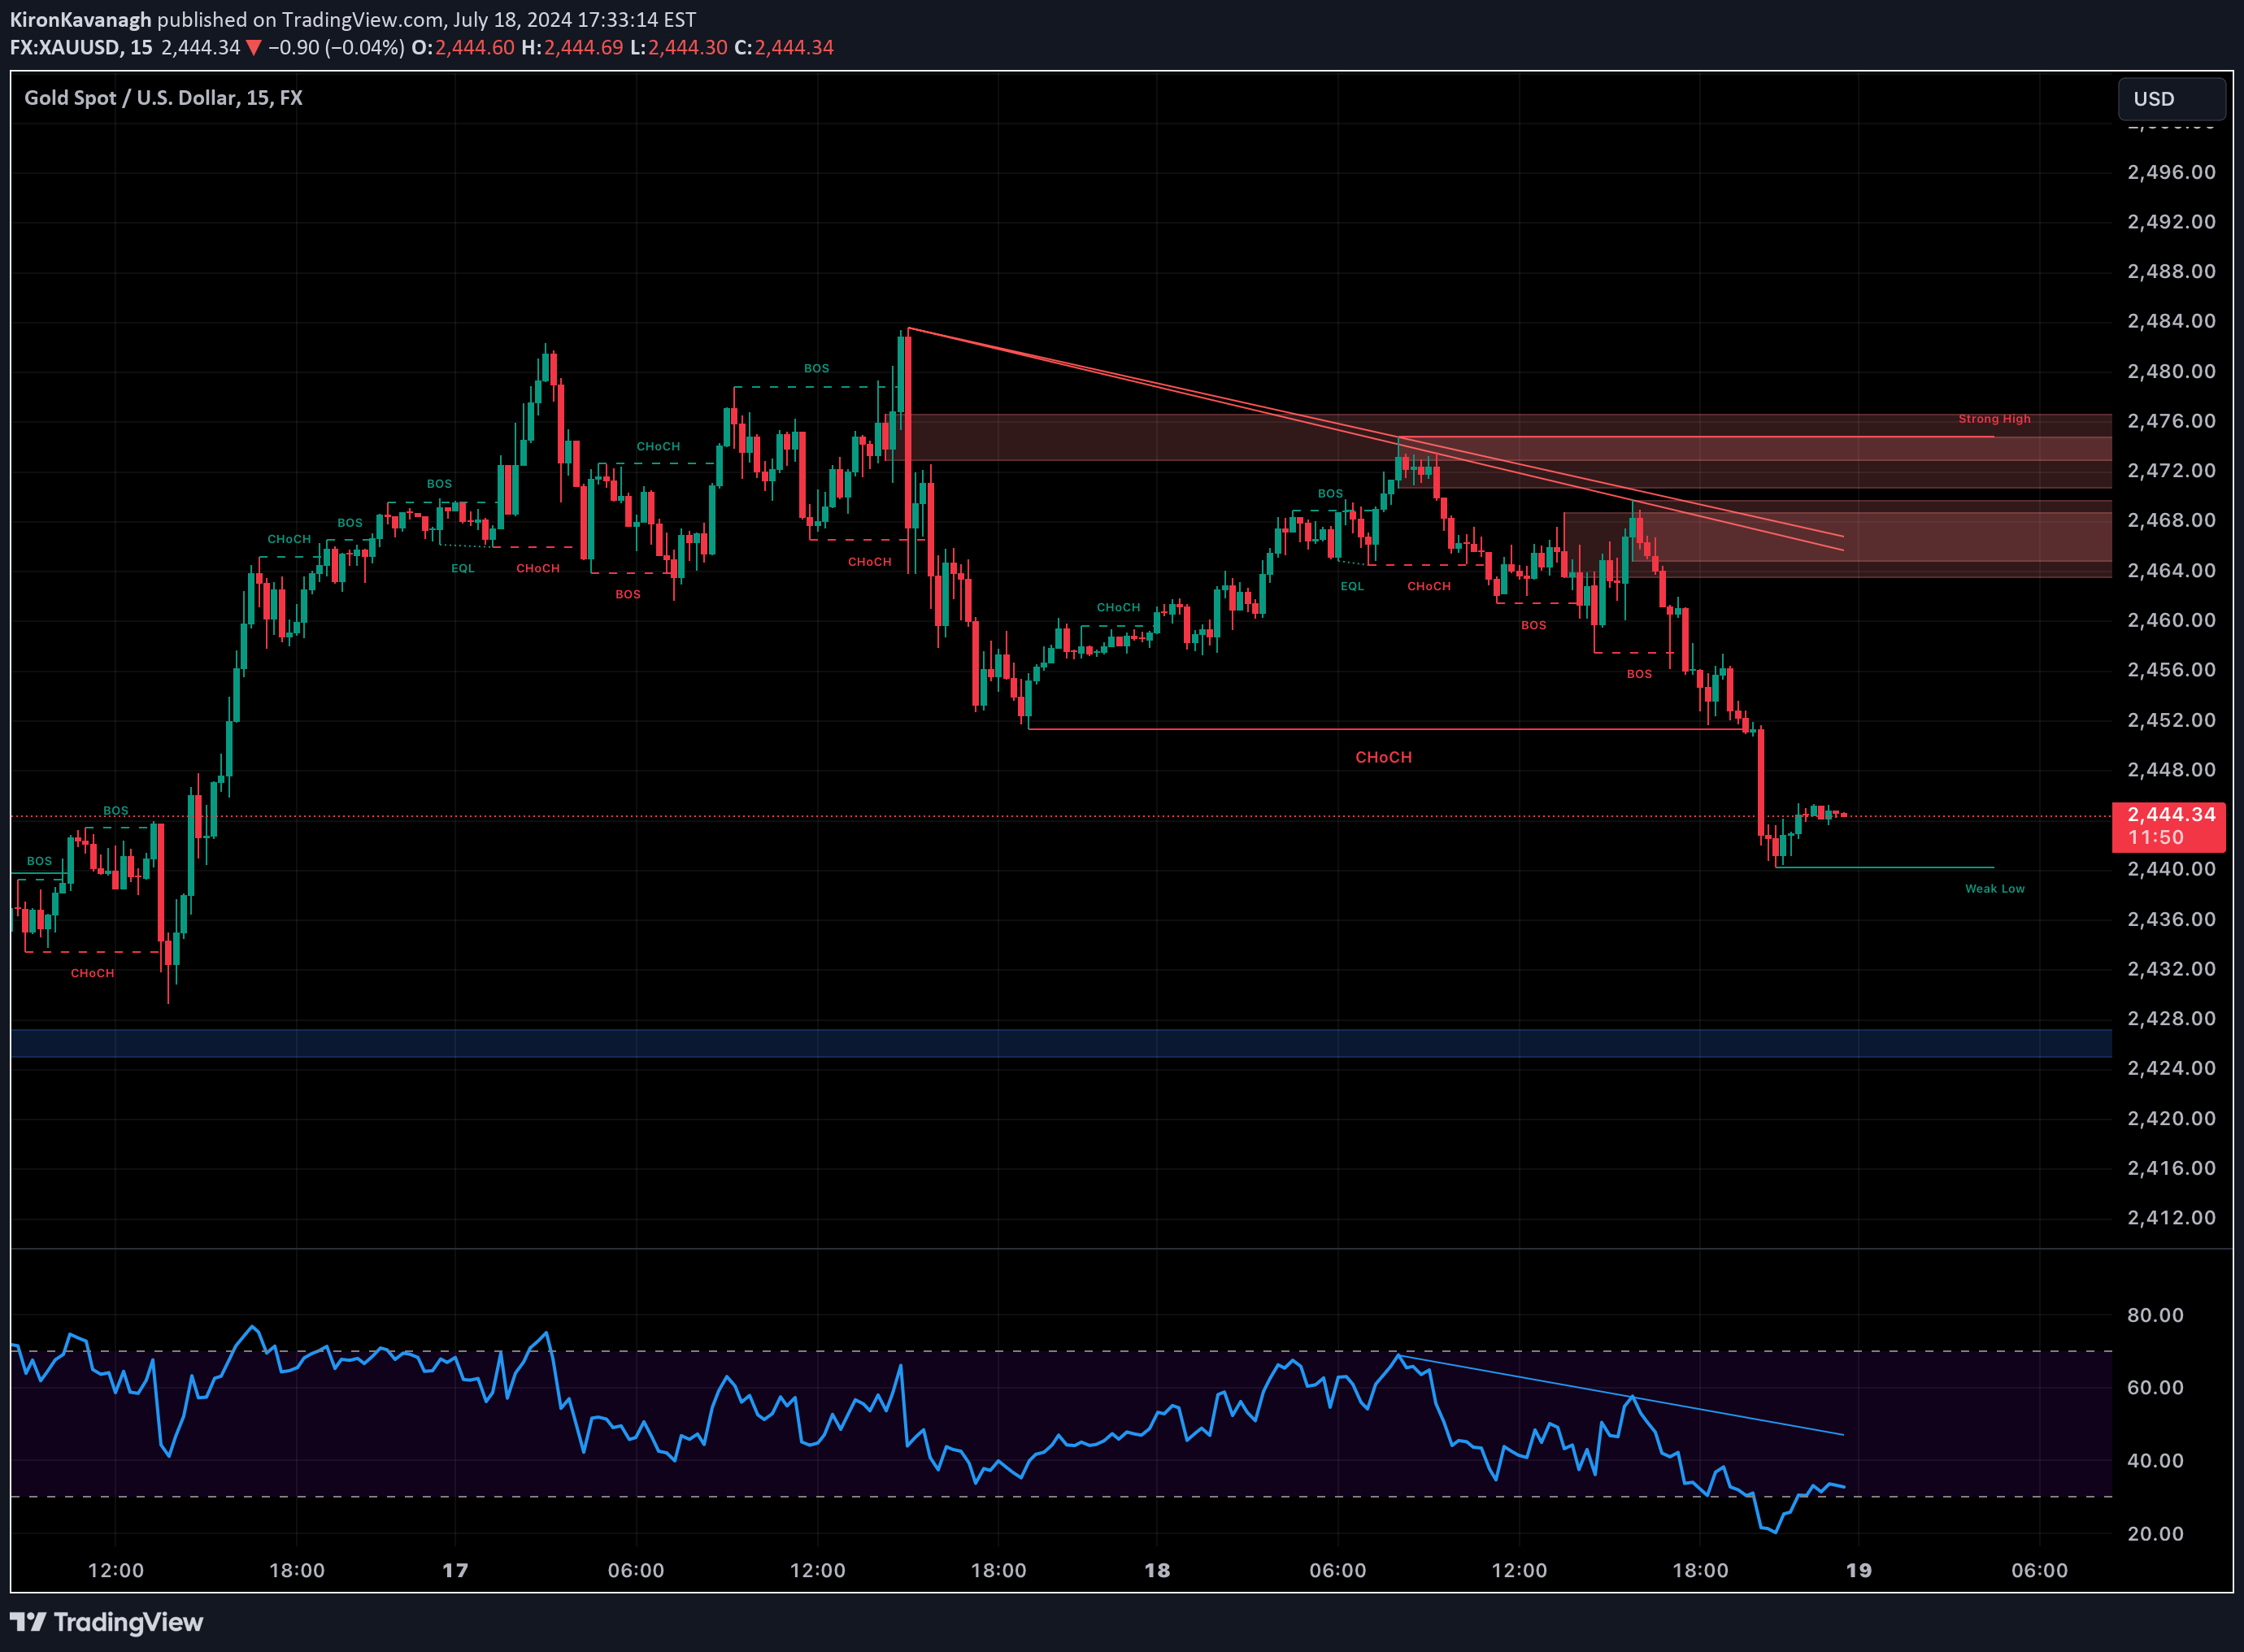
Update on Gold

Let’s perform a top-down analysis on Gold (XAU/USD) using the provided charts across multiple timeframes. We will start with the higher timeframes and move down to the lower ones to identify the overall trend, key levels of support and resistance, and any notable patterns or setups. Daily Timeframe Analysis 1.Trend Identification: •The daily chart shows an overall uptrend with higher highs and higher lows. •Price has been making consistent gains with retracements to key support zones. 2.Support and Resistance: •Key Support Levels: Around 2300 and 2100. •Key Resistance Levels: Around 2500 (previous swing high). 3.Patterns: •The chart shows a break of structure (BOS) at multiple points indicating a strong bullish trend. •The RSI is currently showing a possible bearish divergence, suggesting a potential pullback or consolidation. 4-Hour Timeframe Analysis 1.Trend Identification: •The 4-hour chart also confirms the uptrend seen in the daily chart. •Recent price action indicates a pullback from the resistance level around 2480-2500. 2.Support and Resistance: •Immediate Support Levels: Around 2420 and 2350. •Immediate Resistance Levels: Around 2480. 3.Patterns: •The chart shows a change of character (ChoCH) indicating a potential shift in the short-term trend. •RSI on the 4-hour chart is moving towards the oversold region, suggesting a potential bounce from the support level. 1-Hour Timeframe Analysis 1.Trend Identification: •The 1-hour chart shows more detailed price action with minor support and resistance levels. •The chart indicates a recent break of structure and possible formation of a lower high, suggesting a potential short-term downtrend. 2.Support and Resistance: •Immediate Support Levels: Around 2420 and 2400. •Immediate Resistance Levels: Around 2480 and 2500. 3.Patterns: •The chart shows potential bullish setups forming around the 2420 support level. •RSI is oversold, suggesting a possible short-term buying opportunity. 15-Minute Timeframe Analysis 1.Trend Identification: •The 15-minute chart shows intraday price action and minor fluctuations. •The recent downtrend on this timeframe might be a retracement within the larger timeframes’ uptrend. 2.Support and Resistance: •Immediate Support Levels: Around 2440 and 2420. •Immediate Resistance Levels: Around 2460 and 2480. 3.Patterns: •The chart shows a potential bullish divergence on the RSI, indicating a possible reversal. •The price is testing the minor support levels, which might provide short-term buying opportunities. Summary and Trading Plan •Long-Term (Daily/4-Hour): The overall trend is bullish with potential pullbacks. Key levels to watch are 2420 for support and 2480 for resistance. •Medium-Term (1-Hour): The trend shows a potential retracement. Watch for support around 2420 and resistance around 2480. •Short-Term (15-Minute): Intraday traders should watch for reversals around the 2420-2440 support levels with possible targets at 2460-2480. Conclusion Gold remains in an overall uptrend with strong support around 2420 on the daily and 4-hour charts. Short-term retracements should be viewed as potential buying opportunities within the larger trend, particularly around key support levels. Traders should monitor RSI and price action closely for confirmation of entry and exit points.
Disclaimer
Any content and materials included in Sahmeto's website and official communication channels are a compilation of personal opinions and analyses and are not binding. They do not constitute any recommendation for buying, selling, entering or exiting the stock market and cryptocurrency market. Also, all news and analyses included in the website and channels are merely republished information from official and unofficial domestic and foreign sources, and it is obvious that users of the said content are responsible for following up and ensuring the authenticity and accuracy of the materials. Therefore, while disclaiming responsibility, it is declared that the responsibility for any decision-making, action, and potential profit and loss in the capital market and cryptocurrency market lies with the trader.