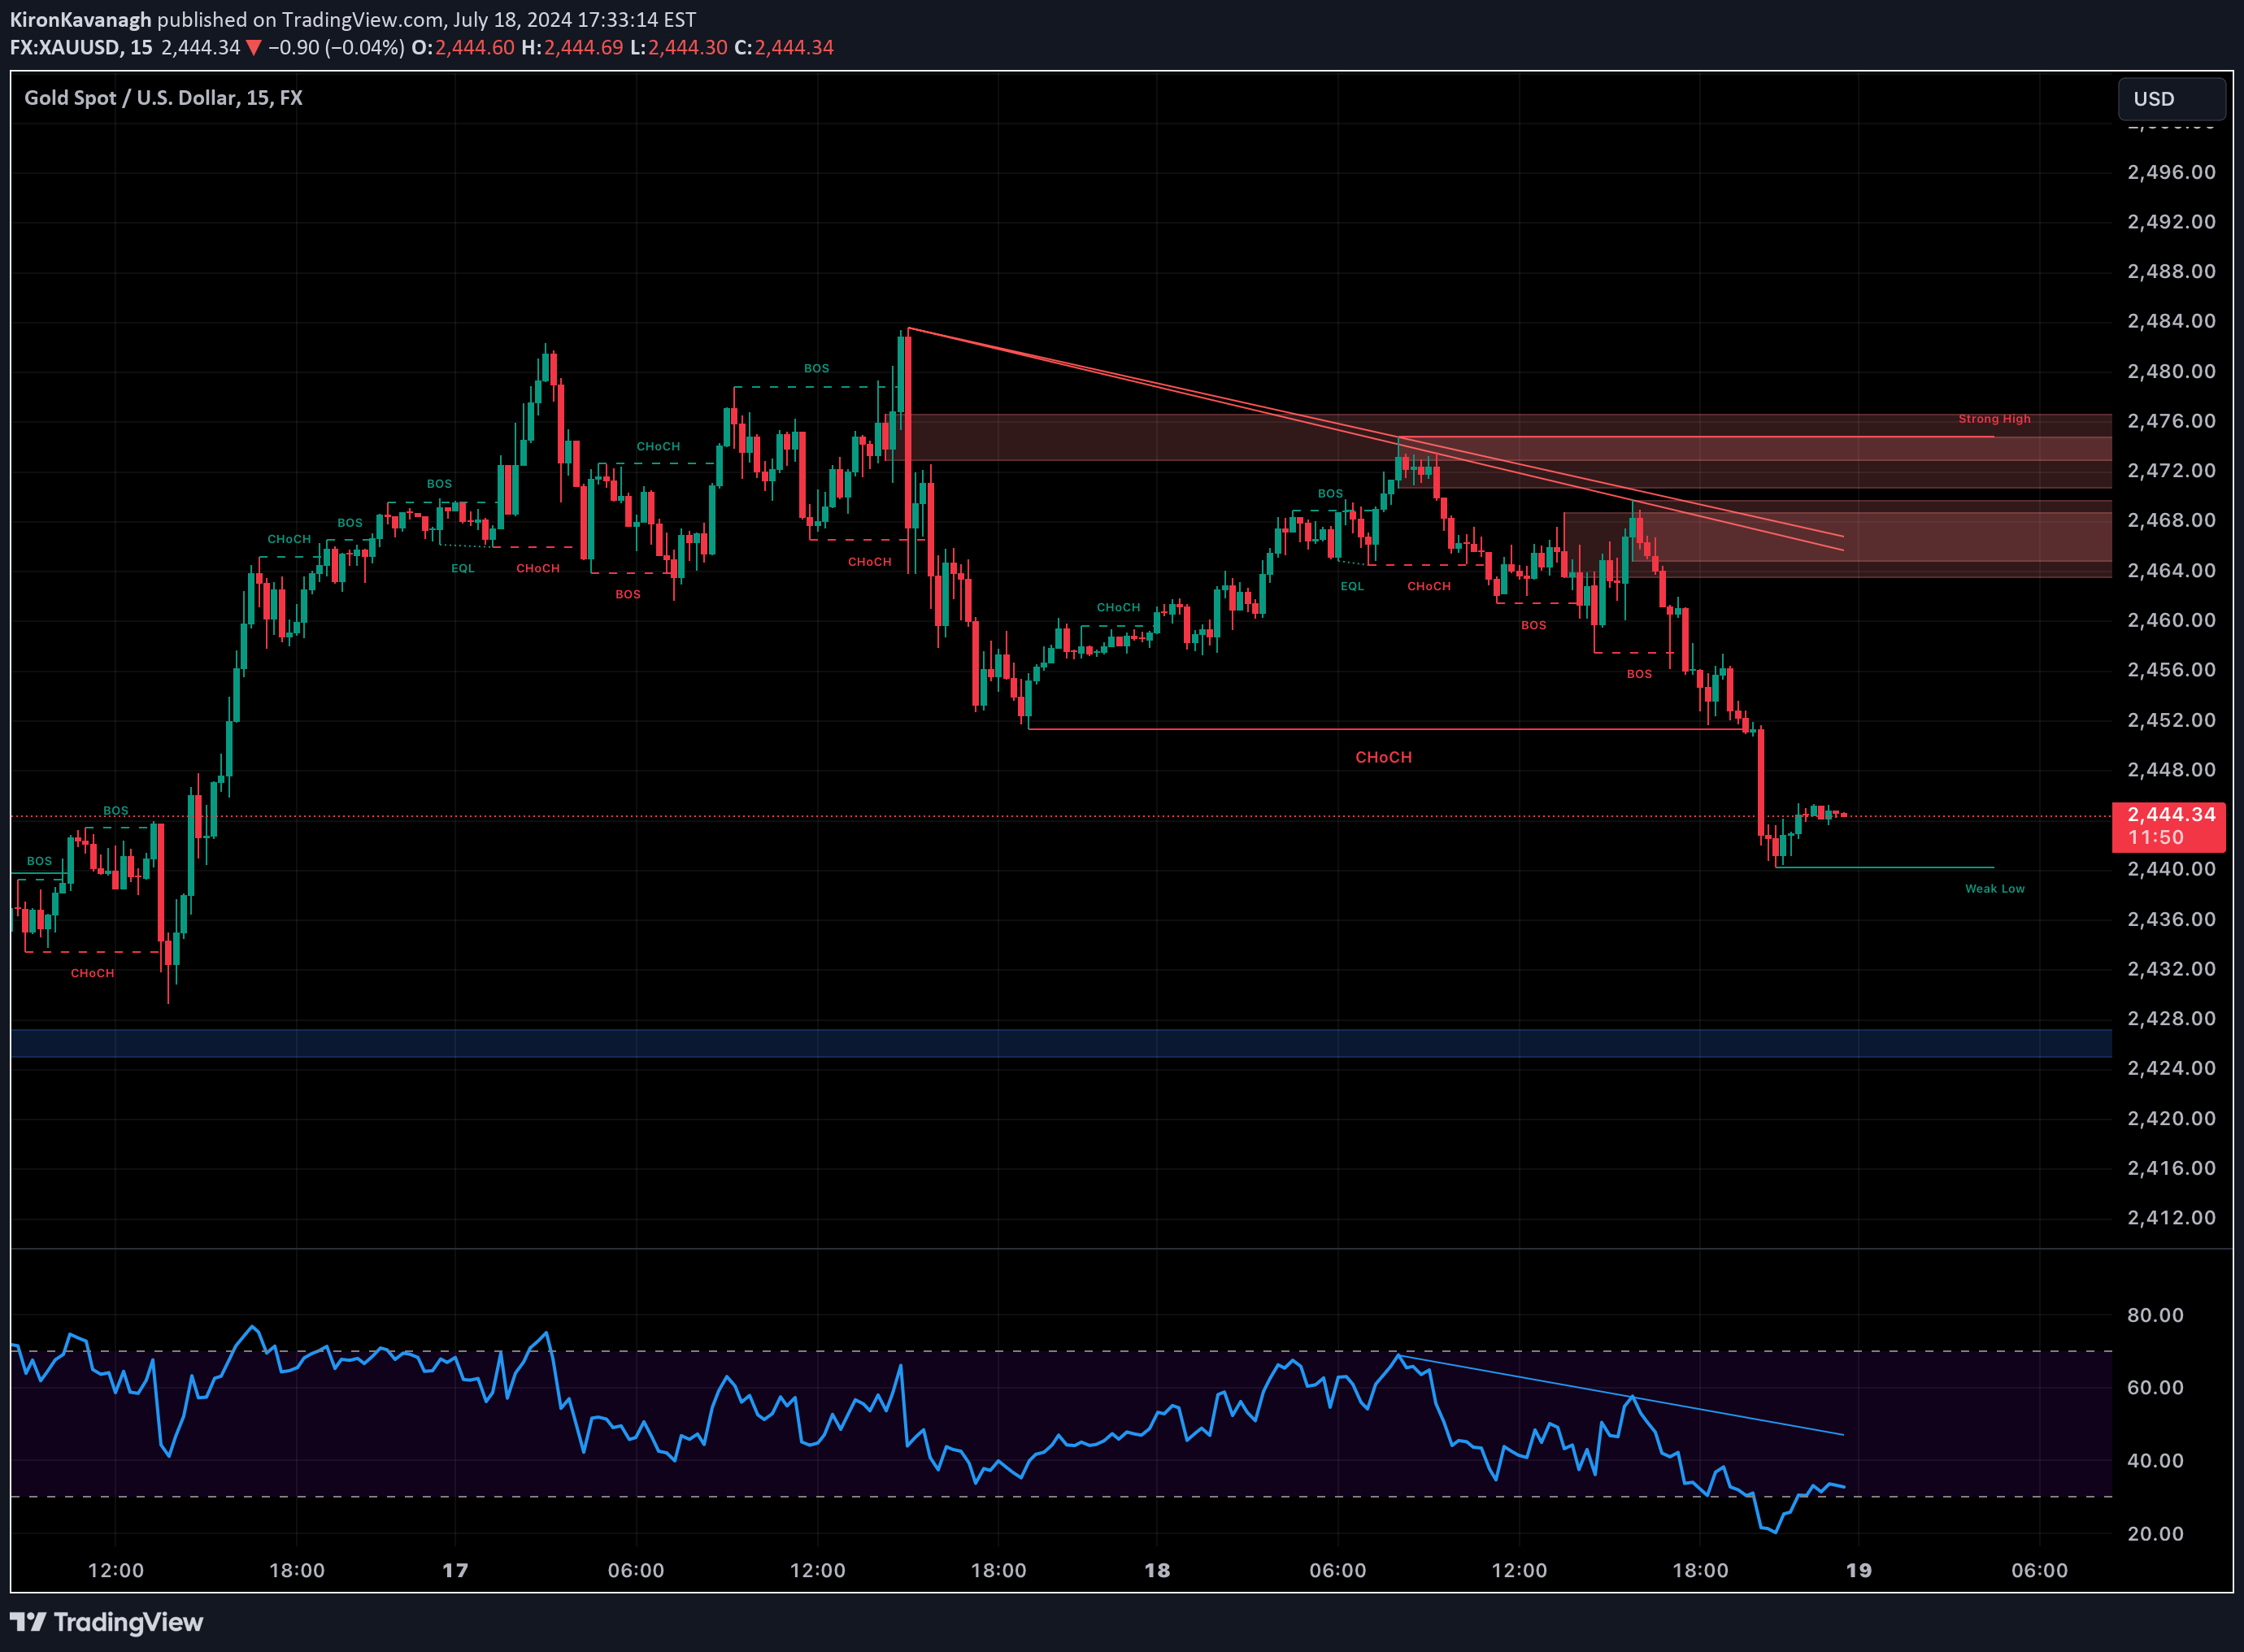
Technical analysis by KironKavanagh about Symbol PAXG: Buy recommendation (7/18/2024)

KironKavanagh
Top-Down Analysis on US30 (Dow Jones Industrial Average)

Weekly Time Frame Analysis 1.Market Structure: •The Dow Jones Industrial Average (US30) is in an overall uptrend, making higher highs and higher lows. •The recent price action shows a strong bullish momentum with the price approaching a significant resistance area. 2.Key Levels: •Resistance: 41,500 (recent highs), 42,000 (psychological level) •Support: 39,000 (previous swing low), 37,500 (strong support) 3.Indicators: •RSI: Around 70, indicating overbought conditions which may suggest a potential pullback. •Moving Averages: The price is trading above the 50-week and 200-week moving averages, confirming the uptrend. Daily Time Frame Analysis 1.Market Structure: •The daily chart confirms the uptrend with a recent breakout above 40,000. •The price has encountered resistance around 41,250 and is currently retracing. 2.Key Levels: •Resistance: 41,250 (recent high), 41,500 (next target) •Support: 40,000 (immediate support), 39,000 (daily support aligning with weekly support) 3.Indicators: •RSI: Around 65, showing bullish momentum but nearing overbought territory. •Moving Averages: The price is well above the 50-day and 200-day moving averages, indicating strong bullish sentiment. 4-Hour Time Frame Analysis 1.Market Structure: •The 4-hour chart shows a clear bullish structure with minor corrections. •Recent price action indicates a pullback after a strong rally, testing the 40,500 support area. 2.Key Levels: •Resistance: 41,000 (short-term resistance), 41,250 (key resistance) •Support: 40,500 (immediate support), 40,000 (strong support) 3.Indicators: •RSI: Around 50, suggesting neutral conditions with potential for either continuation or further pullback. •Fair Value Gaps (FVG): Small gap observed around 40,700 - 40,900, potentially attracting buy orders. 1-Hour Time Frame Analysis 1.Market Structure: •The 1-hour chart indicates a bullish trend with a current retracement phase. •The price is testing the 40,500 support after failing to break above 41,250. 2.Key Levels: •Resistance: 41,000 (immediate resistance), 41,250 (short-term target) •Support: 40,500 (current support), 40,200 (further support) 3.Indicators: •RSI: Around 40, indicating a potential buying opportunity as it approaches oversold conditions. •Moving Averages: Price is testing the 50-hour moving average, which could act as dynamic support. Summary: •Long-Term Trend: Bullish •Short-Term Trend: Bullish with a current pullback •Key Levels to Watch: •Resistance: 41,250, 41,500 •Support: 40,500, 40,000 Trading Plan: •Long Positions: Consider buying at the current support levels around 40,500 with a target of 41,250, and a stop loss below 40,000. •Short Positions: Look for shorting opportunities if the price fails to break above 41,250, targeting 40,000 with a stop loss above 41,500. This analysis provides a comprehensive view of the US30 across multiple time frames, identifying key levels and potential trading opportunities.