
King_BennyBag
@t_King_BennyBag

What symbols does the trader recommend buying?
Purchase History
پیام های تریدر
Filter
King_BennyBag
رمز موفقیت در ترید: چرا ثبات از استعداد مهمتر است؟
Welcome all to another post! In today's post we will review the difference between Talented trading and consistent trading. Why Consistency Beats Talent in Trading Many new traders usually enter trading believing that success belongs to the most intelligent individuals, the most analytical, or the most “naturally gifted.” In any field. When in reality, the market only rewards something that is far less glamorous, and that is.. consistency. Talent can help you understand charts faster and/or grasp concepts a lot quicker, but it is consistency that determines and shows whether you survive long enough to become profitable and make a positive return. Talent Creates Potential | Consistency Creates Results Talent shows up early, like in the first week or two. You might spot patterns instantly, win a few trades, or feel like trading “just makes sense” to you. Consistency shows up later and it’s far rarer. The market does not care how smart you are. It only responds to: - How often you follow your rules and system. - How well you manage risk ( or gamble it. ) - How disciplined you are under pressure and stress - A talented trader who trades emotionally will eventually lose, ( always lose. ) - A consistent trader with average skills can compound them steadily over time. Why Talented Traders Often Struggle Ironically, talent can be a disadvantage ( keep on reading ) Talented traders often: - Rely on intuition instead of their own rules or the games rules ( or common sense. ) - Take trades outside their plan ( like above, not following their rules. ) - Increase risk after a few wins ( again, not following RM rules. ) - Ignore data because “ they feel confident ” This leads to inconsistency big wins followed by bigger losses. ( Gambling ) The market eventually punishes anyone who treats probability like certainty. Consistency Turns Probability into an Edge Trading is not about being right it’s about commencing the same process over and over. Consistency means: - Taking only the setups you’ve defined. (Defined what A+ is) - Risking the same amount per trade. (Risk Management) - Accepting losses without deviation. (Moving on after a loss) - Following your plan even after losing streaks. (Maintaining consistency) One trade means nothing. A hundred trades executed the same way reveal your edge. Consistency allows probability to work for you, not against you. The Market Rewards Discipline, Not Brilliance The best traders in the world are not constantly trying to outsmart the market. They: - Trade fewer setups - Keep their approach simple - Protect capital first - Let time and repetition do the work - They understand that survival is the first goal. - You can’t compound an account you’ve blown. Consistency Is Boring and That’s the Point Consistencty lacks excitement. There are no adrenaline rushes, no heroic trades, no all-in moments. Just repetition, patience, and restraint. This is why most people fail. The market filters out those who chase excitement and rewards those who treat trading like a business, not entertainment. Talent Without Consistency Is Temporary Many traders experience early success. Very few maintain it. Short-term success often comes from: - Favorable market conditions - Random luck - Overconfidence Long-term success comes from: - Process - Risk control - Emotional discipline Consistency is what turns a good month into a sustainable career. How to Build Consistency as a Trader Consistency is a skill not a personality trait. You build it by: - Defining clear trading rules - Using fixed risk per trade - Journaling every trade honestly - Reviewing performance regularly - Trading less, not more Your goal isn’t to be impressive. Your goal is to be repeatable. Final Thoughts Talent may get you interested in trading. Consistency keeps you in the game. In a profession driven by uncertainty, the trader who shows up the same way every day will always outperform the one chasing brilliance. In trading, consistency doesn’t just beat talent > it replaces it. Thank you all so much for reading, I hope everyone enjoys it and that it benefits you all! Let me know in the comments below if you have any questions or requests.
King_BennyBag
بیت کوین به 110 هزار دلار میرسد یا سقوط میکند؟ تحلیل تکنیکال و سطوح کلیدی پیش رو
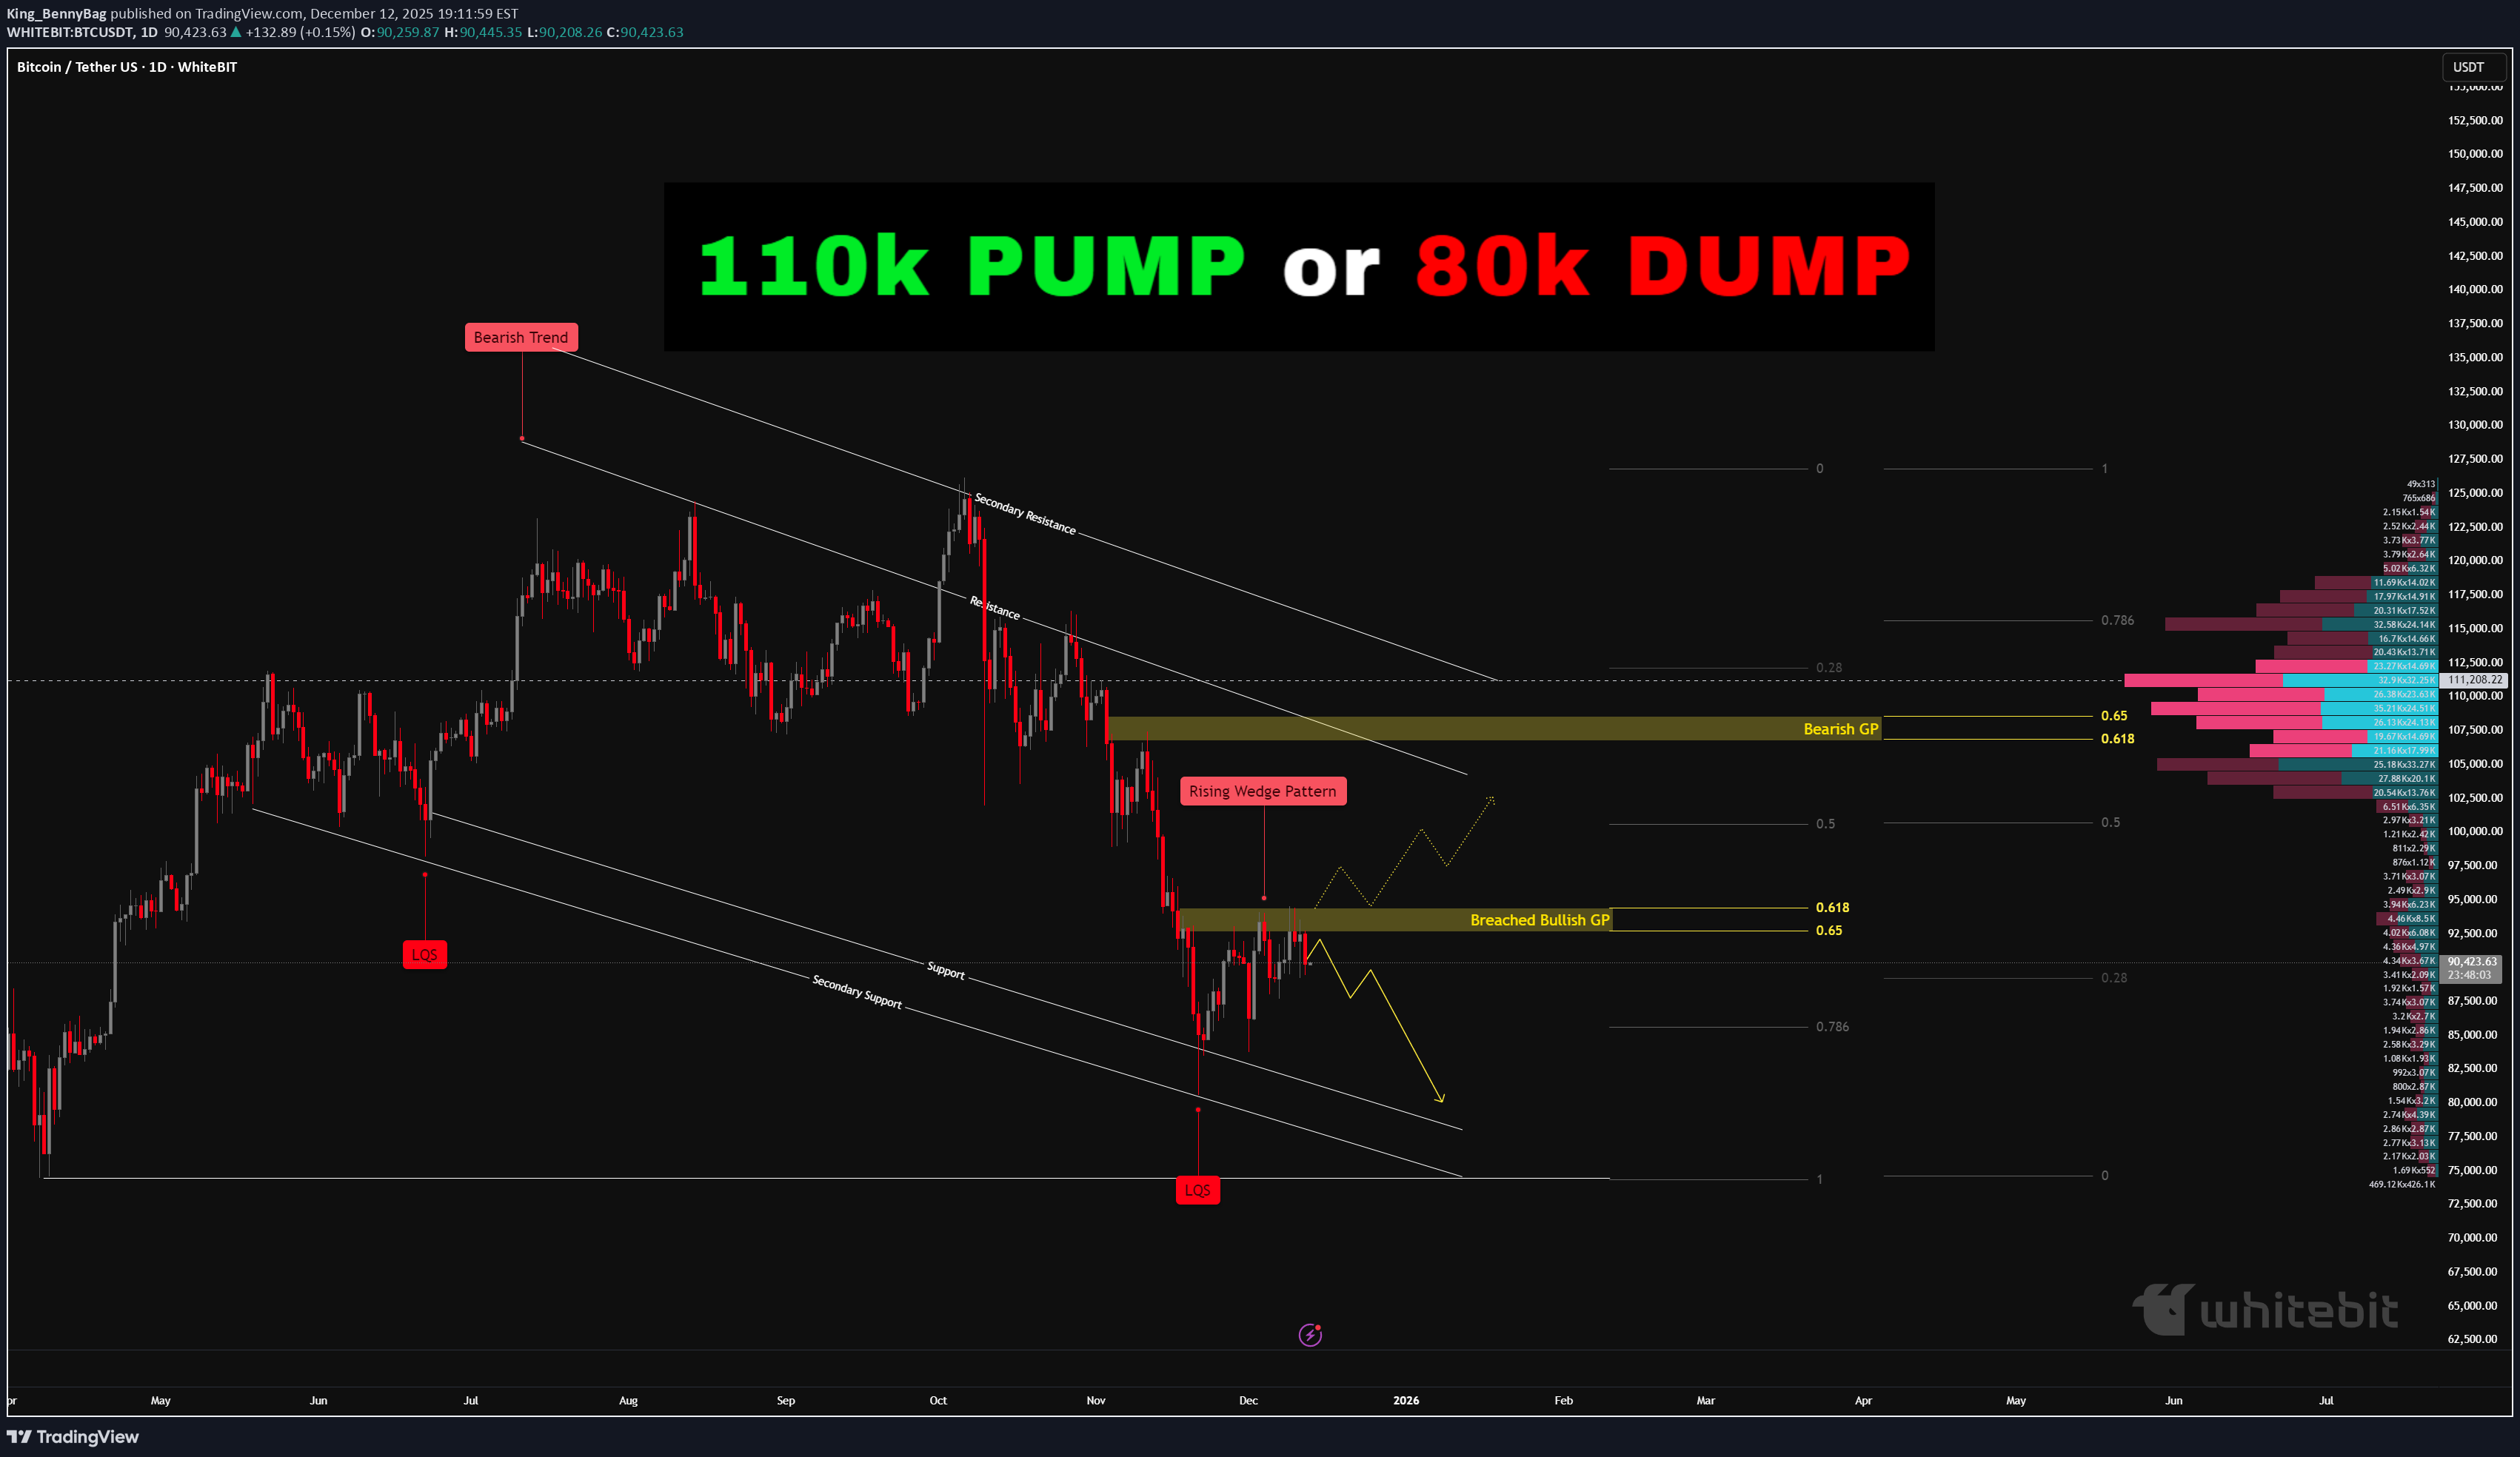
Bitcoin Market Assessment – WhiteBit Chart & Exchange (Daily Time Frame) Welcome back everyone. Today we will be evaluating Bitcoin using the WhiteBit chart on the daily time frame. Market Overview Bitcoin recently surged to 126k, sweeping liquidity at the highs. Shortly after, the market sold off aggressively partly amplified by tariff news—which reinforced the upper resistance zone and caused price to break back below it. Price continued to decline sharply, reaching 80.3k, where millions in positions were liquidated. Current Technical Structure 1. Breached Bullish Golden Pocket Price has broken below the bullish Golden Pocket (0.618–0.65). Once breached, this zone typically flips into resistance, which is what we’re seeing now. 2. Rising Wedge on the 4H On the 4-hour chart, price is forming a rising wedge, a pattern that often precedes continuation to the downside. This wedge aligns directly with the breached Golden Pocket, forming a strong confluence of resistance. 3. Trend Context Price action is still within a high-time-frame bearish trend, and the recent push upward appears to be a standard bearish pullback rather than a shift in structure. These combined factors suggest the possibility of a deeper move down. Downside Levels of Interest 0.786 Fibonacci Retracement (~85.6k) Next discount zone and logical target if the bearish structure continues. 80k Psychological Level A major high-volume and psychological area. If 85.6k breaks, a retest of 80k becomes probable. Bears are clearly targeting this zone. Volume Profile Insight Using the anchored volume tool, a significant cluster of volume sits around 111k—just above the key 110k level and very near the bearish Golden Pocket (0.618–0.65). This area has not yet been retested. On higher time frames, the bearish Golden Pocket often acts as the ideal retracement zone before price continues lower. This creates a compelling upside target if the bearish scenario invalidates. Market Tone Momentum remains weak on the bullish side, with sellers maintaining control. As long as price remains below the breached Golden Pocket, the market structure continues to favor the downside. Scenario Summary Bullish Scenario Price breaks above and closes above the breached bullish Golden Pocket (0.618–0.65 zone). Sustained strength above this level opens the door for: - 110k retest, aligning with major volume at 111k - Potential wick or extension into the bearish Golden Pocket This would temporarily invalidate short-term bearish momentum. Bearish Scenario (Primary) Breached Golden Pocket continues acting as strong resistance. Rising wedge breaks down. Price targets: - 0.786 Fib at 85.6k - 80k psychological level if 85.6k fails - Overall bearish trend remains intact, with bulls showing weakening momentum. Thank you all so much for reading. BTC has made a lot of reactions take place this year, from record breaking highs to record breaking liquidations of 19 Billion in just a few hours! It is important to be cautious, risk only what you can afford to lose and ensure you take on proper risk management. Make sure to follow and comment below what you think! If you would like any guides, or assessments of specific crypto currencies done, let me know!On the Topic of wedges! Checkout the guide below that features "How to Trade wedges!" In 5 steps!As we charted up! Price rejected and is continuing it's down trend.
King_BennyBag
آموزش ترید با گُوِهها: کسب سود در ۵ گام سریع و آسان!
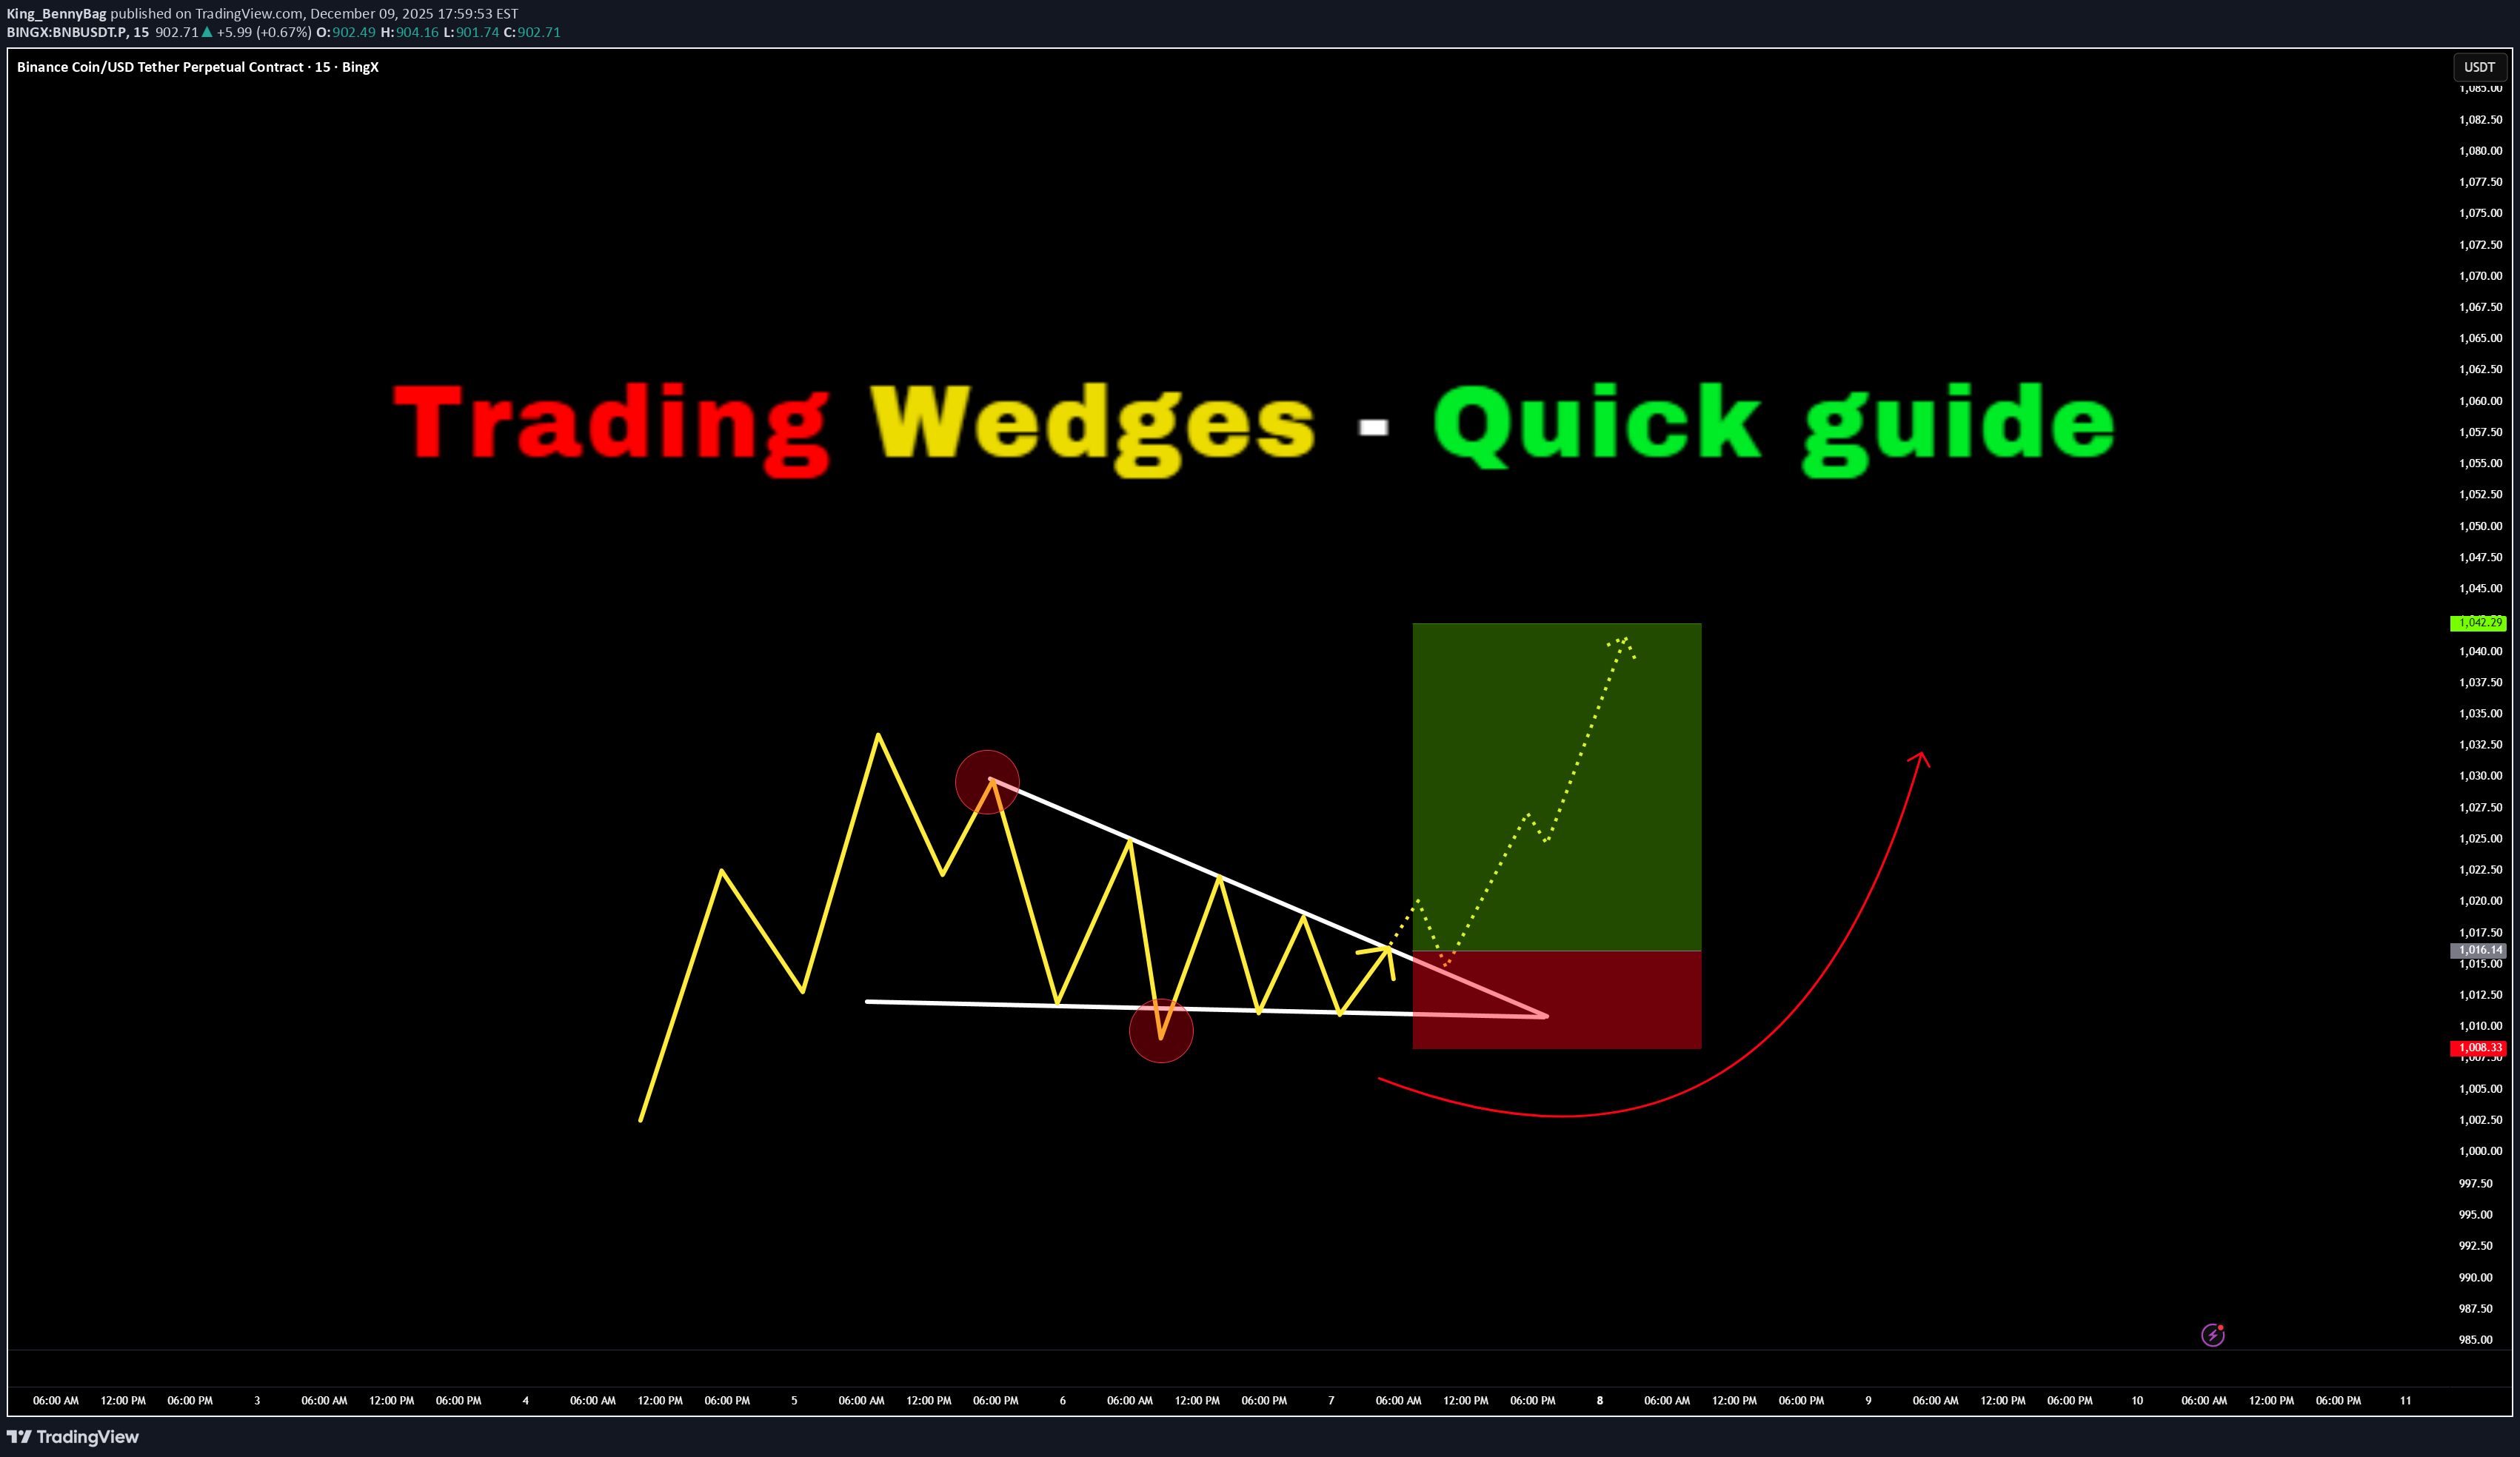
Welcome back everyone to another guide, today we will speed run "Trading wedges" in a quick 5 step guide. Be sure to like, follow and join the community! 1) Identify the wedges: - Falling Wedge - Rising Wedge - Symmetrical Wedge (Triangle) 2) Identify Breakout Direction: - Falling Wedge > Bullish Breakout Expected - Rising Wedge > Bearish Breakout Expected - Symmetrical Wedge (Triangle) > Consolidation Expected Breakout should show a candle closing outside the wedge. 3) Wait for retest to take place on previous key level or resistance (which would now be support) If the retest holds with a strong rejection candle or consolidation - begin to long. 4) Enter Trade: Enter on successful retest confirmation SL for longs should be below previous low's SL for shorts should be above previous highs. 5) TP levels: TP 1) First high target TP 2) Second high target TP 3) Third high target. RESULTS: Price has soared up high and hit all three Take profits. For trader who are wanting more profits you can potentially enable TP trailing afterwards - however I don't recommend this as you need to factor in your emotions of "GREED" Thank you all so much for reading! Hopefully this is a useful guide in the future or present! If you would like me to make any simplified guides, let me know in the comments below or contact me through trading view!
King_BennyBag
۵ نکته طلایی که هر تریدر مبتدی باید بداند!
Welcome back everyone to another post! In this article we will be explaining 5 key pointers (tips) for new individuals entering the trading space. When it comes to trading first there is “ understanding ” before we begin the 5 keys steps. Let me assist you in understanding what will happen when you take on trading. Trading is a challenge. Not a video game challenge, not a math test challenge – a * Challenge * One that will break you. Trading will break you mentally, physically, spiritually and financially. It is an eye-opening journey. Trading will teach you a lot about yourself, and it will teach you a lot about discipline, patience and how you can analyze markets. I saw a quote somewhere, it said trading: “ Trading is the hardest way, to make easy money ” and they are right. You will be learning how to manage risk, control your emotions, understand your own decision-making patterns. These are all invaluable lessons for life, as well as trading. Sounds great! But then there are the losses, what you lose to gain all this. Trading isn’t something that you can learn overnight – all those posts you see about a young 17-year-old “ cracking the code ” is rubbish. Why? Because they haven’t learnt life lessons. You can make money fast, but you will lose it faster if you don’t know how to manage it. Trading will drain every bit of energy out of you. You will feel like you’re falling behind, you will eventually collapse at every loss and become frustrated. The market will test you; the market doesn’t give a damn about you – you accept the risk when you take on trading and since you’re the one making the trades, it’s you VS you. You’re testing yourself. You agree to test your patience, your confidence, your mindset. Doing so will make progress feel nonexistent or slow. Every day, and every trade you will question yourself, wondering if “trading” is even for you. Sometimes it will feel like you’re going in circles. You will continue to make mistakes repeatedly. It will become exhausting but remember – only experience and your own strengths will allow you to succeed. Only those who can endure the grind without giving up will make it. So, let’s start off the 5 key pointers that will prepare you. 1) Prioritize Risk Management Over Profits: Most newbies focus first on “ making money ” rather than safeguarding capital. The reality is that surviving in the market is way more important than winning every trade you see or come across. Key Points: Determine risk per trade: A common rule is risking no more than 1-2% of your trading account on a single trade. This way even a string of losses will not wipe you out. Always use stoploss: A defined maximum loss per trade enforces discipline and emotions to stay in check. Position sizing: Your sizing should be proportional to what you’re willing to lose on each trade. Bigger trades amplify the losses, but they also amplify the profits. Why it matters: Without strong risk management, even a high win-rate strategy can fail. Protecting capital ensures you’re still in the game when opportunities arise. 2) Develop a trading plan and stick to it . Random reactive trading is the best way to lose money. Build your plan overtime. Key points: Define your strategy: Building your strategy is the longest part, constant back testing and forward testing, refining and rebuilding. You’re not “switching” your strategy if you’re adding something small to it, you’re changing it if you eliminate the whole thing. Identify your form of trades, short, mid, long term or swing trades. Set clear rules: Don’t leave anything to chance, for example “I only enter trades if price closes above the 50ema and RSI is above 50” Journalling trades: Ensure to journal all your trades, “How do I journal” Easy. Record the time, date, symbol, pair, what model/system you used, images, your entry, tp and exit, why and for how long you’ll have it open. Why it matters: Consistency is a key, it pairs with discipline, psychology and lingers with risk management. Traders who follow a disciplined system perform better than those to trade off an impulsive feeling. Other words “Gamble” 3) Master one market and one system first: Beginners usually spread themselves too thin, trying forex, crypto, stocks and commodities all at once – Unfortunately for me I made this mistake at the start which made it very difficult! – Don’t do this. Stick to one market. Key points: Pick one market: Each market has its own rhythm, volatility, and liquidity. Teaching one thoroughly allows you to understand everything about it. Focus on one system: Instead of trying every new system from you tubes or forums, master one approach and refine it onwards e.g. – you trade FVGs, Win rate is 50% once you add Fibonacci it might be e.g. 65% Avoid information overload: Social media and trading forums are filled with conflicting advice, stick to your chosen approach and refine it. People say you need to have 12-hour trading days. If you do this, you will FAIL. You will grind yourself into the ground and face burnout making it very difficult to get back up again. Limit yourself to how much trading and trading study you do a day. Eg 10 back test trades, 3 real trades, 3 journaled trades, 1 hour of studying and researching the market. Without strong risk management, even a high win-rate strategy can fail. Protecting capital ensures you’re still in the game when opportunities arise. Why it matters Depth beats breadth early on. Mastering a single market and system will allow you to build confidence and improve your edge. 4) Understand the Psychology of trading. Trading isn’t just numbers: as mentioned in “understanding” it’s a test of emotional control, fear, greed and impatience. Key points: Emotions vs logic: ensure you recognize emotional reactions like FOMO (Fear of missing out) or revenge trading. Pause before reacting to a trade that will go against you. Set realistic expectations : Markets move slowly. Sometimes for months, don’t expect huge gains overnight. Just like DCA focus on compounding. Compound your knowledge and skill set. Mindset training: Techniques like medication and journaling as well as visualization can help reduce stress and maintain discipline. Why it matters: Even a diamond system can still fail if emotions drive your actions. Psychology often determines long term success, more than technical skill. 5) Prioritize learning. Then earning. Beginners fall into the trap of trading being a “get rich quick” scheme. But the real investment is learning how the market works. Key points: Paper and demo trade first: Practice on demo accounts before you use real money – you will be surprised how many times you will fail. It’s better to fail with simulation money than your McDonalds weekly wage. Review every trade: Analyze your losing trades, but also your winning trades. Find patterns and areas to improve. Continuously educate yourself: Read books about the mind, about habits, watch market analysis but critically, apply what you learn and don’t just collect information and not use it. Why it matters: Earnings are just the byproduct trading. The faster you learn and adapt, the sooner your profits will appear. Treat early losses as tuition. Not failure. Thank you all so much for reading. I hope this benefits all those who are starting off their trading journey. If you have any questions, let me know in the comments below!
King_BennyBag
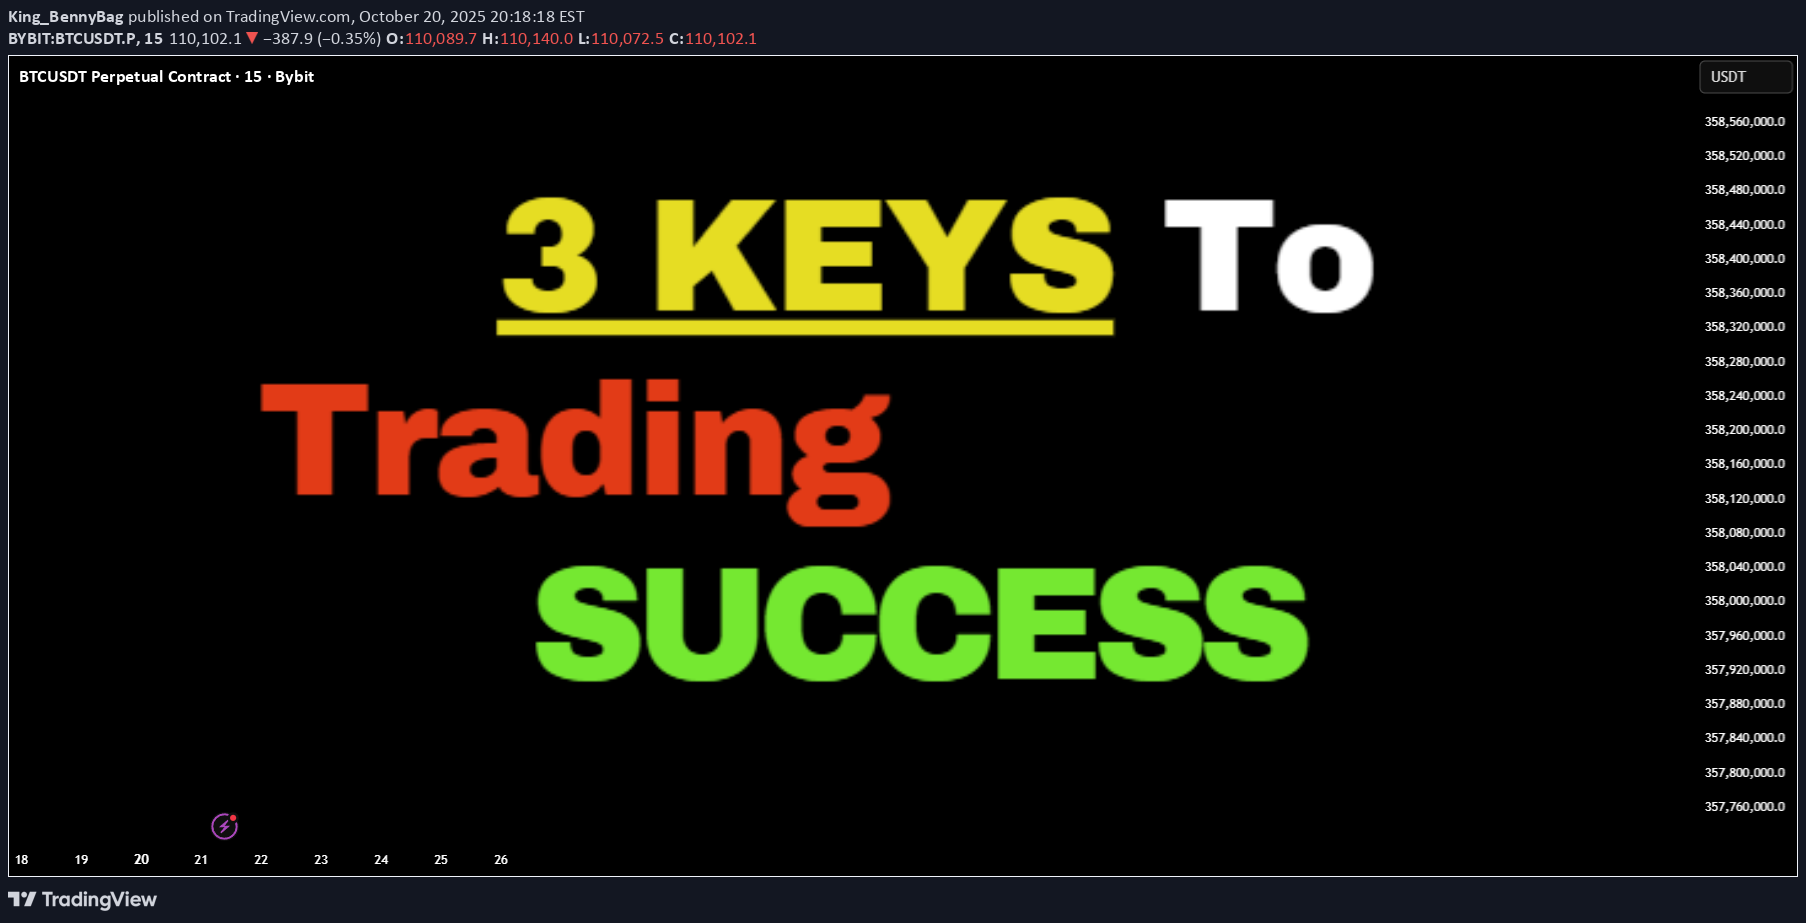
رمز موفقیت در ترید: ۳ کلید حیاتی نظم و انضباط معاملاتی که باید بدانید
Welcome back everyone to another post. In today’s article we will dive deeper into the 3 keys of Trading success! As attached below. Today we will be reviewing the Key “DISCIPLINE” Just like risk management and Psychology this is also a difficult skill to maintain. In the modern world it’s considered a skill now, because most of society doesn’t have any discipline in any field. Let’s get started. Definition: When it comes to Trading Discipline. Trading Discipline means one user has the mental ability ( strength ) to follow their system. Their Trading Plan, risk management and maintain their psychology regardless of what events happen. Trading Discipline separates profitable traders from the gamblers. (Below I have attached the article Trader or Gambler as it relates to this post, make sure to give it a read!) Discipline ensures that the user makes the right decisions based on strategy and logic instead of FOMO, ego and greed. It is not just about following rules though. Discipline relates to the outside world of cultivating habits, mindsets and self-control too. 1) Understanding Trading Discipline Firstly, you must truly grasp what it actually means. Most individual traders confuse it with stubbornness. They think it’s about holding on to trades or forcing a system. In reality, it’s only about consistency and self-control! Simple right? Example: Imagine, you have a system. A trading plan. It has the 1% rule where you don’t risk more than 1% of your account per trade. Understanding discipline means you must know why that rule is in place. It’s too protected your capital! Not breaking it after a few losses just to catch up. Real Life Analogy: A professional runner trains every day. They do it even when they are sad, tired, unhappy and unmotivated. This is discipline. Discipline drives long term results. Discipline is continuing it no matter what the current situation is. 2) Implementing Trading Discipline The process of implementation is nothing complicated. It’s only turning knowledge into action. Knowing about it won’t do anything, you must maintain the effort of consistently applying it to each step in your system. How to implement it: - Follow your plan: Before each trading day starts, read out your system and tell yourself you will follow it. Even if no set ups appear, you will still succeed because you followed your plan. - Set risk rules: Apply proper risk management and lot management so you don’t cave into fear. Apply the 1:3 Rule or 1:4 Rule. - JOURNAL your TRADES Damn it: Record every trade, your reasoning, and whether you actually followed your rules. Don’t just add a screen shot and nothing else. YOU won’t succeed if you don’t journal your trades properly. Example: A novice trader may plan to place an entry when price is at $50 and exit at $55 with a 2% risk per trade. Even if it dips to price $48, they hold to the stop loss accepting the loss instead of moving it and hoping it “recovers” Real Life analogy: Think of it as budgeting every day, or for a holiday, or your next maccas run. You set a weekly budget plan and stick to it. Even when tempted by special deals, sticking to your budget allows for long term financial health to take place. Just like risk management but with real life. 3) Maintaining Trading Discipline Discipline can’t act overnight, it’s the process of small steps working your way up to solid consistency over time. Even when feelings run high – discipline isn’t one time. It’s daily practice. Some strategies are: - Reviewing your previous trades daily or at the end of each week during a market close. Assess your wins and losses. - Build up emotional awareness, be aware of what fear, greed and overconfident emotions take place. - Reward yourself to the rules of your system, not just profitable outcomes. If you reward yourself for not trading in one day because not a single set up appeared, you were still successful because you didn’t “force” a set up and take a gamble. Example: A trader might experience 3 losses in the first hour of the day, even if they were all A++ set ups. Instead of revenge trading, he sticks to his plan, accepts the L and leaves the charts for the rest of the day to reset mentally and gain a win in another field, eg – Gym. Real-life analogy: By maintaining a healthy lifestyle, you must apply the same approach. You don’t stop exercising after a few days off. Discipline keeps you aligned even when your motivation and mental strength fades. 4) Adapting without breaking your Discipline Long story short, Markets move, Markets change, Markets can and WILL evolve. Traders must adapt. Not just allows their system to adapt, but their psychological mindset of discipline. Adapting can be confusing but it can be done by: - Don’t switch up new strategies, adjust your current system slightly then back test and forward test it on demo accounts. Eg Paper trading. - Update your trading system based on data and monthly results, not emotions. - Avoid making sudden changes right after losses. Example: Let’s say a forex strat no longer works due to low volume and volatility. A strict trader tests adjustments in their demo accounts, then incorporates them into the plan after they have received positive data from tests. Real-life analogy: A chef might change his recipe based on a specific ingredient availability but will not ignore the core cooking principles. It’s about adapting strategically, not impulsively. 5) Reinforcing Discipline Through mindset and daily life. Discipline in the trading field is just amplified by the discipline process outside of trading. It follows the exact same process. Daily habits and mindset directly impact one’s trading performance. To reinforce discipline, you can: - Maintain routines: Wake up at consistent times. Don’t wake up at 3:00am to “grind” if you do that, you’re stupid – you’ll burn yourself out and make the process harder. Plan your day and review goals. Eg do a brain dump every morning, write down or type out all ideas, thoughts and emotions and sort it out. - Practice mental training: People suggest doing personal journaling or meditation. Just go for a walk in the morning for 5 minutes. First thing in the morning, feel the fresh breeze, air, sunlight and nature. You simulate the mind and body in a natural way allowing for you to think clearly and train your mind. - Change your environment: surround yourself with work dogs, people who are strict on routines, self-improvement, self-development, individuals who don’t slack off. Example: Traders who can control their time well, exercise, eat healthy can maintain their stress in trading better than one who does not focus on outside habits. Real-life analogy: A school student who studies consistently every day and night rather than squishing it all in before exams perform better. Just like a trader who can maintain structured habits inside and outside of the market. Conclusion: Trading discipline is more than following rules, it’s a mindset and a lifestyle, it relates to the world outside of trading. Just like psychology, if you can’t master it outside, you won’t master it inside. It's about understanding your own weaknesses and adjusting the system to hold structured rules that will allow it to be more easily achievable for yourself. Remember, trading is not sunshine and rainbows. It’s about building a system and following it. It is the hardest way to make “ easy ” money. To find out what the other 2 keys are, review the 3 posts below where I explain the 3 keys to trading success, and go deeper into each of them!
King_BennyBag
مدیریت ریسک در ترید: راز حفظ سرمایه و موفقیت پایدار
Welcome everyone back to Trading view article by King_BennyBag. In today’s post we will discuss how one can understand risk management in trading, and action it. We will start off by defining what risk management is. Risk management definition: Risk management is the process of identifying your current capital and assessing what you can afford to invest and lose. Never to see again. It involves identifying risks, assuming risks and ensuring you have a planned response for before, during and after a trade. CAPITAL IN RISK MANAGEMENT: In the past, I have stated that the goal of trading is to “PROTECT” your capital first. Once you know how to protect it, you can then multiply it and risk bit by bit. To take on proper risk management, you must decide what amount you will allocate to your investments or trades. For example – you risk only 1% of your capital on every trade. INVEST WHAT YOU CAN AFFORD TO LOSE: You should only do trading with the funds that you can AFFORD to lose, even then you must be cautious and apply the process above to the same capital. Doing this eliminates the emotional pressure factor and avoids decisions that are driven by Fear of Missing Out. (FOMO) Before Trading, set a clear number on what you can lose (NEVER to see again) without it affecting your life. IDENTIFYING RISKS: Relating to my previous posts, you must have a defined trading plan/edge. This plan must allow you to identify market volatility, news events, psychological mistakes, or technical invalidation points. These are risks that must be identified BEFORE trading. Knowing these will allow you to apply the right position size correctly. ASSUMING RISKS: When it comes to assuming risks, (most people don’t factor this in) it means to accept the potential scenario of you losing, before the trade is actioned. Your stop loss (always use a stoploss!) must be defined in a way that will not get yourself liquidated. You must calculate the right position size and learn to accept the outcome of the trade, and the mental effects it has on you. Doing this, the trades & the process becomes mechanical. No longer would it be emotional. If the loss is too big and you take it anyway. You should not be taking that trade as it will encourage revenge trading. PLANNING RESPONSES BEFORE, DURING and AFTER RISKS: With trading & risk management, you must have a pre-defined response for before, during and after trades. Your risks must be set. Before the trade, you should have an entry, SL & TP set. Along with an invalidation level (if price hits a specific point, you DON’T take the trade) and a maximum risk, eg “I’ll risk max $5,000 on this trade” During the trade, you must stick to the plan, don’t adjust your SL, or TP if it’s not part of your strategy. After the trade, if you win, or lose, find out why. Was it a valid trade, did it follow your edge? Or did you take a blind gamble. If you lose, figure out why, if you won, figure out how you could have scaled it upwards. Applying these 3 factors allows the cycle of discipline to develop and grow. It then removes randomized decision making. Risk management is a crucial Key in trading. Without it – you have already lost. I have attached the 3 KEYS to trading success below. Here I go in depth on what an individual must master to be successful in trading.It's great to see people are enjoying the post and finding it useful! If you have any questions or requests, let me know!It's great to see everyone enjoying the post! again, if you have questions - Please let me know!
King_BennyBag
روانشناسی ترید: چرا ذهنیت سختترین مهارت برای تسلط است؟
Welcome all to another post. In this article we will dive into the process of Mastering Trading Psychology. 1) What is Trading Psychology: Trading Psychology, it is your mindset. It is what you think, how you feel, what you need to do, what you want to do. It is a mixture of thoughts, future actions, emotions and past, present or future behaviors that influences your present self in making good, or bad decisions in the market. It can be considered a “strategy” but leans more to a “skill” It’s about what your thought process is when you are under pressure. Everybody, investor, gambler, trader, swing trader, day trader, scalper and holders, bring their own personalities & habits into the trading space. Whether it’s impatience, or patience, fear or greed, confidence or impulsiveness, or discipline. These mental sets determine how frequently you can follow your edge and how well you can manage wins, losses and uncertainty. Trading psychology is the framework of the mind. It works for you or goes against you. Both are under your control to choose from. A strong, stable, clear mind keeps you going. A weak, broken, cluttered mind keeps you falling. Ultimately, to master trading in psychology, you need to master yourself. 2) Pros and Cons of Trading Psychology: Pros: The pros/benefits of Trading Psychology, once it is mastered, is simple. You understand the game. You understand the process. You understand why you lose, why you win, why manipulation takes place and why you trade it. It is a skill that is developed through patience and perseverance along with constant practice. Like every other skill, it demands TIME, ENERGY, and constant Trial and Error of failures, wins, adjustments and so on. It isn’t something that can be taught or learned once, except for those who learn to recognize and leverage their mental strengths & weaknesses can truly master it over time. Cons: Trying to master Trading Psychology means you need to LOSE. You need to experience loss after loss after loss after loss. You need to fail many times. Every time you fail, you understand how to take control of your emotions, you learn where things went wrong, you learn how to build your edge. But it’s not always about losses, it’s about gains (wins )too. You need to maintain a stable status of emotions whether you win or lose. You can’t show anger, you can’t show excitement. Because both will come back at you with another loss. This means you cannot allow yourself to be ruled by any emotion, positive or negative. It can be a long uncomfortable process that can take years to master. Sometimes even decades. What makes it more challenging is that trading psychology does not exist in isolation. Psychology outside of trading must be mastered too. How you think, act, live, every single day. - We will explore this topic further down the article. 3) Why it is important in the trading space: Psychology is an essential topic that must be taught and considered. Because without it, you will not succeed. Without self-control, or a strong mind, trading will become nothing more than just gambling like a slot machine. It's a skill that many overlook. With it, you are aware of what works and what fails. It allows you to step back and re-assess the next trade instead of forcing it. The end goal is to make money, but to even do that you first have to protect your capital. Only take A++ Set ups (High confluence/probability set ups) and avoid any traps involving emotions like: Fear of Missing Out (FOMO) or the “I just need 1 good pump” (One Big Win) Mindset. With it being in the trading space, it gives users the ability to pause, re-assess and question your decisions on the trade you are about to take. It helps to mention, “Is this an A++ Setup?” “Does it align with my strat, my edge, my goals?” If it does not and you decide not to take it, you save yourself a loss of capital and have made a win of improved trading psychology. It assists you in distinguishing the difference between good/bad trades. Not on the result but the process. It keeps you grounded. 4) How to Master Trading Psychology: Just because it is difficult & challenging, does not mean it is impossible. First step – building discipline through consistency and structure. Ensure you have a clear trading plan set up. One that defines your edge or can be adjusted to find your edge. Commit to following it no matter what the market is doing. Pumping, Dumping or consolidating. Consistency in action will build mental strength. Secondly, you must work on emotional control. Understand and be focused on how you feel when you experience fear, greed, or overconfidence. These emotions push you off your plan if you let them take over. Each time this happens, you must log it. That way you can accumulate data and self-awareness. With that, everyone says this. BackTEST or at least forward test you strategies extensively. Keep a detailed journal that has a good list of questions that you must answer after each trade. Be brutally honest with yourself. Don’t hide losses because you have already hit 10 in a row. Log them all down. This way you will then be able to recognize emotional triggers and recurring patterns appearing that are holding you back. Being able to recognise them is the first step to controlling them. OBSERVE YOURSELF. While this takes place, you must begin to build trust in your system (strategy) and in yourself. You will see how your actions and choices line up with your plan. That way your confidence will shift from emotions to process driven. Last one is patience. The hardest yet most critical psychological skills. Take ONLY A++ set ups, for example a set up that has 4 confluences or 5 lining up. Doing this trains your mind into avoiding impulsive behavior or falling into FOMO based environments. To see another deep dive into mastering trading psychology, review the post below to determine which mindset you currently have. Are you a trader? Or are you a gambler. 5) How Psychology in our daily lives affects our ability to trade: Trading Psychology is an interesting concept, but so is psychology in general. The human mind is weak and for it to be strengthened, it takes time & self-awareness. A weak mind won’t get you anywhere. Psychology is not a simple one sentence definition. It can mean many things, or many situations. It is a critical role in our life, it shapes our emotions, reactions and choices. It can lead us to self-sabotage or it can lead us to success. If you cannot control your psychology outside of trading, you won’t be able to control it inside of trading. By this I mean daily emotions. For example: Imagine an individual experiences a breakout, they are sad, they are angry, they are emotionally drained and hurt. Then they go off to trade. They will LOSE. This is because when the mind is in an uncomfortable state, it seeks a dopamine hit, and when they associate a win in trading = dopamine hit, they naturally turn towards trading. They want to feel that dopamine hit, so they can feel good again. But then they are no longer following their edge. This destroys discipline, objectivity and focus. This is not just tied to relationship breakups, but everything in our day to day lives. If you experience a bad day at work, failed an exam, argued with family, or facing a stressful time. If you bring unresolved emotions, thoughts and feelings into the trading space, trading just becomes a big emotional outlet. Psychology appears in every action we do, EVERY day. “I need to drink water” I will get water. I see soda, “I now want soda.” The mind now as switched completely from the main objective “Water” to soda. If you cannot control your mind to stick to what is right, then you will not master trading psychology. The better control you have over yourself, & your mind, the more consistent and rational your trading decisions will become. KEY POINTS: 1) What is Trading Psychology: - Trading psychology is the foundation of every mental action. You must master yourself before mastering the market. 2) Pros & Cons of Trading Psychology: - Trading Psychology cannot be mastered without failure, each loss has a lesson, that lesson is based around strengthening your mind with emotional control. 3) Why it is important in the Trading Space: - Without a strong mind, trading turns into gambling, you must become disciplined and maintain self-control. This splits pros from the gamblers. 4) How to Master Trading Psychology: - Right to the point: Consistency & discipline, emotional awareness, journaling, and most importantly, being patient. These are core aspects of mastering your mindset and obtaining the right psychological discipline. 5) How daily psychology affects trading: - The way you manage your everyday emotions outside of trading mirrors the way you will end up reacting to the markets. Control your life, then control your trades. Psychology is a great skill, but it’s only part of 3 keys that will lead you to success. Find out the 2 other keys below: Thank you all so much for reading - I hope this post brings a lesson into everyone's trading journey. I am aware that this is a big long article, however Trading psychology goes even deeper - I have summarized my knowledge and research that I have obtained over time and summarized it. Please let me know if any of you would like an a post on a specific topic. I'd love to provide more for the community!
King_BennyBag
سطوح روانی در ترید: کلید درک رفتار بازار و شکار نقدینگی
Definition: In Trading, Psychological levels are often called round numbers or psy levels. This is because the price ends in zeros and fives naturally attracting a trader’s attention. Examples: • Forex: 1.0000, 1.0500, 1.1000 • Stocks: $50, $100, $150, $200, $250 • Cryptocurrency: $10,000, $15,000, $20,000, $25,000 These levels are crucial as traders instinctively see targets in round numbers. (Or Incremental levels such as 5, 10, 15, 20, 25, 30 and so on... This causes many buy, sell, and stop orders to cluster around the same price zones, creating self-reinforcing areas of interest in the market. Again, price sits at 113.2k – Psychological level is 115k. ___________________________________________________________________________________ Why Psychological Levels Matter in Trading 1) Human Bias: Traders and investors often place orders at simple, rounded numbers. This makes their charts and order list “Clean.” 2) Institutional Targeting: Large groups, whales or organizations use these levels to find liquidity or trigger stops. (Eg, BTC swept 125k before dumping) 3) Market Memory: When a Psychological level reacts, traders remember it, and it often becomes relevant again in the future. (Turns into a prev liquidity sweep.) 5) Order Clustering: Stop losses, take profits, and pending orders frequently build up around these areas. (As above, it builds liquidity.) __________________________________________________________________________________ How to Identify Psychological Levels Begin with marking clean, round (or quarterly) numbers on your chart. These are often major levels such as 4.0000, 5.0000, or 6.0000. See the example below: Then identify the midpoints/quarter points between them, like 4.5, 5.5, 6.5, 7.5, 8.5 See the example below: For stronger assessments, look for psychological levels that align with other forms & tools of technical confluence—such as previous S & R, Supply/Demand, Highs & Lows, Fibonacci retracements, trendlines, or volume clusters. See the example below: When multiple forms of technical evidence converge near a round number, the level tends to have greater impact. __________________________________________________________________________________ Trading Around Psychological Levels When price approaches a psychological level, three common behaviors can occur: 1) Rejection: Price touches the level and reverses quickly, suggesting strong defense by buyers or sellers. (Liquidity Sweep) 2) Break and Retest: Price breaks through the level, then revisits it to confirm it as new support or resistance. 3) Compression or Grind: Price consolidates near the level before a breakout as liquidity builds up. Practical Application: Enable alerts slightly before major psychological levels to observe reactions in real time (for example, 4.45 instead of 4.5 ). Wait for confirmation using price action such as a clear rejection wick, an engulfing candle, or a BOS (Break of Structure). Combine this analysis with liquidity or other forms of technical tools for a stronger assessment. __________________________________________________________________________________ Trader Behavior at These Levels Market reactions at psychological levels are largely directed by emotion and herd (Group) behavior. Fear of missing out can push price through a round number with momentum & speed while profit-taking can trigger short-term reversals & rejections. Stop hunts are also common, where smart money briefly pushes prices beyond a round level to collect liquidity before reversing. (From 4.0 up to 4.25 then down again) Because many traders watch these same levels, reactions often repeat, reinforcing their significance. __________________________________________________________________________________ Example: BTC/USD for $125k When Bitcoin approaches $125k, many retail traders view it as a significant threshold. They might place short orders just below it or stop just above. Institutions recognize this and may intentionally push prices above $125k (sweeping $126k) to trigger those stops and fill large positions. Once that liquidity is collected, price can reverse, and the $125k area may later serve as a new resistance zone. This type of liquidity hunt and reversal pattern occurs frequently across all markets. __________________________________________________________________________________ Practical Tips 1) Never trade purely based on a round number. Always wait for confirmation through structure or price action. (Retests, MSS, BOS, candle patterns etc) 2) Use alerts & alarms rather than fixed lines; prices often wick slightly above or below the exact level. 3) On higher timeframes, psychological levels often act as major turning zones. On lower timeframes, they tend to attract short-term reactions. (Lower the time frame, the more reactions = constant noise) 4) Combine psychological levels with liquidity, order flow, or volume analysis for a more complete view. __________________________________________________________________________________ Summary Psychological levels are where human reactions and liquidity meet. They represent areas of emotional and institutional/organizational interest rather than fixed points of reversal. By understanding how traders behave around these zones and observing how price reacts to them, you can determine key movements with greater confidence.
King_BennyBag
۳ کلید طلایی موفقیت در ترید: روانشناسی، مدیریت ریسک و تداوم
Today we will discuss about the 3 Keys I believe are required for succeeding in trading. When you enter into the trading field, you quickly understand that it’s not just about charts and setups — it’s about mastering yourself mentally. There are 3 keys that separate those who last from those who don’t in Trading: ( 1 ) Psychology ( 2 ) Risk Management ( 3 ) Consistency Every single one is equally important, but how you balance them determines your long-term outcome when trading. 1 ) Psychology — Master Your Mind Before You Master the Market Trading, the mental game disguised as a financial one displaying 1s and 0s winners and losers. The market, the charts, the currency, they do not care who you are, what you think, or how badly you want to win. It simply exposes your strengths and weaknesses in the world of psychology . Most traders lose, this is not because they lack knowledge, but because they cannot control their emotions, feelings — fear of losing, fear of missing out, greed after a win, hesitation after a loss, anxiety, frustration, impatience. Every emotional outburst leads to poor decision-making: closing early, revenge trading, over-leveraging, or ignoring your plan, right after you told yourself you were going to lock in and turn $100 into $1000000. To master psychology: ( 1 ) Detach from the outcomes/end-result. Focus on executing well, not whether a trade wins or loses. Follow your plan. ( 2 ) Think of probability. Every setup, every trade must have an edge — not a guarantee. ( 3 ) Accept losses as part of the process. Losses are tuition fees in this business. Every loss is a win, because there is a lesson to be learned. ( 4 ) Stay grounded. Journaling, mindfulness, and post-trade reflection go a long way. Keep track of trades and review them during down time. When your mindset stabilizes, when your thoughts are calm, your trading skills become consistent. The charts don’t change — you do. In terms of training your mindset, see my previous post below which explains the difference between a Trader and Gambler. This is an excellent article for those who want to BECOME a trader. 2. Risk Management — Protect Before You Profit If psychology keeps your calm, risk management keeps you alive. This is the part most traders skip — until they learn the hard way and blow their own capital, or 10 fundeds in a row. Your number one job as a trader is not to make money. It’s to protect capital so you can focus on staying in the game long enough for your strategy and edge to play out well. Practical risk rules: ( 1 ) Never risk more than 1–2% of your capital on a single trade. (If you do, you increase the emotions of greed) ( 2 ) Always know your max loss before entering — no guessing, if you do not? Your loss, your fault. ( 3 ) Use stop-losses logically, not emotionally. Set them at resistances or supports. Key levels. ( 4 ) Avoid over-leveraging. Leverage magnifies both wins and mistakes. Higher the leverage, higher the risk. ( 5 ) Don’t chase. Missed trades are better than blown accounts. Record them down and log emotions. Good risk management doesn’t make you rich overnight — but poor risk management will make you broke instantly . You don’t need huge wins to grow; you just need small, controlled losses and consistent execution throughout your trading journey. 3. Consistency — Discipline Over Drama Consistency is the glue that holds everything together, risk management to Psychology. It’s easy to stick to your plan for a week; but it is hard to do it for months without deviation and drifts. But that’s exactly what separates traders who make it from those who burn out. Consistency means: ( 1 ) Showing up daily, sticking to a fixed plan of study, back testing, assessing. ( 2 ) Following your trading plan with discipline. ( 3 ) Reviewing your trades honestly — both wins and losses. (Are YOU doing THIS?) ( 4 ) Avoiding impulsive changes just because of one bad day. Take a break if the loss affects you badly. Progress in trading is slow and often invisible. You might not notice improvements week to week but look back after six months of focused consistency — and you’ll realize how far you have come. Remember, slow and steady wins the race. This is a game of Tortoise v Rabbit. Push fast and hard and you will make mistakes – be slow and steady and you will win the race. Stepping back to view the bigger picture Trading success isn’t luck — it’s the result of compound discipline, calculated trades and timing. ( 1 ) Psychology gives you control. ( 2 ) Risk management gives you longevity. ( 3 ) Consistency gives you results. When you align all three, everything starts to click. You don’t need to master the market — just master your mindset, your risk, and your routine . The profits follow naturally. Thank you all so much for Reading. I hope this post becomes beneficial to you!
King_BennyBag
آیا بیت کوین به ۱۲۵ هزار دلار میرسد؟ راز تداوم صعود و سطح کلیدی شکست!
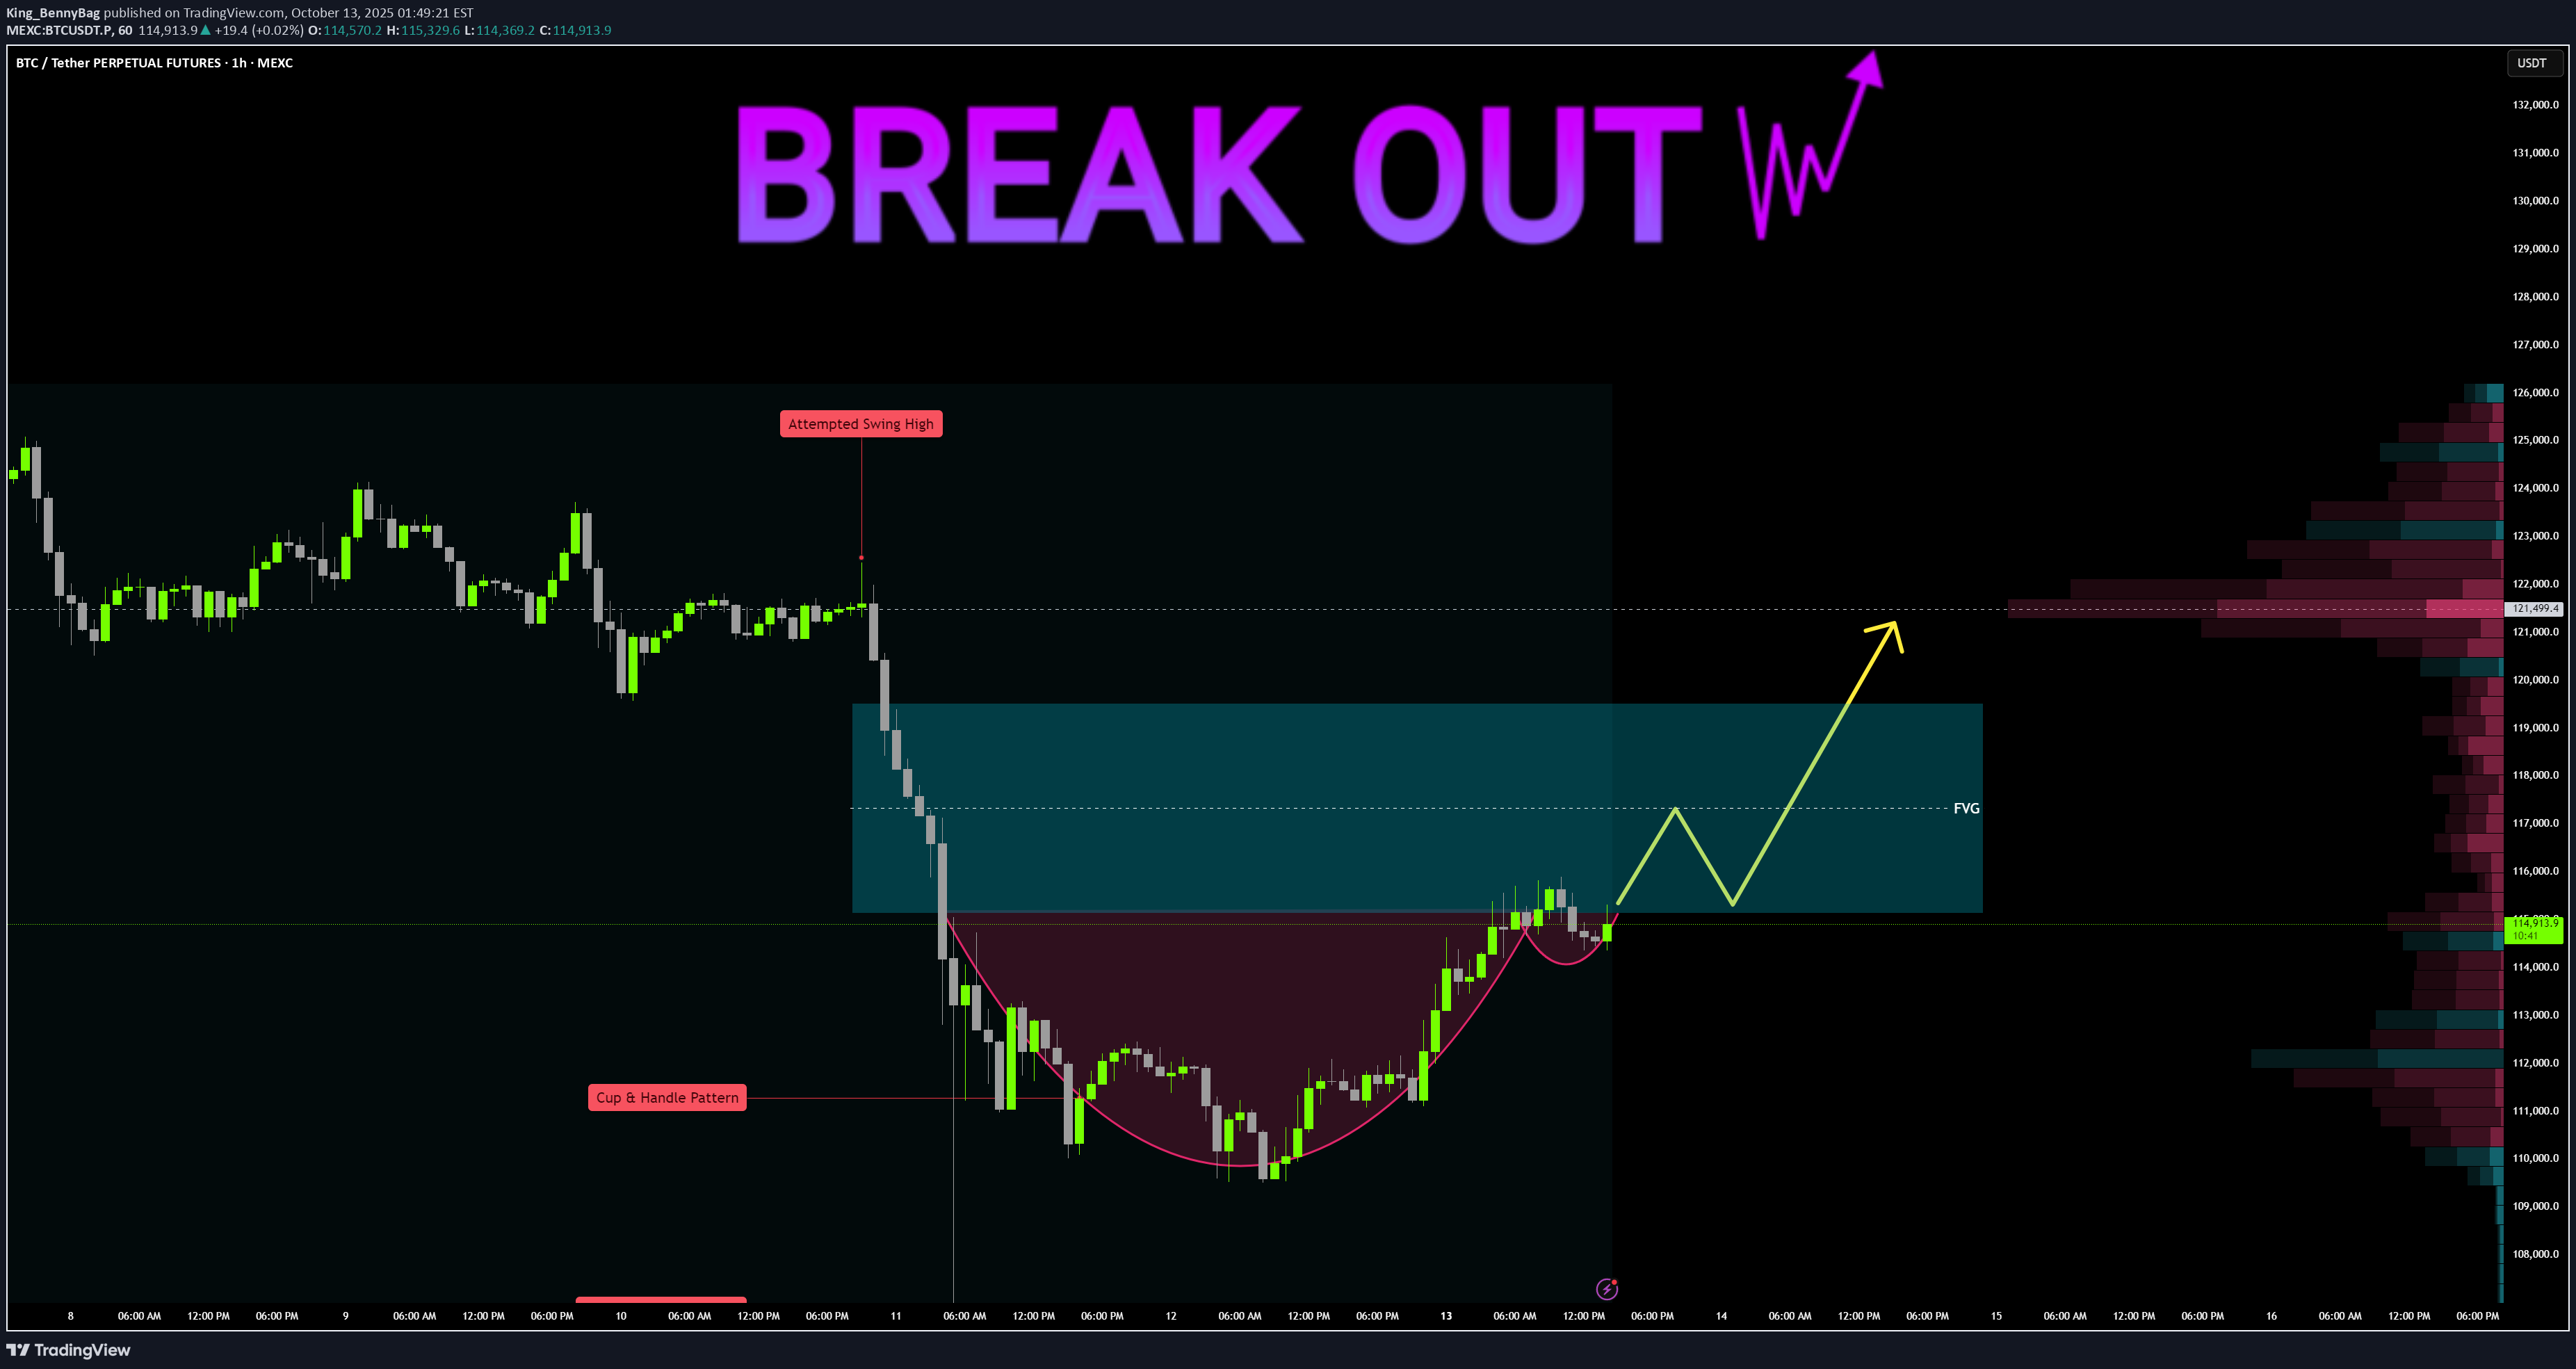
BTC/USDT 1H – Breakout Setup Cup & Handle forming right under FVG zone, showing early bullish intent. Recent tariff crash created the swing low and possible reaccumulation zone. POC: 121K — strong magnet if price breaks higher. Key Levels: 🔹 115K → Breakout confirmation level 🔹 120K → Mid FVG / Resistance 🔹 121K → POC target 🔹 125K → Next liquidity zone 🔹 110K / 105K / 100K → Downside supports Bullish case: Close above 115K = breakout → target 121K–125K (FVG fill + liquidity grab). Bearish case: Fail to hold 115K → drop to 110K → 105K → 100K possible. Summary: Cup & Handle under FVG + tariff crash low = potential bullish reversal zone. Watch 115K — that’s the key trigger for direction.
Disclaimer
Any content and materials included in Sahmeto's website and official communication channels are a compilation of personal opinions and analyses and are not binding. They do not constitute any recommendation for buying, selling, entering or exiting the stock market and cryptocurrency market. Also, all news and analyses included in the website and channels are merely republished information from official and unofficial domestic and foreign sources, and it is obvious that users of the said content are responsible for following up and ensuring the authenticity and accuracy of the materials. Therefore, while disclaiming responsibility, it is declared that the responsibility for any decision-making, action, and potential profit and loss in the capital market and cryptocurrency market lies with the trader.