Technical analysis by King_BennyBag about Symbol BTC: Sell recommendation (12/13/2025)

King_BennyBag
بیت کوین به 110 هزار دلار میرسد یا سقوط میکند؟ تحلیل تکنیکال و سطوح کلیدی پیش رو
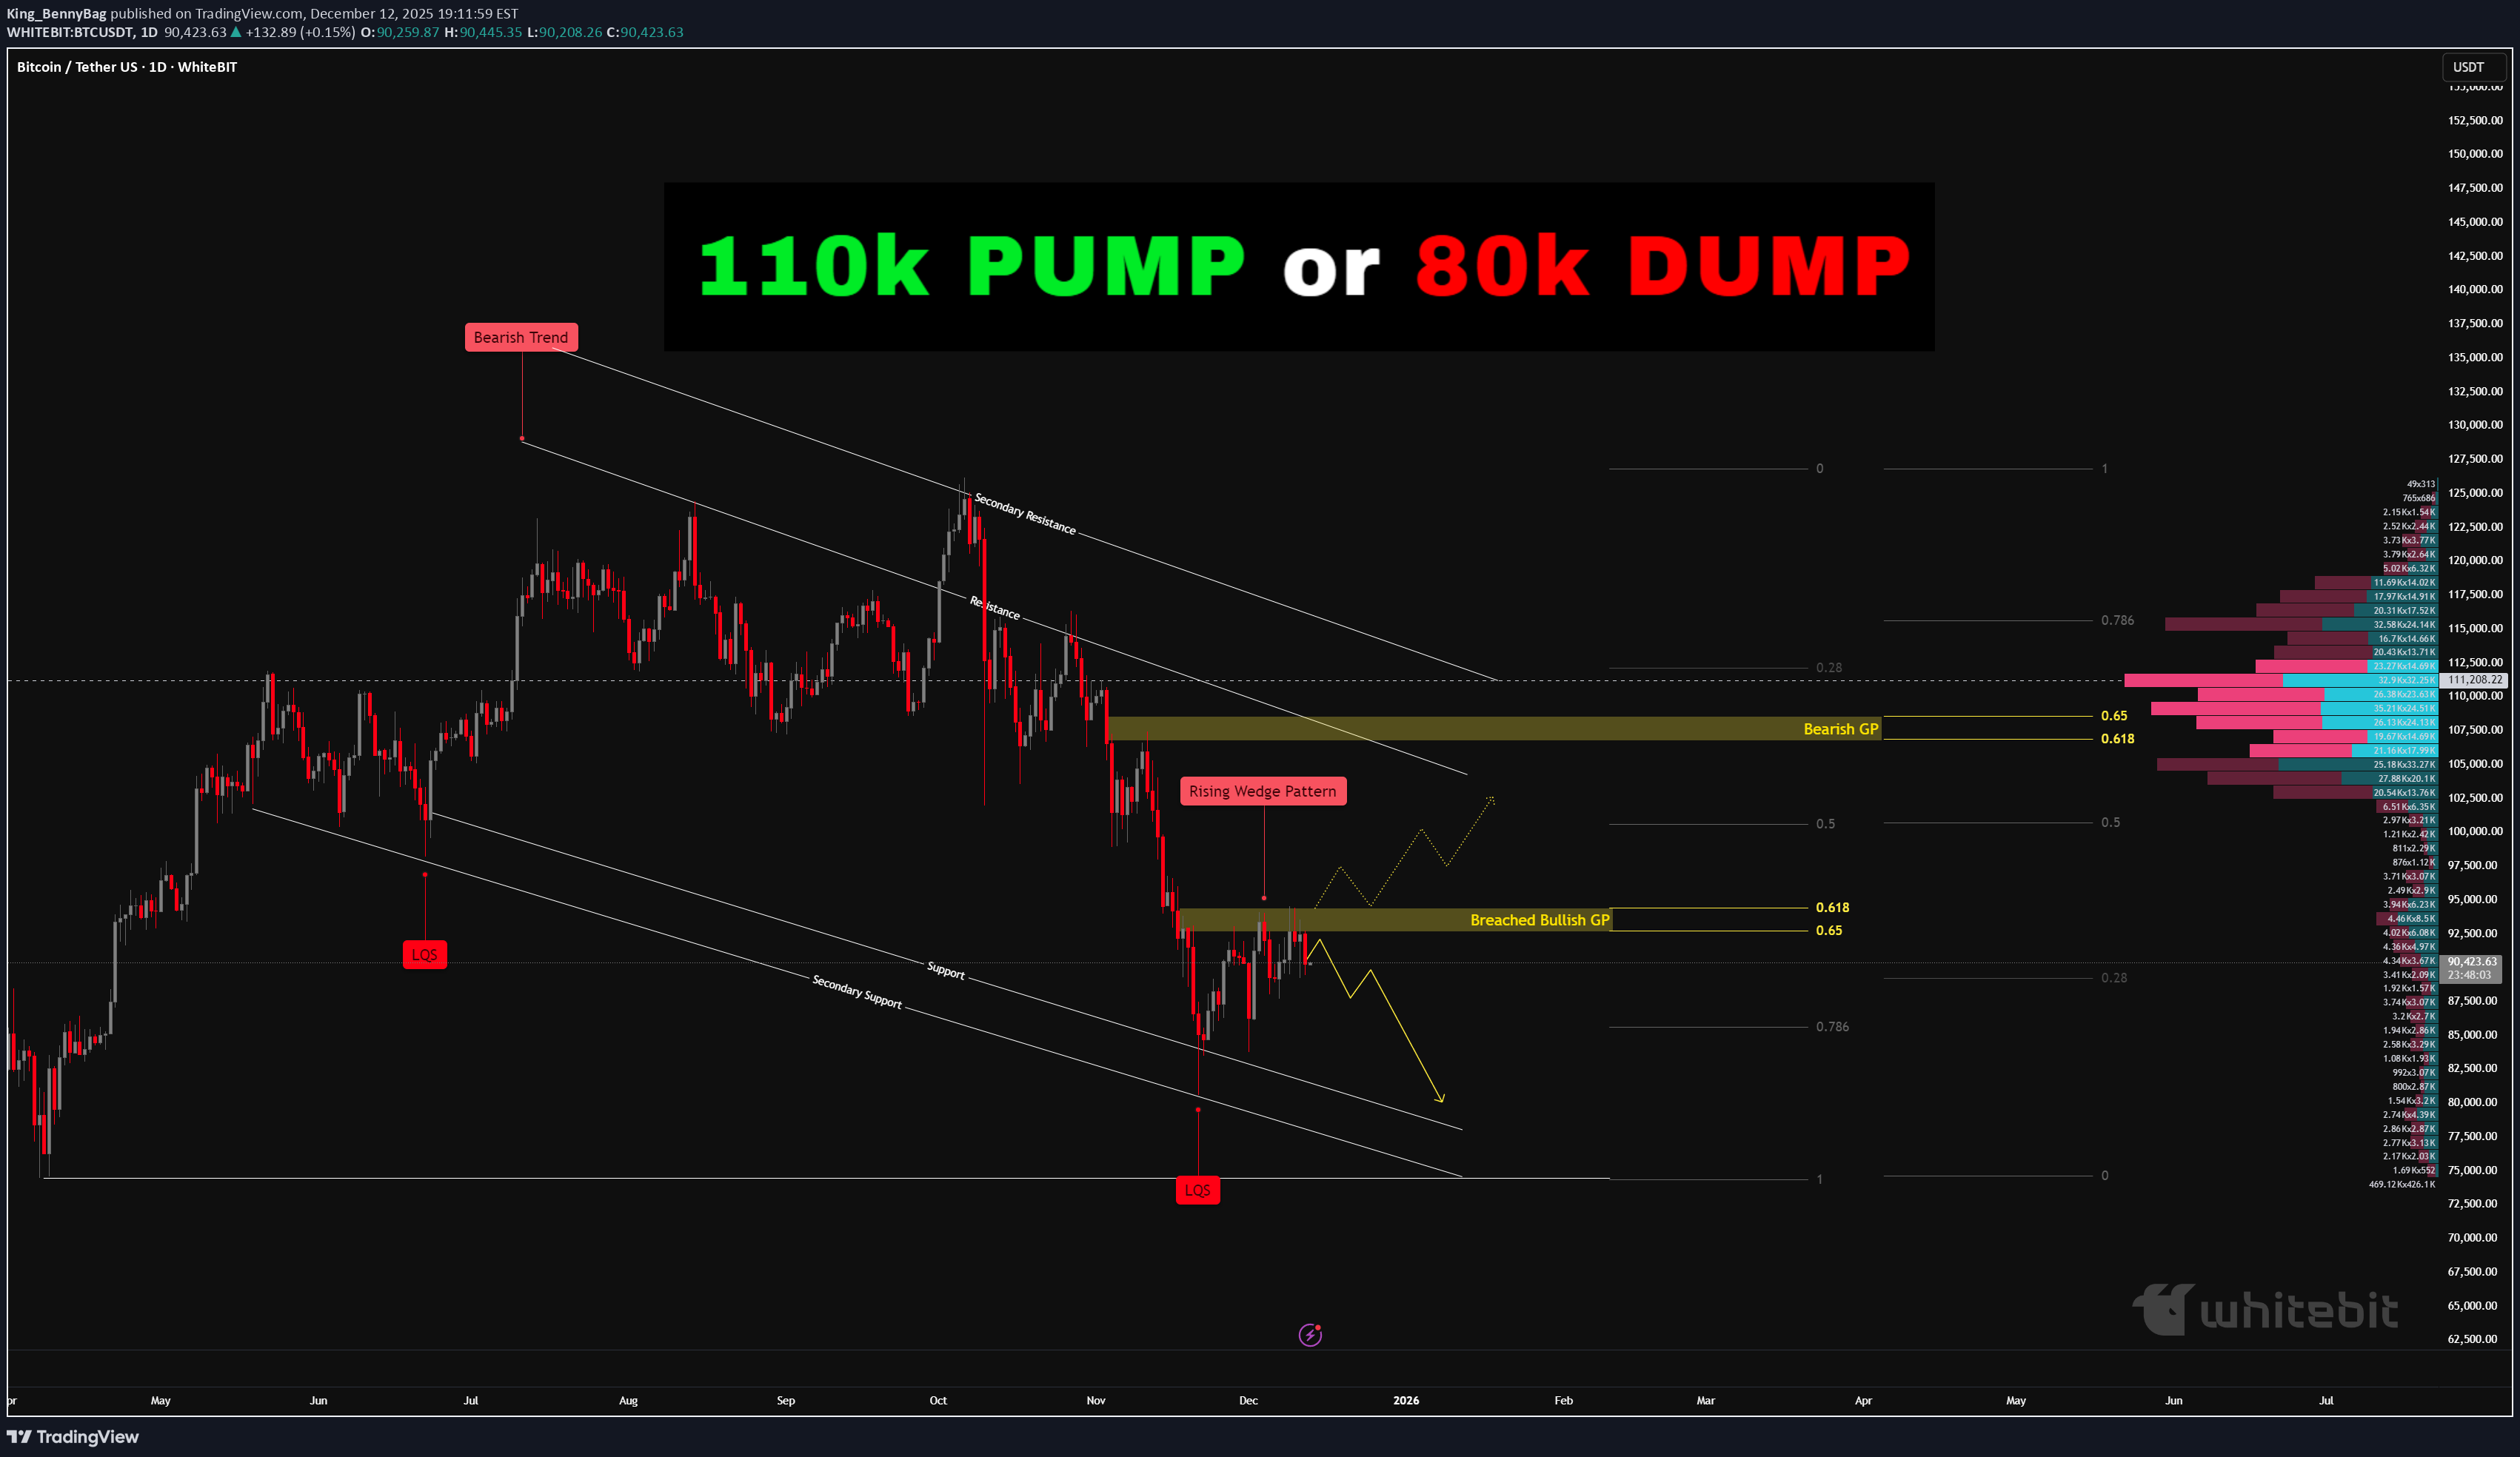
Bitcoin Market Assessment – WhiteBit Chart & Exchange (Daily Time Frame) Welcome back everyone. Today we will be evaluating Bitcoin using the WhiteBit chart on the daily time frame. Market Overview Bitcoin recently surged to 126k, sweeping liquidity at the highs. Shortly after, the market sold off aggressively partly amplified by tariff news—which reinforced the upper resistance zone and caused price to break back below it. Price continued to decline sharply, reaching 80.3k, where millions in positions were liquidated. Current Technical Structure 1. Breached Bullish Golden Pocket Price has broken below the bullish Golden Pocket (0.618–0.65). Once breached, this zone typically flips into resistance, which is what we’re seeing now. 2. Rising Wedge on the 4H On the 4-hour chart, price is forming a rising wedge, a pattern that often precedes continuation to the downside. This wedge aligns directly with the breached Golden Pocket, forming a strong confluence of resistance. 3. Trend Context Price action is still within a high-time-frame bearish trend, and the recent push upward appears to be a standard bearish pullback rather than a shift in structure. These combined factors suggest the possibility of a deeper move down. Downside Levels of Interest 0.786 Fibonacci Retracement (~85.6k) Next discount zone and logical target if the bearish structure continues. 80k Psychological Level A major high-volume and psychological area. If 85.6k breaks, a retest of 80k becomes probable. Bears are clearly targeting this zone. Volume Profile Insight Using the anchored volume tool, a significant cluster of volume sits around 111k—just above the key 110k level and very near the bearish Golden Pocket (0.618–0.65). This area has not yet been retested. On higher time frames, the bearish Golden Pocket often acts as the ideal retracement zone before price continues lower. This creates a compelling upside target if the bearish scenario invalidates. Market Tone Momentum remains weak on the bullish side, with sellers maintaining control. As long as price remains below the breached Golden Pocket, the market structure continues to favor the downside. Scenario Summary Bullish Scenario Price breaks above and closes above the breached bullish Golden Pocket (0.618–0.65 zone). Sustained strength above this level opens the door for: - 110k retest, aligning with major volume at 111k - Potential wick or extension into the bearish Golden Pocket This would temporarily invalidate short-term bearish momentum. Bearish Scenario (Primary) Breached Golden Pocket continues acting as strong resistance. Rising wedge breaks down. Price targets: - 0.786 Fib at 85.6k - 80k psychological level if 85.6k fails - Overall bearish trend remains intact, with bulls showing weakening momentum. Thank you all so much for reading. BTC has made a lot of reactions take place this year, from record breaking highs to record breaking liquidations of 19 Billion in just a few hours! It is important to be cautious, risk only what you can afford to lose and ensure you take on proper risk management. Make sure to follow and comment below what you think! If you would like any guides, or assessments of specific crypto currencies done, let me know!On the Topic of wedges! Checkout the guide below that features "How to Trade wedges!" In 5 steps!As we charted up! Price rejected and is continuing it's down trend.