
KhalidUsman
@t_KhalidUsman

What symbols does the trader recommend buying?
Purchase History
پیام های تریدر
Filter
KhalidUsman
فرصت طلایی خرید اتریوم: آیا ETH به اوج تاریخی 4951 دلاری بازمیگردد؟
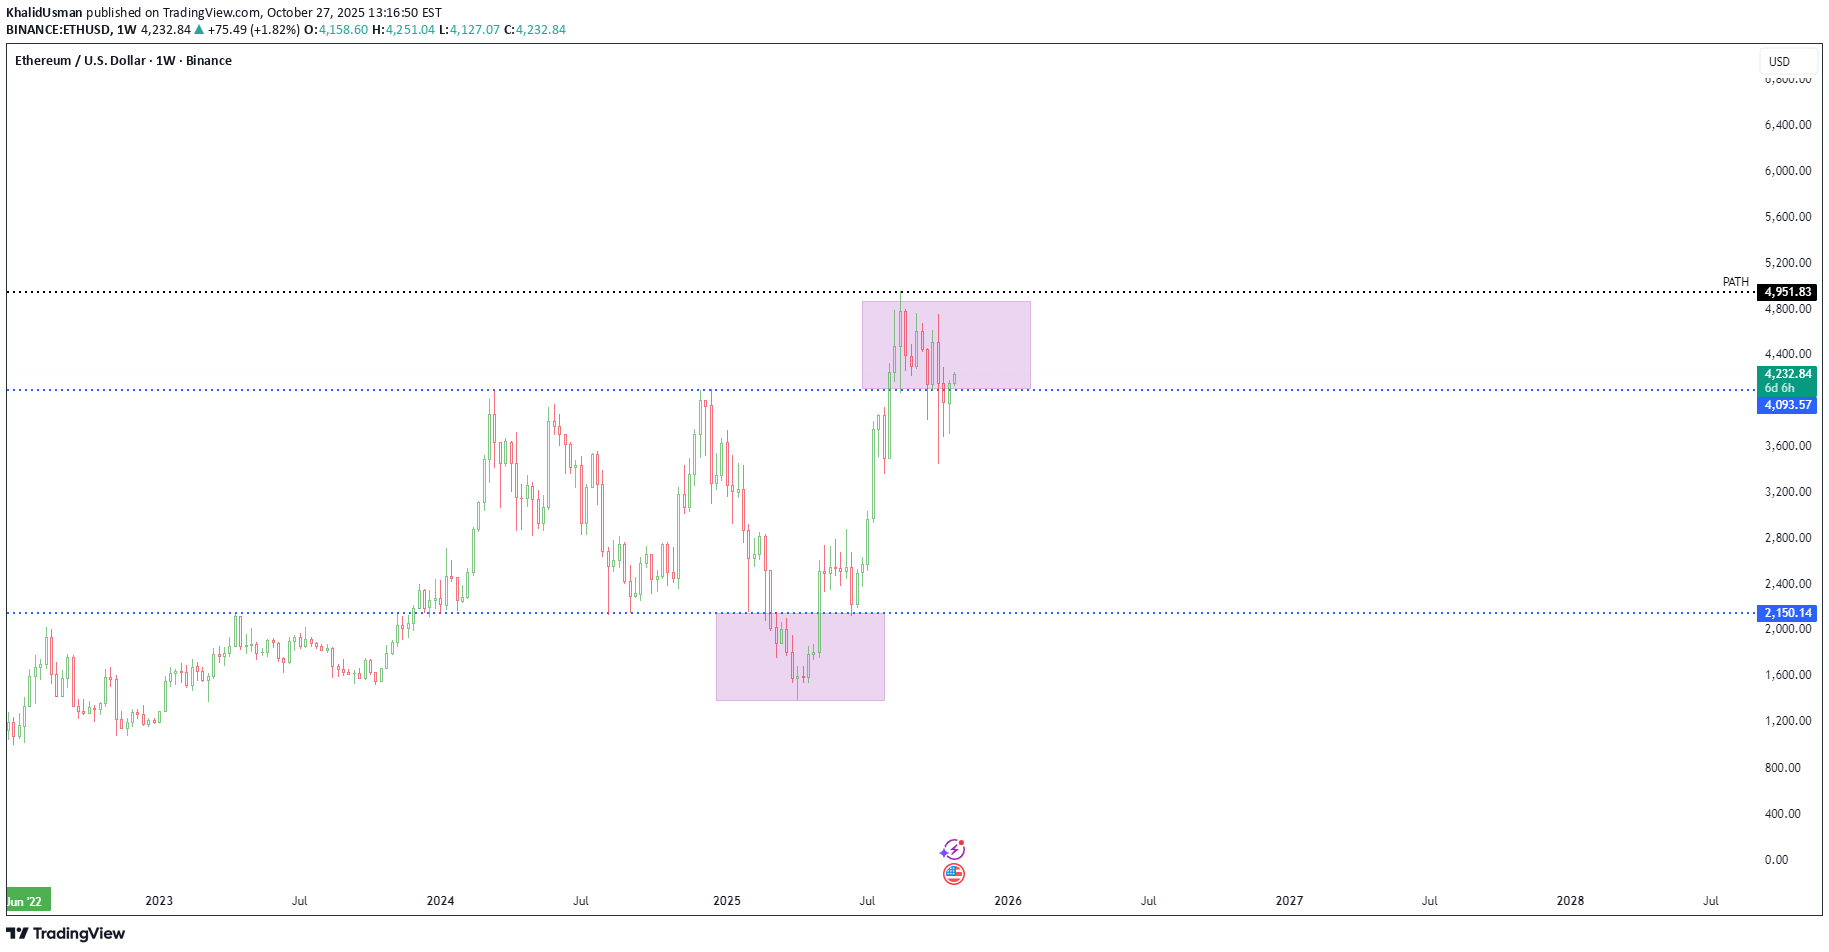
Previous week Ethereum closed above weekly resistance level $4093. Currently trading within a top range. ETH has decisively broken above the prior week's High, signalling continued bullish momentum. The probability of ETH retesting its previous all-time high of $4,951 in the near future is very high.
KhalidUsman
فرصت خرید طلایی سولانا: آیا قیمت به ۲۵۰ دلار میرسد؟
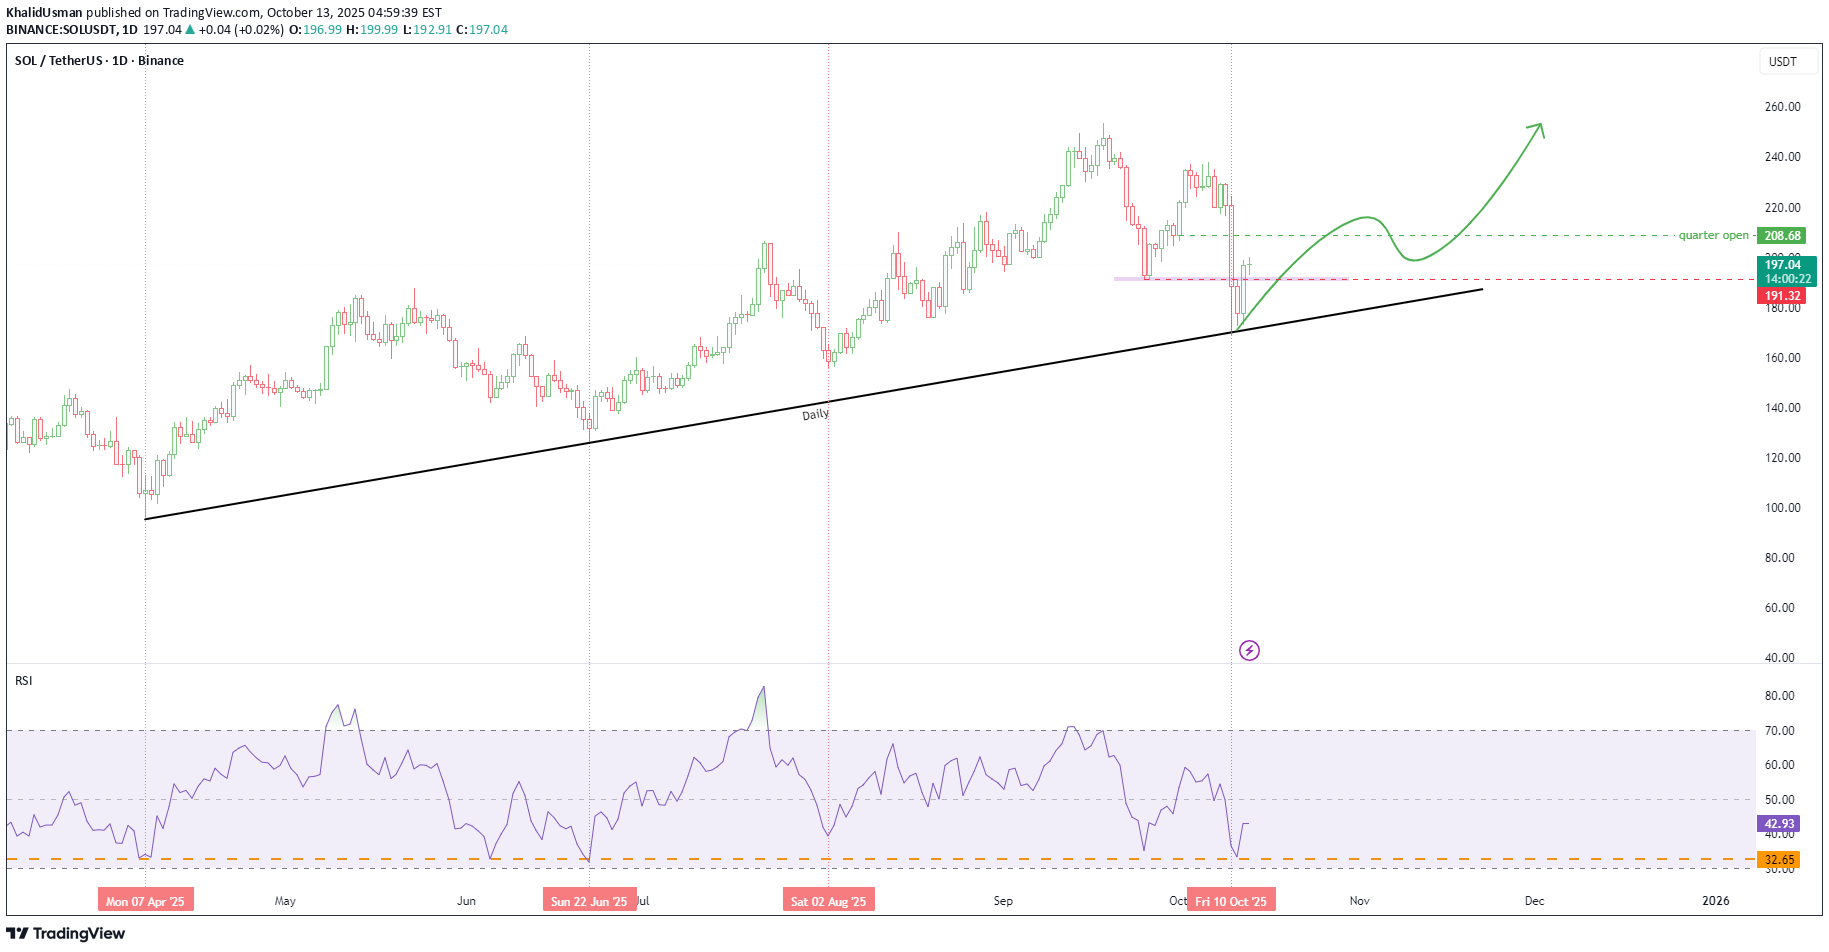
Solana has established support at the daily trendline and successfully closed above the key daily resistance level at $191.32. The daily RSI is also indicating a potential buying opportunity, suggesting renewed bullish momentum. If this upward trend continues, the next potential target for Solana is around $250.
KhalidUsman
پیشبینی انفجاری لینک (LINK): موج پنجم صعودی آغاز شد!
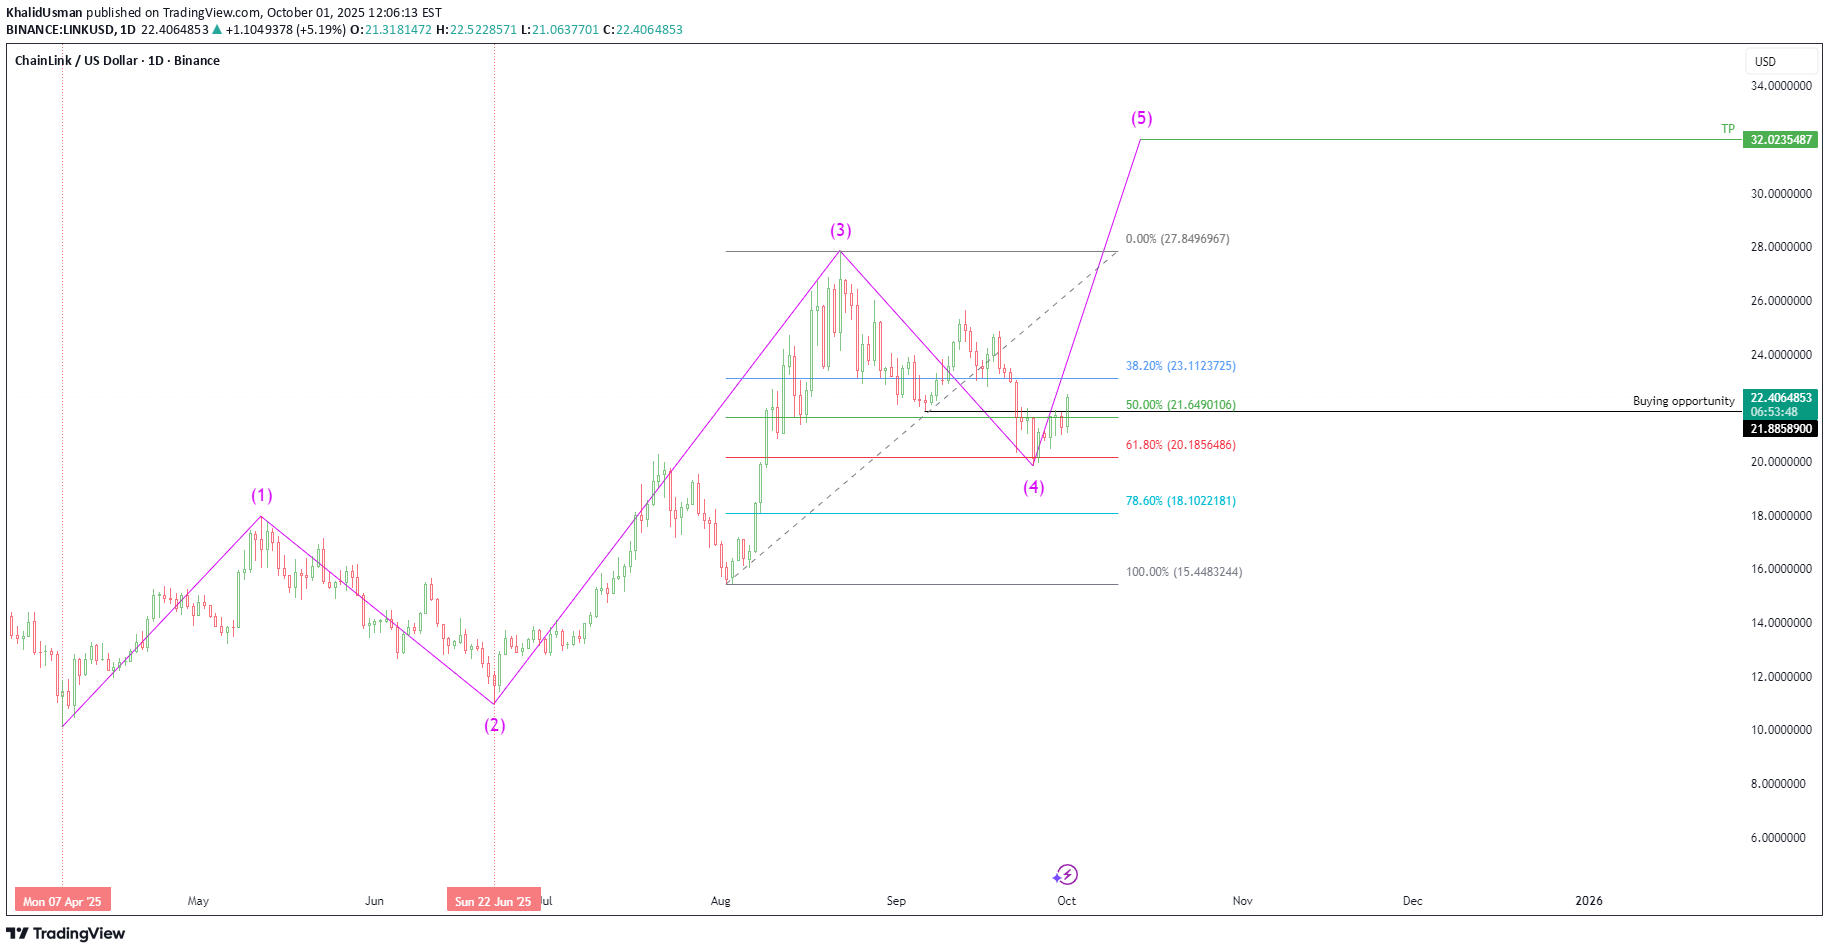
Based on Elliott Wave Theory, Chainlink (LINK/USD) appears to have successfully completed its corrective Wave 4, as evidenced by the recent stabilization and reversal patterns observed on the daily timeframe. This completion sets the stage for the anticipated impulsive Wave 5, which is now clearly visible on the daily chart. The structure suggests a continuation of the broader uptrend, with increased momentum likely to drive prices toward higher targets.
KhalidUsman
Solana - Elliott Wave Analysis
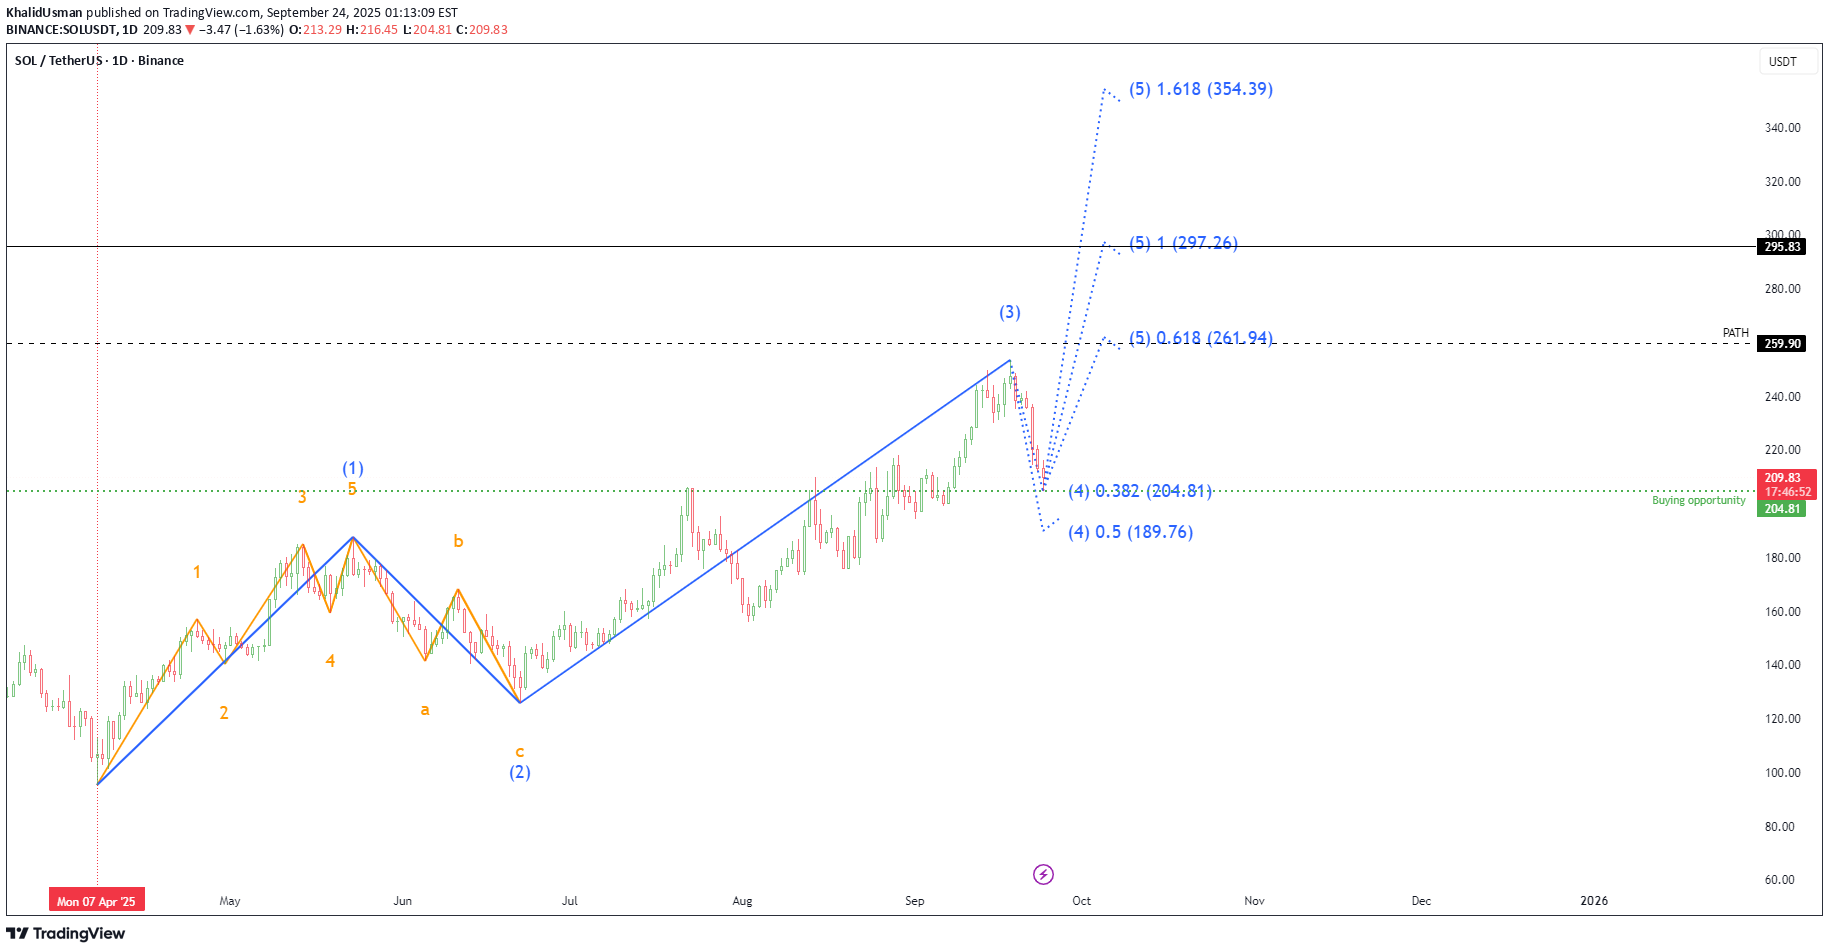
Based on Elliott Wave Theory, Solana appears to be completing Corrective Wave 4, with a potential buying opportunity in the $189 – $204 range. The market structure suggests the development of Impulse Wave 5, which is becoming increasingly evident on the daily chart.
KhalidUsman
BTCUSD Bearish
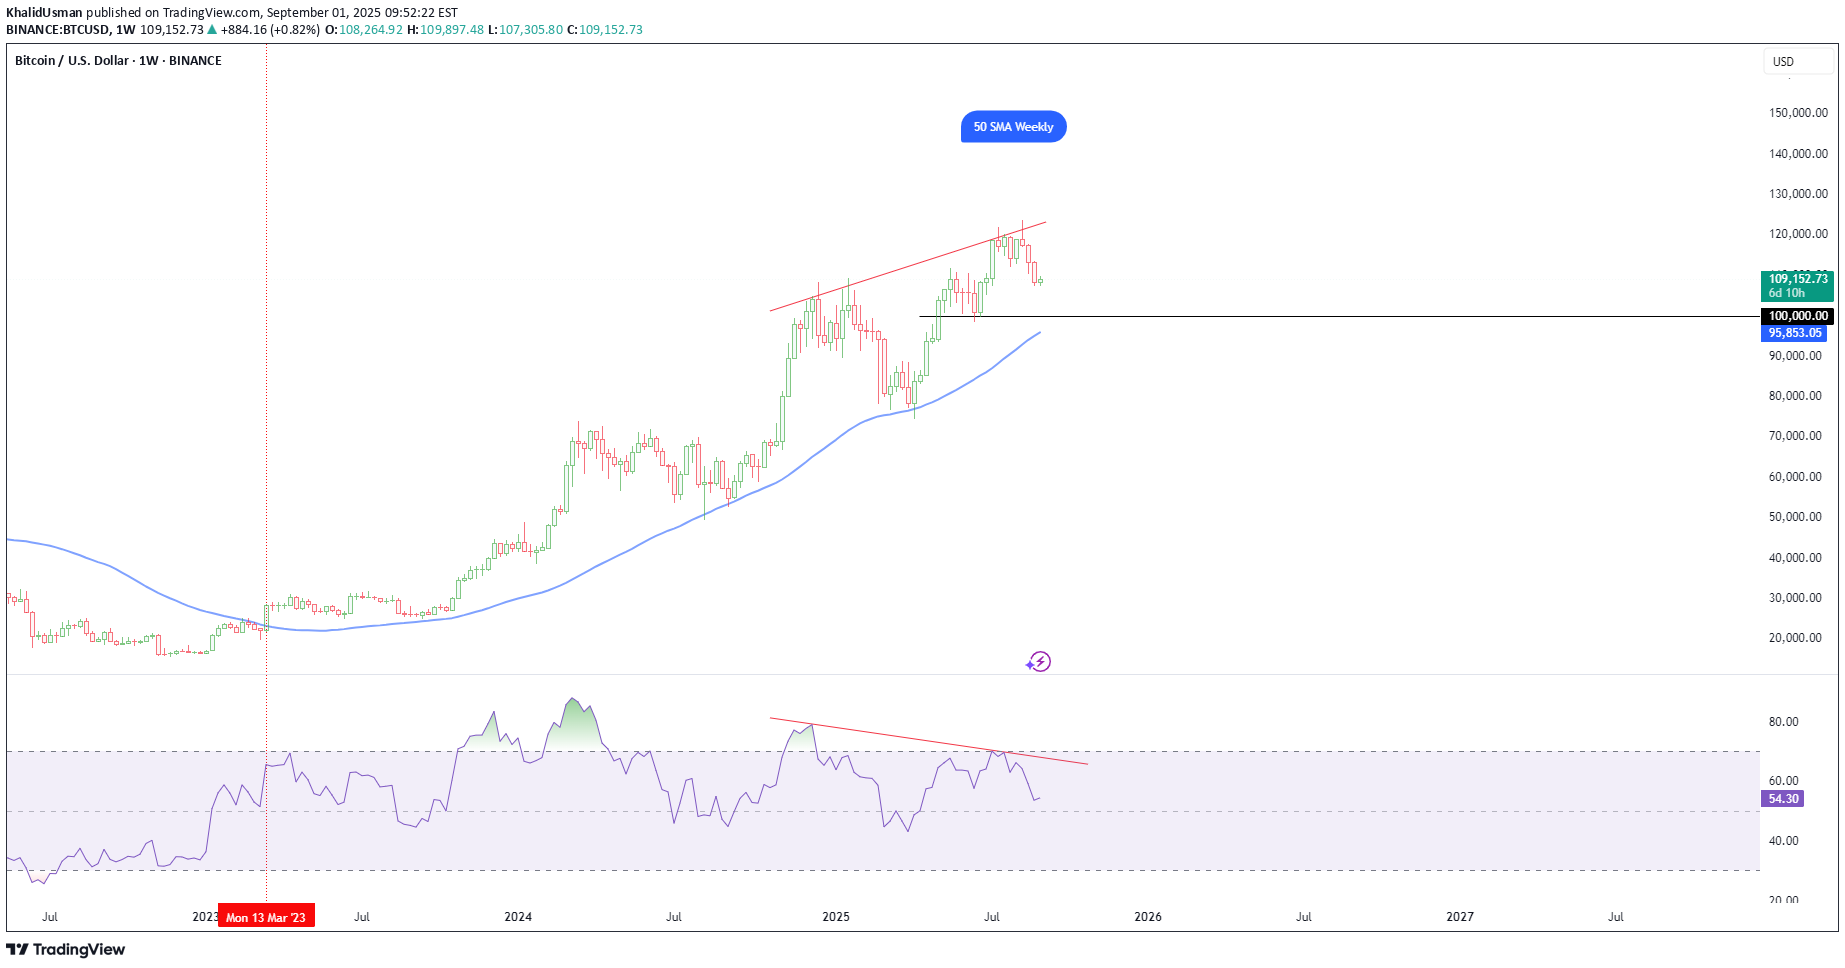
Since March 13, 2023, the BTCUSD has consistently traded above its weekly 50-period Simple Moving Average (SMA), demonstrating sustained bullish momentum. The price has tested the weekly 50 SMA on three occasions, each time finding support and maintaining its position above Moving Average. However, a significant bearish divergence is evident on the weekly chart, signalling potential weakening momentum despite the upward price trend. Given this divergence and historical price action, there is a high probability that BTCUSD may retest the $95,851–$100,000 support zone in the near term. Traders should monitor this critical area for potential price reaction.
KhalidUsman
BTC Possible buying opportunity
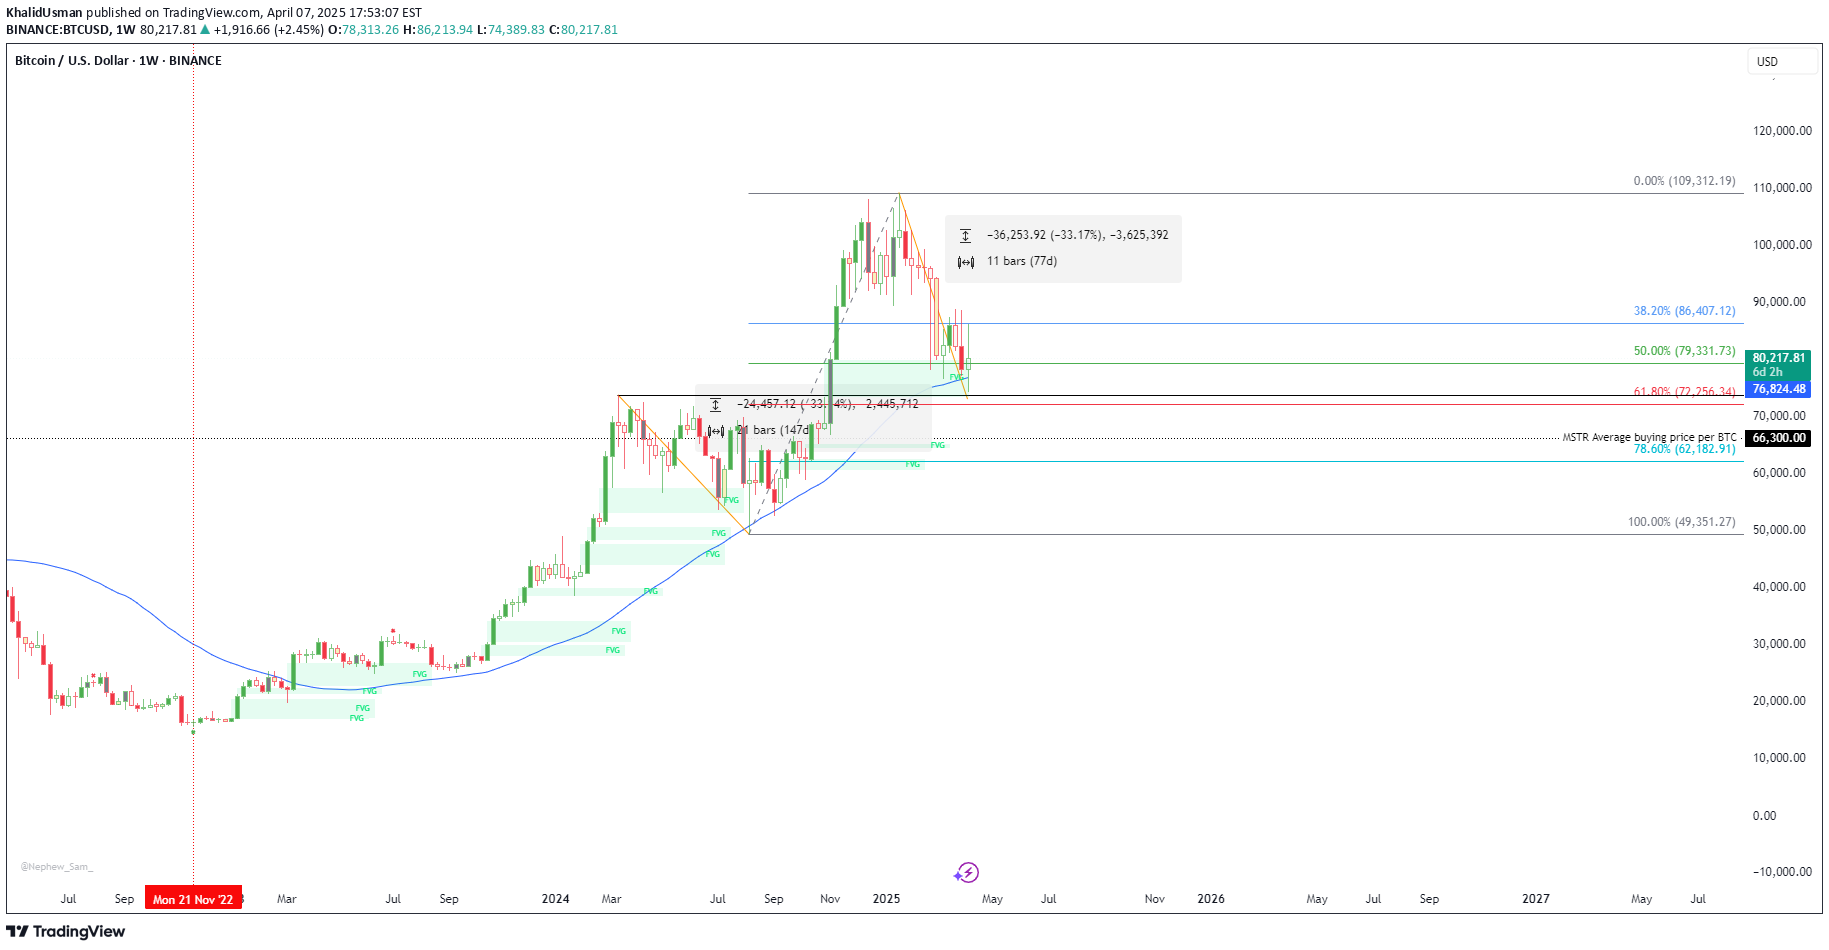
Possible buying opportunity if Weekly 50 SMA and Fib level 61.80% hold the price.
KhalidUsman
Link: Possible buying opportunity

KhalidUsman
NEAR: Technical Analysis | Bullish Momentum

NEARUSD | NEAR: After retracing at 78.60% Fib level it has closed above 61.80% Fib level. Pitchfork is also acting really well as a support and resistance levels. If NEAR closes above 50% Fib level and Daily Anchored VWAP ($6.034) it has high probability to reach $9 target.
KhalidUsman

KhalidUsman
ATOM: Bullish Momentum

ATOMUSD | Buy Entry executed on daily chart.Note: Green Yellow Candle. It is a Buy Signal triggered on daily candle close. Following candle is confirmation candle. As it broke the high of Green Yellow Candle entered long with stop loss. Focus on risk management. Don't let your winning position into loss.RC Momentum Indicator I use in-house built RC Momentum indicator to get buy or sell signals. It is proprietary indicator, it will be available to the public in future. RC Momentum Indicator is based on predictive modelling. It predicts the possible future move before it happens. Therefore, it is a leading indicator. Developed specifically for Cryptocurrencies day trading and swing trading, it leverages cutting-edge analytics to identify potential trends and reversals. It also demonstrates exceptional performance when applied to other trading instruments with high volume as well. RC momentum Indicator separates “market noise”, gives clean look of the chart and makes it very easy to understand.
Disclaimer
Any content and materials included in Sahmeto's website and official communication channels are a compilation of personal opinions and analyses and are not binding. They do not constitute any recommendation for buying, selling, entering or exiting the stock market and cryptocurrency market. Also, all news and analyses included in the website and channels are merely republished information from official and unofficial domestic and foreign sources, and it is obvious that users of the said content are responsible for following up and ensuring the authenticity and accuracy of the materials. Therefore, while disclaiming responsibility, it is declared that the responsibility for any decision-making, action, and potential profit and loss in the capital market and cryptocurrency market lies with the trader.