
Khaledzu
@t_Khaledzu

What symbols does the trader recommend buying?
Purchase History
پیام های تریدر
Filter
Khaledzu
SOL | Technical analysis (3D timeframe)

SOL | Technical analysis (3D timeframe) Hello Traders, There is no doubt that Solana is one of the most talked-about coins in the last two years. Solana already made +200% from its lower bottom but we are still on the downtrend we may consider the last rise as a correction in a bigger bearish wave. Solana is now testing the upper trendline which is a huge resistance. if we are able to get a weekly close above 25$, this will be a very bullish signal and we may open long positions, our targets will be 37 and 45. If Bulls fail to break this level(25$), that's the most likely will happen, we should see a retracement to 20$, 16$, and 12$. Also, I don't see any blocker to make a new lower low in the mid-term, so please use a very strict risk and capital management strategy and don't gamble with your money.Trade closed: target reached
Khaledzu
Bitcoin | chart update

Bitcoin | chart update Hello Everyone, in the last 24 hours, BTC showed a slight rebound that gave Alts and the whole market a bullish price action (only in the short term). In micro time frame the level of 25,800 as critical resistance (the red area), and 24,800 acting as short-term support. It is important to monitor the price action around this area closely. if Bitcoin closed daily or with 4h candle under 24720, this will be a confirmation for the current decline to continue. the next support in case of this bearish move is 23670 and 22900 In weekly chart BTC lost a major trendline, also the weekly candle closed under 200MA, and currently, the price is trading under it, that's not a good sign! in the weekly time frame, if the decline continues, the next rebounding areas will be: 23140 and 21k - as long as we are under 29k the bears will take control to decline the price more. stay safe, thank you
Khaledzu
Bitcoin | short term trade!

Bitcoin | short term trade! Bitcoin (BTC) has experienced a significant price drop of $1,000 in the past 24 hours, causing a market-wide downturn. The overall market cap has decreased by around 6.6%. The decline may be due to Fear, Uncertainty, and Doubt (FUD) in the market. There is a possibility of BTC dropping further to the range of $25,100 to $24,750, presenting a scalping opportunity. Traders should exercise caution, implement risk management strategies, and monitor the market closely. #BTC/USDT 🎯Targets: |> 26100 |> 26700 |> 27500 |> 28000 🔴Stop-loss: closing under 24350 with 1D candle ➡️Recommended risk: 0.25%
Khaledzu
BNB/USDT | Target Range of $150-$130
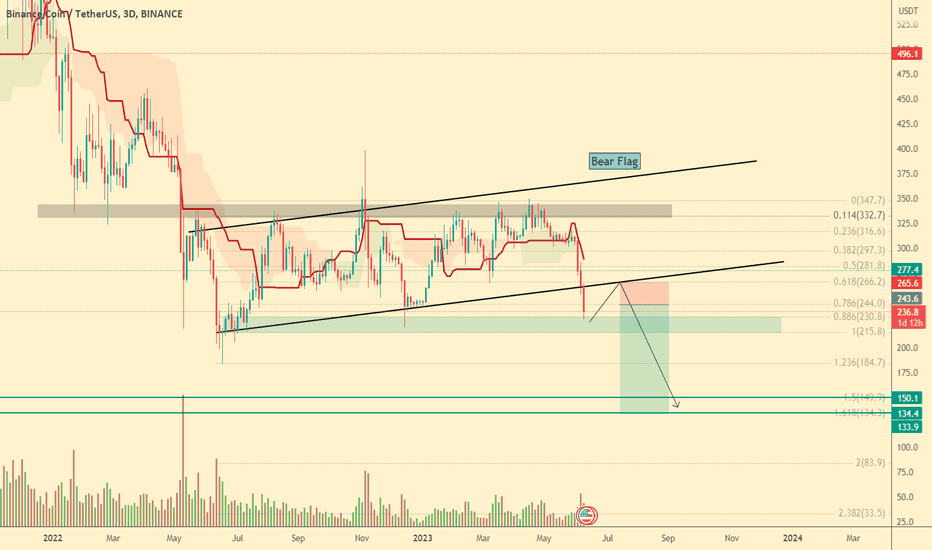
BNB/USDT | Target Range of $150-$130 The BNB/USDT pair has experienced a bearish breakdown, signaling a potential shorting opportunity. Traders are eyeing a target range of $150 to $130 as a possible profit zone. Technical indicators and the breach of a bear flag pattern support the bearish sentiment. However, it is important to remember that cryptocurrency markets are volatile, and risks should be managed carefully. Traders should conduct thorough research and use risk management tools when considering short positions. thank you :)
Khaledzu

Khaledzu

Khaledzu
Bitcoin | tracking movement

Bitcoin | tracking movement Bitcoin is hovering around a very critical support zone from 27500 to 27k. any daily or weekly close under 27k will lead to panic on all market. If Bitcoin can maintain its position above this support level and bounce back, there is a strong possibility of a 10% to 20 % rally . I'm still holding the main part of long positions but still have around 50% on fiat and If I see a break to 27k support level I may increase the fiat part to 70% I'm just sharing my plan with you guys and you are free to manage your capital and trading wallet the way you think it's best fit for you! stay safe, peace!
Khaledzu
EOS/USDT | huge falling wedge

EOS/USDT | huge falling wedge EOS/USDT | huge falling wedge 🟢 Entry price: from now at 1.036 to 1.03 EOS/USDT | huge falling wedge 🟢 Entry price: from now at 1.036 to 1.03 🟢 If you are looking for more safe entry point, you can buy the breakout above 1.065 EOS/USDT | huge falling wedge 🟢 Entry price: from now at 1.036 to 1.03 🟢 If you are looking for more safe entry point, you can buy the breakout above 1.065 EOS/USDT | huge falling wedge 🟢 Entry price: from now at 1.036 to 1.03 🟢 If you are looking for more safe entry point, you can buy the breakout above 1.065 🎯Targets: EOS/USDT | huge falling wedge 🟢 Entry price: from now at 1.036 to 1.03 🟢 If you are looking for more safe entry point, you can buy the breakout above 1.065 🎯Targets: |> 1.196 EOS/USDT | huge falling wedge 🟢 Entry price: from now at 1.036 to 1.03 🟢 If you are looking for more safe entry point, you can buy the breakout above 1.065 🎯Targets: |> 1.196 |> 1.326 EOS/USDT | huge falling wedge 🟢 Entry price: from now at 1.036 to 1.03 🟢 If you are looking for more safe entry point, you can buy the breakout above 1.065 🎯Targets: |> 1.196 |> 1.326 |> 1.469 EOS/USDT | huge falling wedge 🟢 Entry price: from now at 1.036 to 1.03 🟢 If you are looking for more safe entry point, you can buy the breakout above 1.065 🎯Targets: |> 1.196 |> 1.326 |> 1.469 |> 1.607 EOS/USDT | huge falling wedge 🟢 Entry price: from now at 1.036 to 1.03 🟢 If you are looking for more safe entry point, you can buy the breakout above 1.065 🎯Targets: |> 1.196 |> 1.326 |> 1.469 |> 1.607 EOS/USDT | huge falling wedge 🟢 Entry price: from now at 1.036 to 1.03 🟢 If you are looking for more safe entry point, you can buy the breakout above 1.065 🎯Targets: |> 1.196 |> 1.326 |> 1.469 |> 1.607 🔴Stop-loss: Daily candle closes under 0.942 EOS/USDT | huge falling wedge 🟢 Entry price: from now at 1.036 to 1.03 🟢 If you are looking for more safe entry point, you can buy the breakout above 1.065 🎯Targets: |> 1.196 |> 1.326 |> 1.469 |> 1.607 🔴Stop-loss: Daily candle closes under 0.942 EOS/USDT | huge falling wedge 🟢 Entry price: from now at 1.036 to 1.03 🟢 If you are looking for more safe entry point, you can buy the breakout above 1.065 🎯Targets: |> 1.196 |> 1.326 |> 1.469 |> 1.607 🔴Stop-loss: Daily candle closes under 0.942 ➡️Recommended risk: 0.25% EOS/USDT | huge falling wedge 🟢 Entry price: from now at 1.036 to 1.03 🟢 If you are looking for more safe entry point, you can buy the breakout above 1.065 🎯Targets: |> 1.196 |> 1.326 |> 1.469 |> 1.607 🔴Stop-loss: Daily candle closes under 0.942 ➡️Recommended risk: 0.25% ➡️Recommended total Positions Size: 1.5%
Khaledzu
Bitcoin | 32k ?

Bitcoin | 32k ? Bitcoin | 32k ? - Bitcoin is struggling to break 30k resistance, the more time under this resistance makes it more tuff for bulls to be able to break it. Bitcoin | 32k ? - Bitcoin is struggling to break 30k resistance, the more time under this resistance makes it more tuff for bulls to be able to break it. Bitcoin | 32k ? - Bitcoin is struggling to break 30k resistance, the more time under this resistance makes it more tuff for bulls to be able to break it. - Bitcoin is making a sideways movement since one week ago but BTC is forming a triangle and almost went to the end and must decide whether to break above or down the triangle trend line. Bitcoin | 32k ? - Bitcoin is struggling to break 30k resistance, the more time under this resistance makes it more tuff for bulls to be able to break it. - Bitcoin is making a sideways movement since one week ago but BTC is forming a triangle and almost went to the end and must decide whether to break above or down the triangle trend line. Bitcoin | 32k ? - Bitcoin is struggling to break 30k resistance, the more time under this resistance makes it more tuff for bulls to be able to break it. - Bitcoin is making a sideways movement since one week ago but BTC is forming a triangle and almost went to the end and must decide whether to break above or down the triangle trend line. - most probably the triangle will be a continuation pattern and BTC will break above and test the 32k resistance zone. Bitcoin | 32k ? - Bitcoin is struggling to break 30k resistance, the more time under this resistance makes it more tuff for bulls to be able to break it. - Bitcoin is making a sideways movement since one week ago but BTC is forming a triangle and almost went to the end and must decide whether to break above or down the triangle trend line. - most probably the triangle will be a continuation pattern and BTC will break above and test the 32k resistance zone. Bitcoin | 32k ? - Bitcoin is struggling to break 30k resistance, the more time under this resistance makes it more tuff for bulls to be able to break it. - Bitcoin is making a sideways movement since one week ago but BTC is forming a triangle and almost went to the end and must decide whether to break above or down the triangle trend line. - most probably the triangle will be a continuation pattern and BTC will break above and test the 32k resistance zone. - I expect an increase in Bitcoin dominance that will definitely affect Altcoins badly if there is no equivalent increase in the total market cap.
Khaledzu
NEAR | Just broke 200MA after one year!

#NEAR/USDT - NEAR broke 200MA after for the first time since May 2022 and that is a very positive signal. - Also we have a higher low and a higher high for the first time since some weeks. - we are forming Wave C of ABC Elliot correction wave. - Wave C is typically at least as large as wave A and often extends to 1.618 times wave A or beyond. 🟢Entry price: from now at 2.313 to 2.116 🎯Targets: |> 2.66 |> 3.224 |> 3.75 🔴Stop-loss: Daily candle closes under 1.95 ➡️Recommended risk: 0.25% ➡️Recommended total Positions Size: 3.1%
Disclaimer
Any content and materials included in Sahmeto's website and official communication channels are a compilation of personal opinions and analyses and are not binding. They do not constitute any recommendation for buying, selling, entering or exiting the stock market and cryptocurrency market. Also, all news and analyses included in the website and channels are merely republished information from official and unofficial domestic and foreign sources, and it is obvious that users of the said content are responsible for following up and ensuring the authenticity and accuracy of the materials. Therefore, while disclaiming responsibility, it is declared that the responsibility for any decision-making, action, and potential profit and loss in the capital market and cryptocurrency market lies with the trader.