
Katri01
@t_Katri01

What symbols does the trader recommend buying?
Purchase History
پیام های تریدر
Filter
Signal Type
Katri01
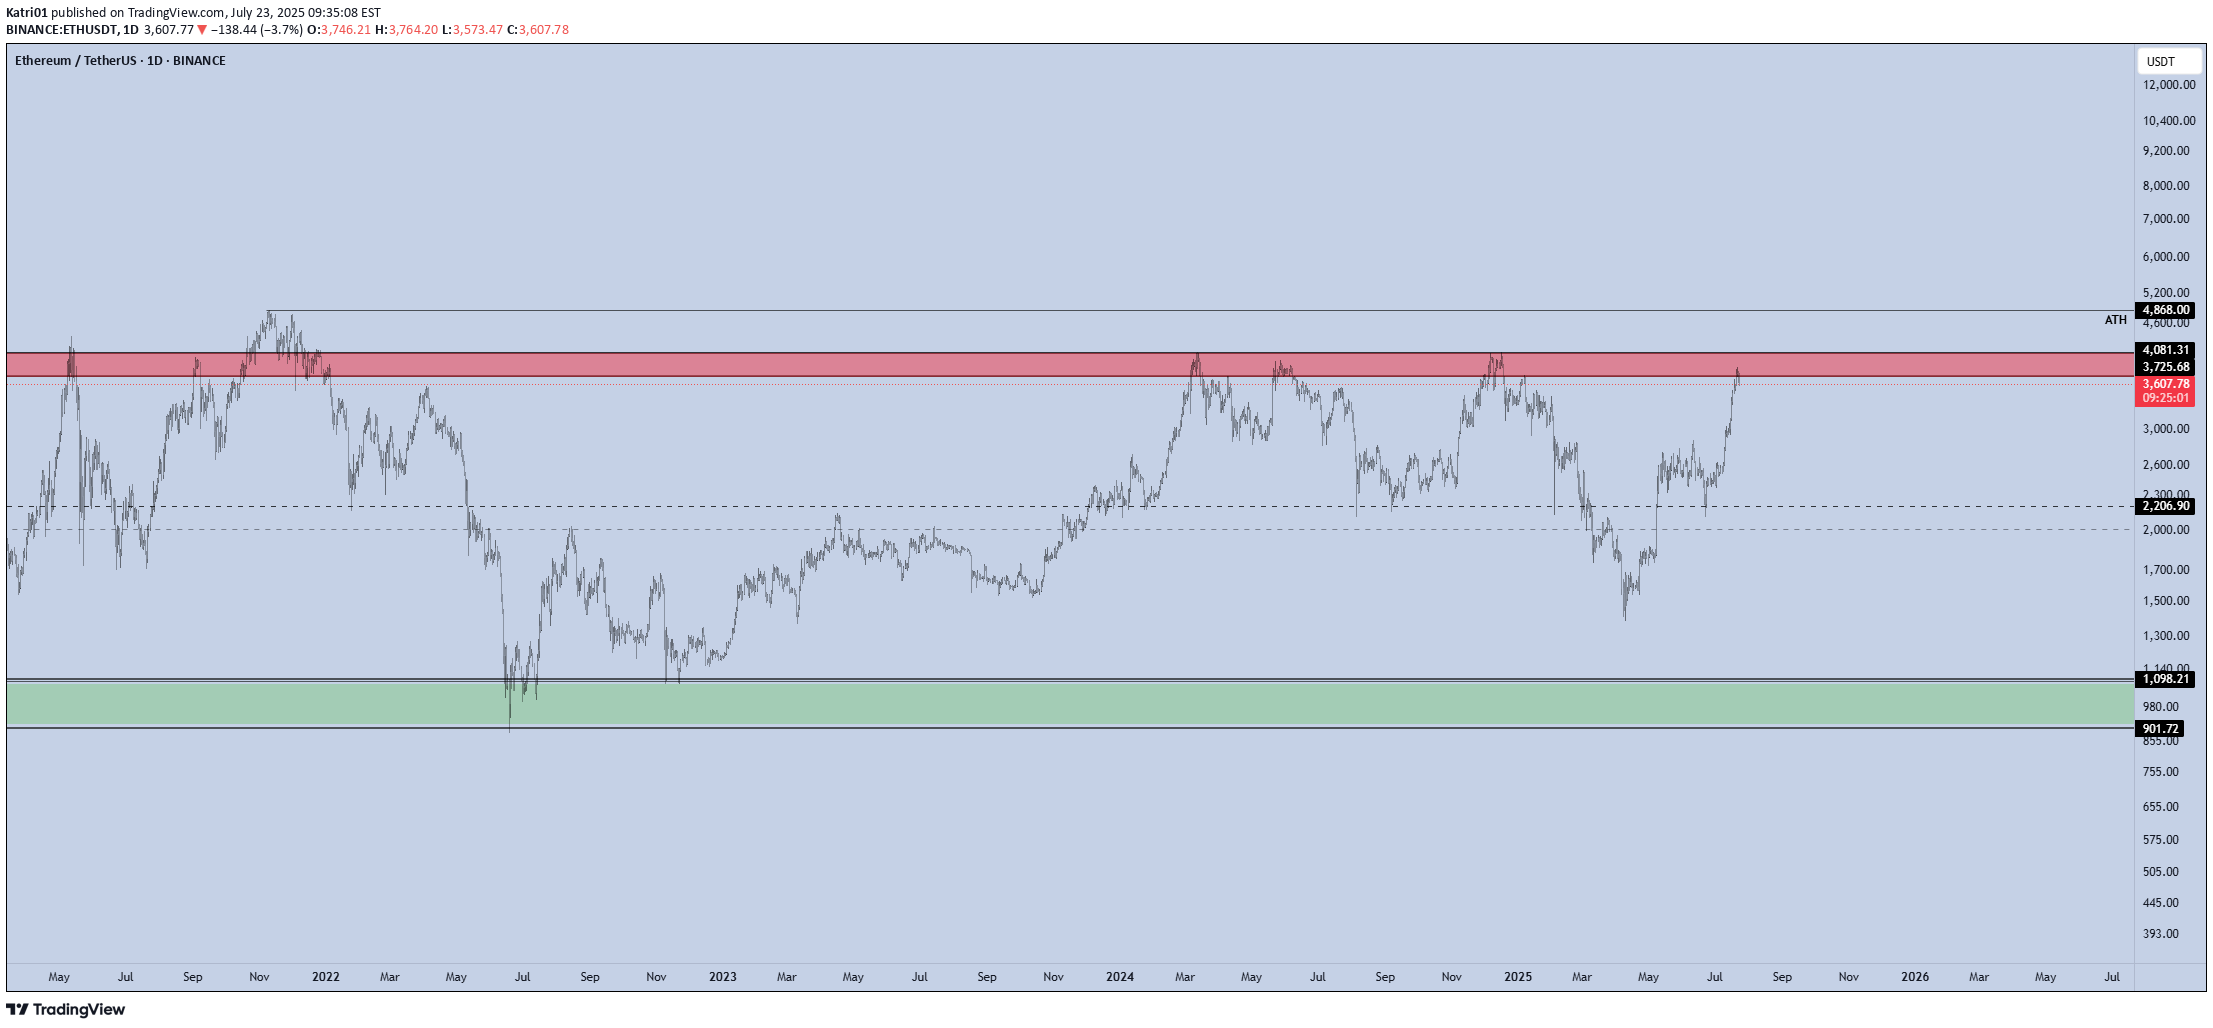
ETH has rallied sharply and is now entering the major resistance zone between $3,725 and $4,081, which has repeatedly acted as a local top during previous cycles. This red zone represents a high-supply area, and historically ETH has struggled to break and hold above it without a significant catalyst. Rejection here could lead to a pullback toward the $2,300–$2,000 range. A clean breakout and weekly close above $4,081 would flip this resistance into support and open the path toward the all-time high (ATH) at $4,868. If ETH reclaims this red zone and flips it to support, it will act as a major trigger for a broad Altseason. Historically, such ETH strength is a key confirmation that capital is rotating from BTC into the altcoin market. Currently, momentum is favoring bulls unless this red supply zone causes a strong rejection.
Katri01
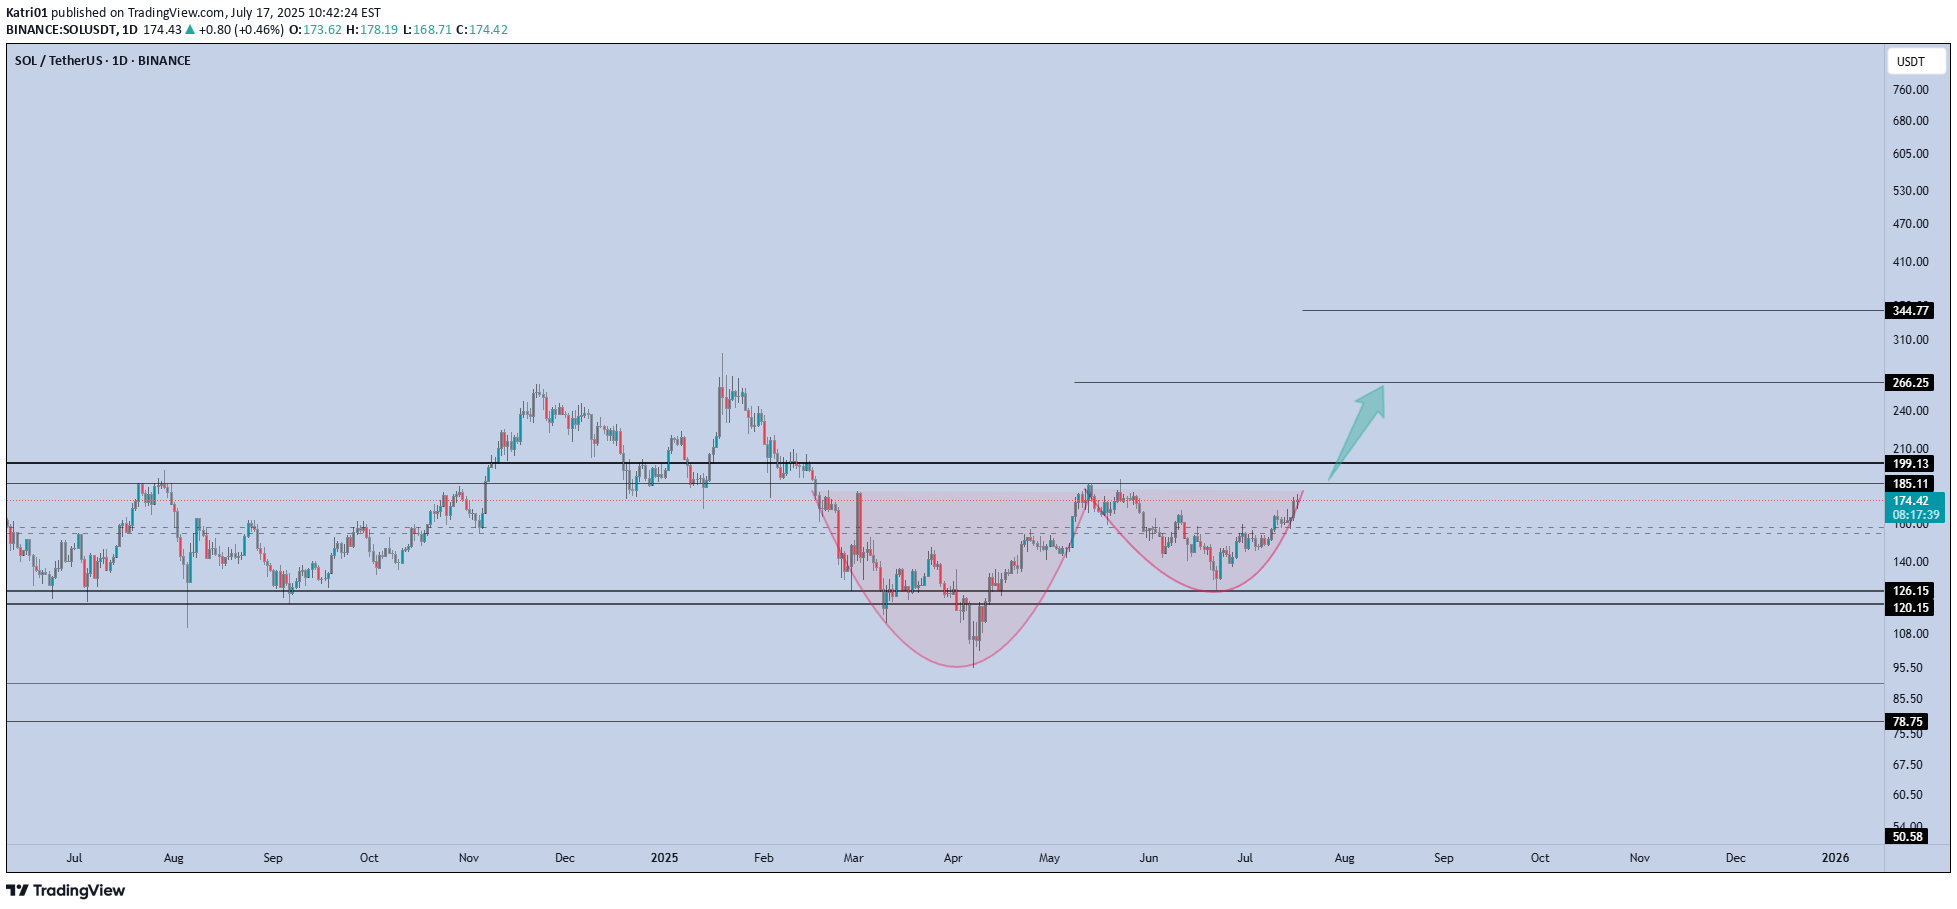
Solana is printing a textbook cup & handle formation on the daily, and price is now pressing against the neckline resistance near $185, just below the psychological $200 zone. This structure reflects months of accumulation and rising momentum. A confirmed breakout above the $185–$199 resistance would likely trigger the next upward leg. This setup signals trend reversal continuation, and if SOL closes above $199 on high volume, momentum traders may pile in quickly. 📌 Invalidation below $150 = pattern risk-off.
Katri01
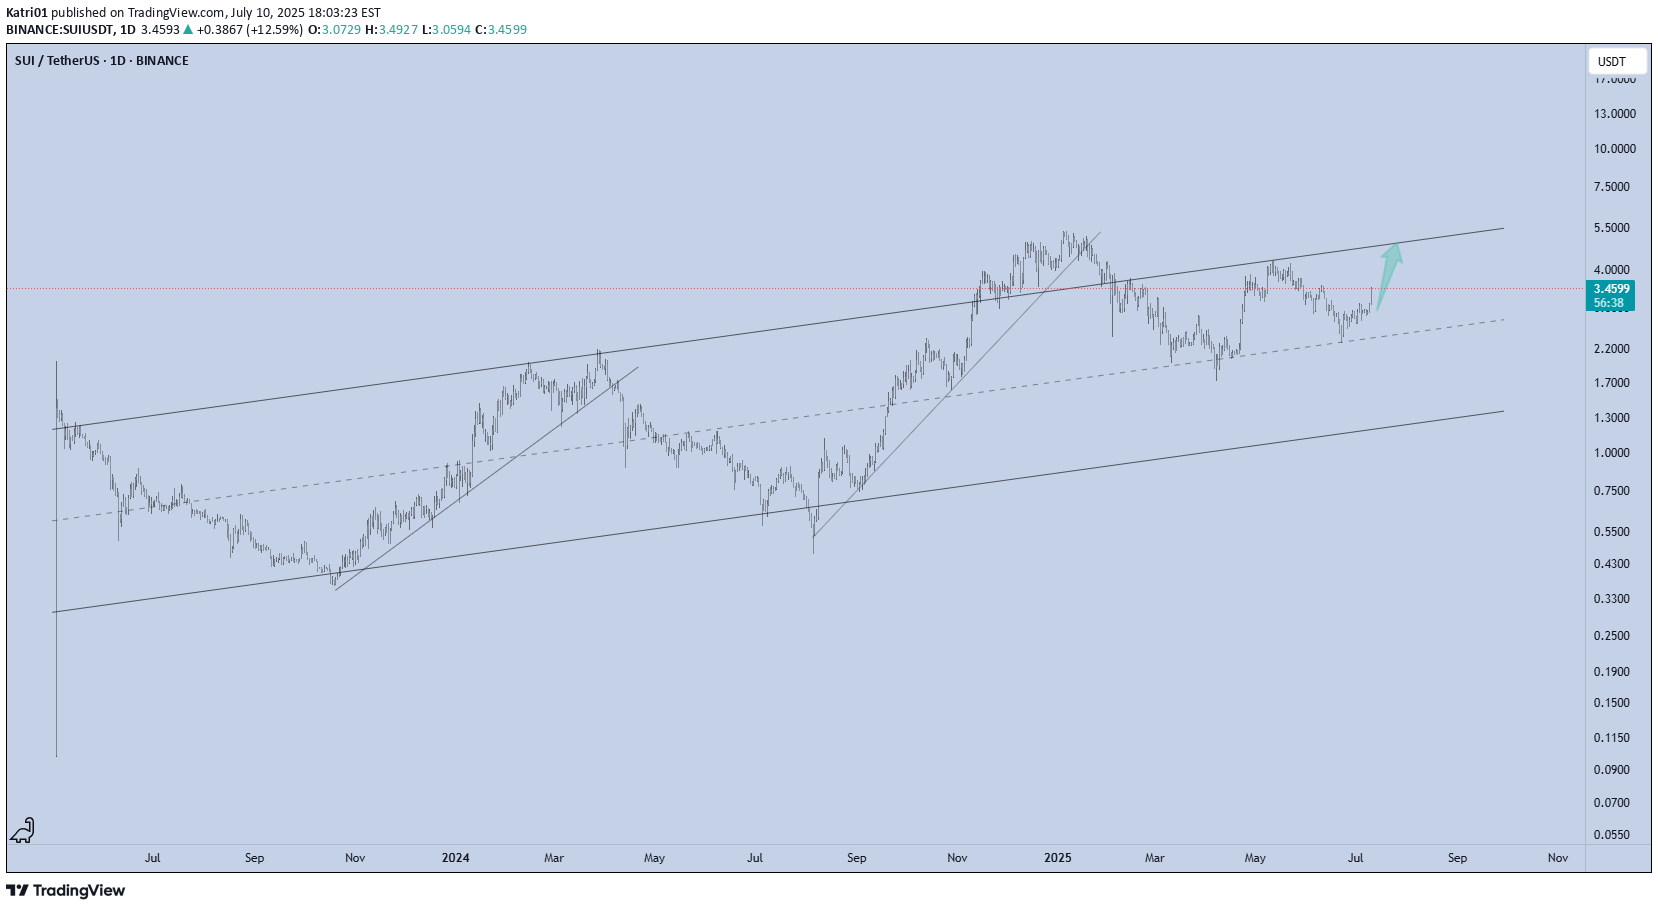
SUI just printed a powerful +12.95% daily move, bouncing cleanly from the mid-range of its long-term ascending channel. This structure has been respected since mid-2023, guiding both impulse legs and corrective phases with precision.Now trading around $3.47, the next logical magnet is the channel top near $5, especially if momentum persists and market sentiment remains risk-on.Technical Structure:Bullish trend within a well-defined ascending channelClean reaction from dynamic support (midline)Clear higher low + breakout structure in playUpside Target:$5 (channel resistance)As long as SUI holds above the rising midline (~$2.80 area), this setup remains valid for trend continuation toward the upper range.📌 Risk Management:Break below the midline flips the bias short-term. Until then, trend = friend.
Katri01
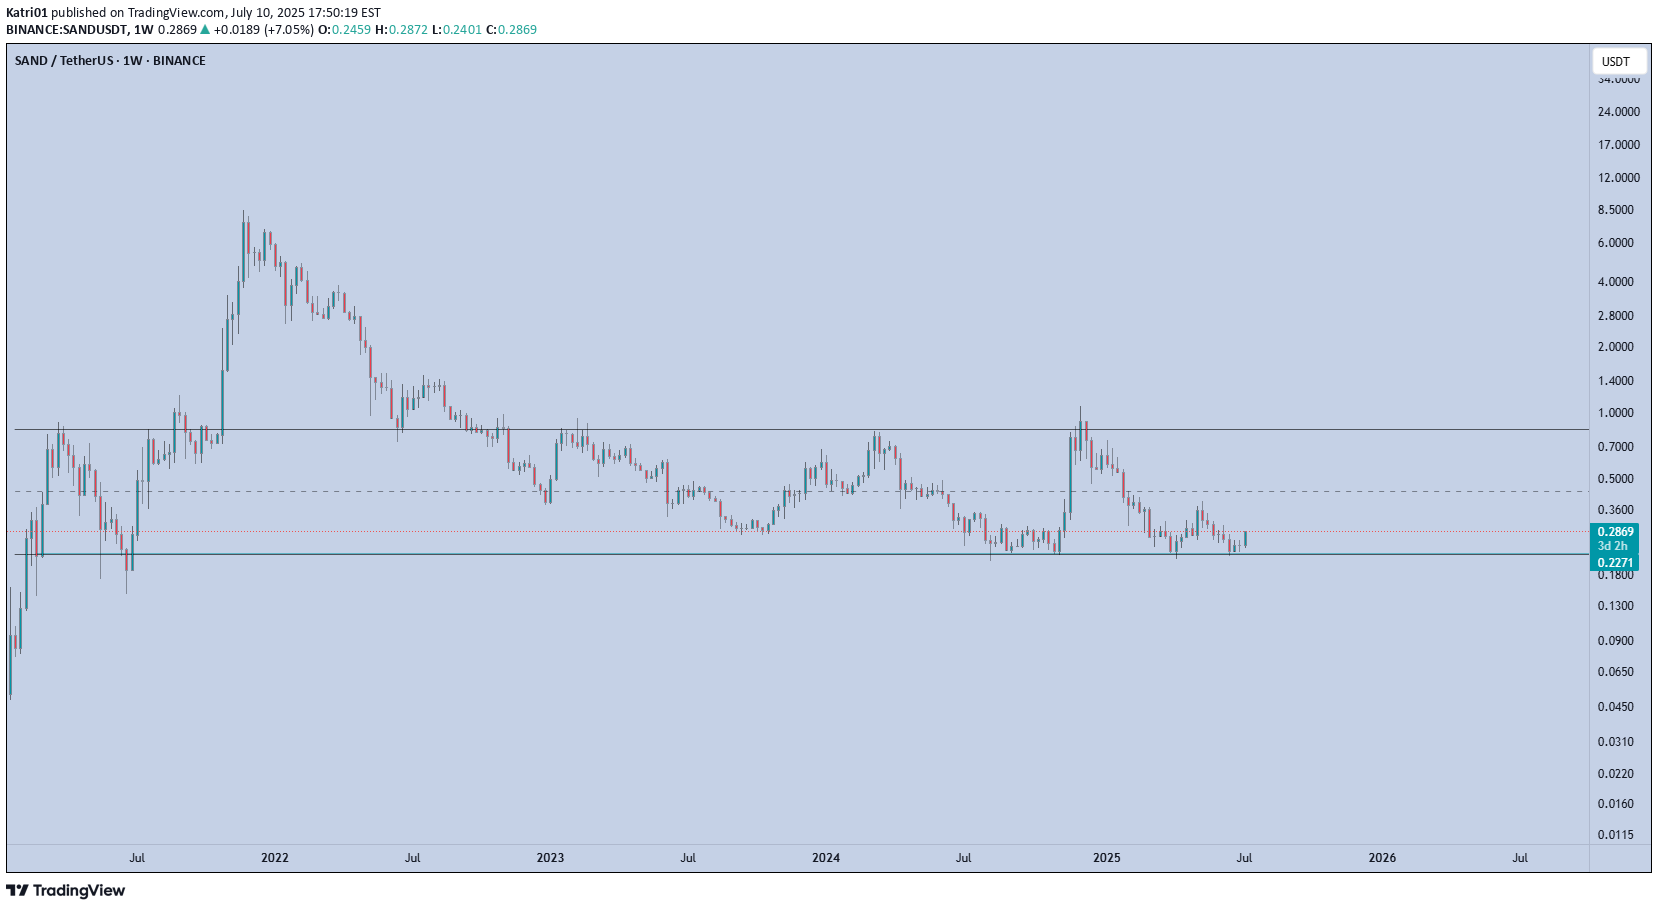
SAND is showing early signs of strength off the long-term demand zone near $0.23–0.24, where it's been accumulating for several months. Price just printed a strong weekly bounce, up +16%, reclaiming the bottom of the range.This area has acted as a key base since mid-2023 — with each touch producing a notable reaction. Now trading at $0.286, SAND is attempting to rotate toward the top of the established range.Key LevelsSupport (Range Low): $0.23–0.24 (strong demand zone)Resistance (Mid-Range): $0.43Range High: $0.85A clean flip of the mid-range ($0.43) could open the door to test $0.70+.📌 Risk management: A break and weekly close below $0.23 invalidates this setup. As long as it holds, the upside potential is attractive from a risk/reward standpoint.This is a classic accumulation > reclaim > expansion structure. Let the chart speak if the range holds, the rotation is in play.
Katri01
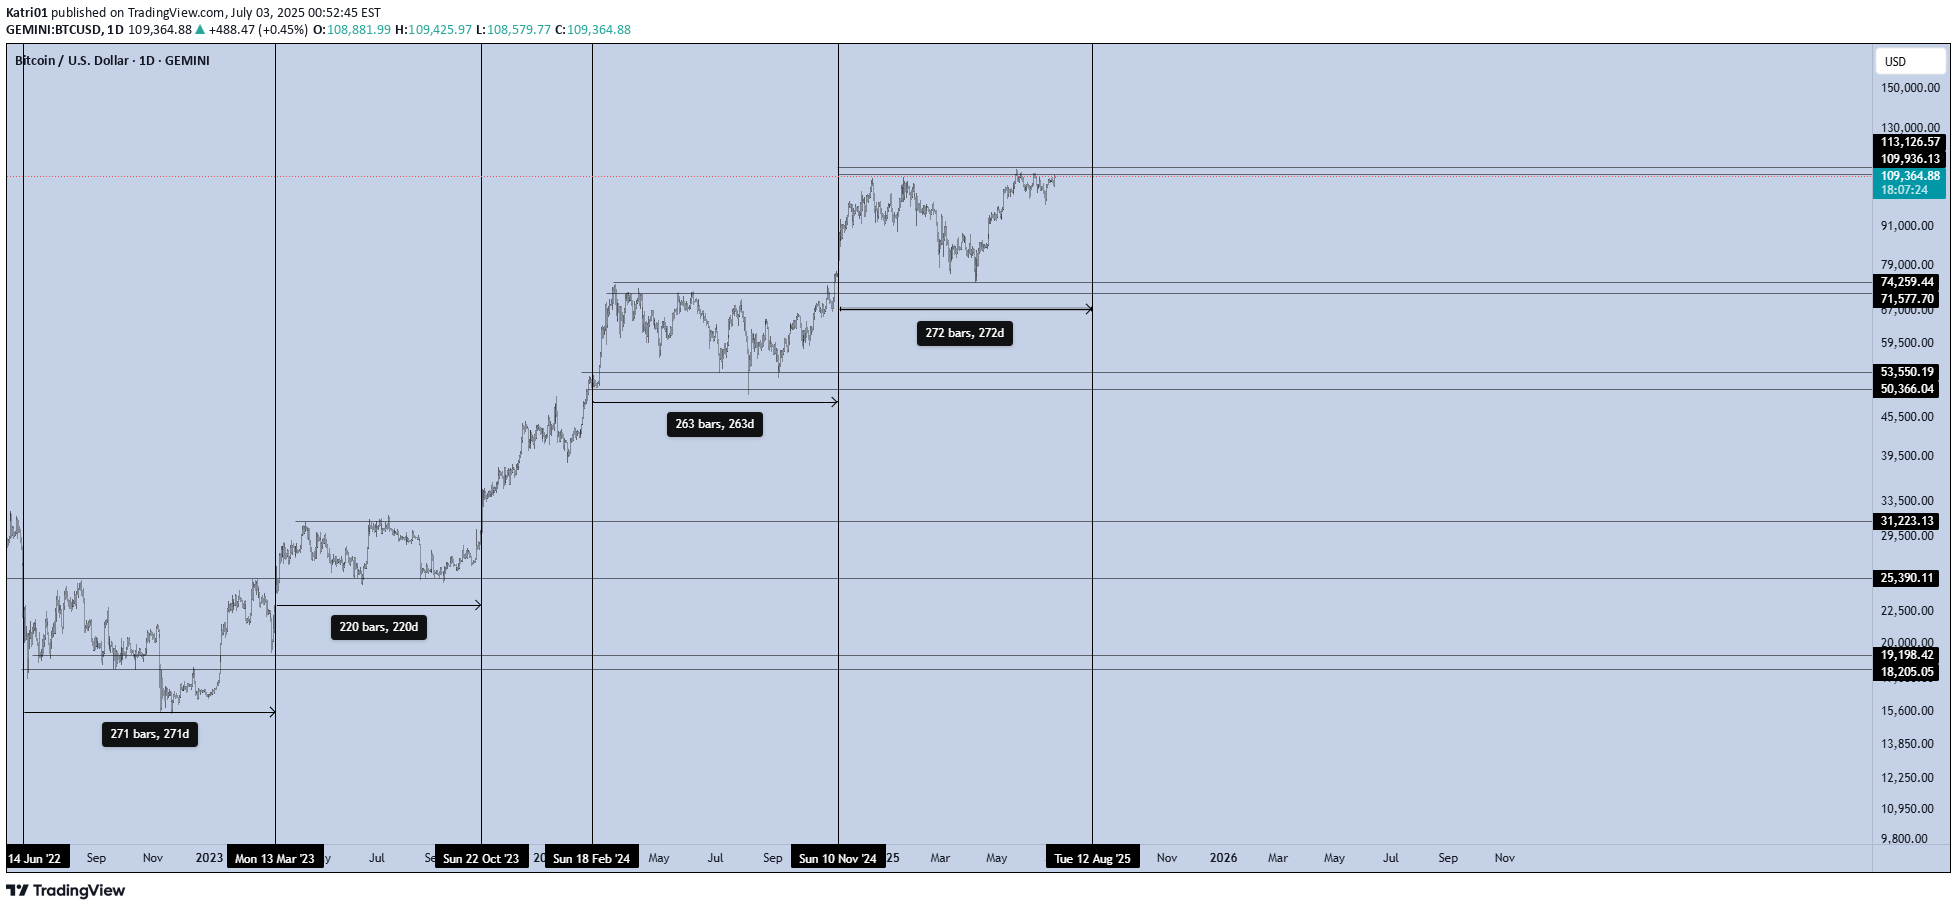
Bitcoin isn’t just trading. It’s pulsing — in cycles that reward those who understand timing as much as price.Over the last two years, BTC has shown a repeating pattern with surgical precision:Range Phase:Each macro consolidation lasts ~220 to 270 days, where price builds structure, absorbs supply, and prepares for its next expansion. This is the quiet phase — the zone where conviction is tested, and weak hands exit.Impulse Phase:What follows is a ~100-day vertical leg, where BTC surges between +50% to +80%, targeting the next macro resistance. We’ve seen this repeatedly:Accumulate → Expand → Re-accumulate → Expand.
Katri01

It seems like APTOS has reached a price bottom, and if Bitcoin doesn't fall any further, we'll bounce back from this range. The medium-term price target is $9.
Katri01

Since 2021, every mini alt season cycle has reached the red zone, forming a top. It appears that the red zone marks the top for mini-alt seasons, while the green zone serves as the floor.In the main alt season, I anticipate the red zone breaking to the upside.
Katri01

Since the last Altseason (2021), Celer has consistently signaled tops and bottoms for altcoins. The red zone has marked altcoin peaks, while the green zone has indicated market bottoms.
Disclaimer
Any content and materials included in Sahmeto's website and official communication channels are a compilation of personal opinions and analyses and are not binding. They do not constitute any recommendation for buying, selling, entering or exiting the stock market and cryptocurrency market. Also, all news and analyses included in the website and channels are merely republished information from official and unofficial domestic and foreign sources, and it is obvious that users of the said content are responsible for following up and ensuring the authenticity and accuracy of the materials. Therefore, while disclaiming responsibility, it is declared that the responsibility for any decision-making, action, and potential profit and loss in the capital market and cryptocurrency market lies with the trader.