
Kartik_Elkunchwar
@t_Kartik_Elkunchwar

What symbols does the trader recommend buying?
Purchase History
پیام های تریدر
Filter
Kartik_Elkunchwar
Bitcoin Breaks Key Resistance – Upside Targets in Focus...
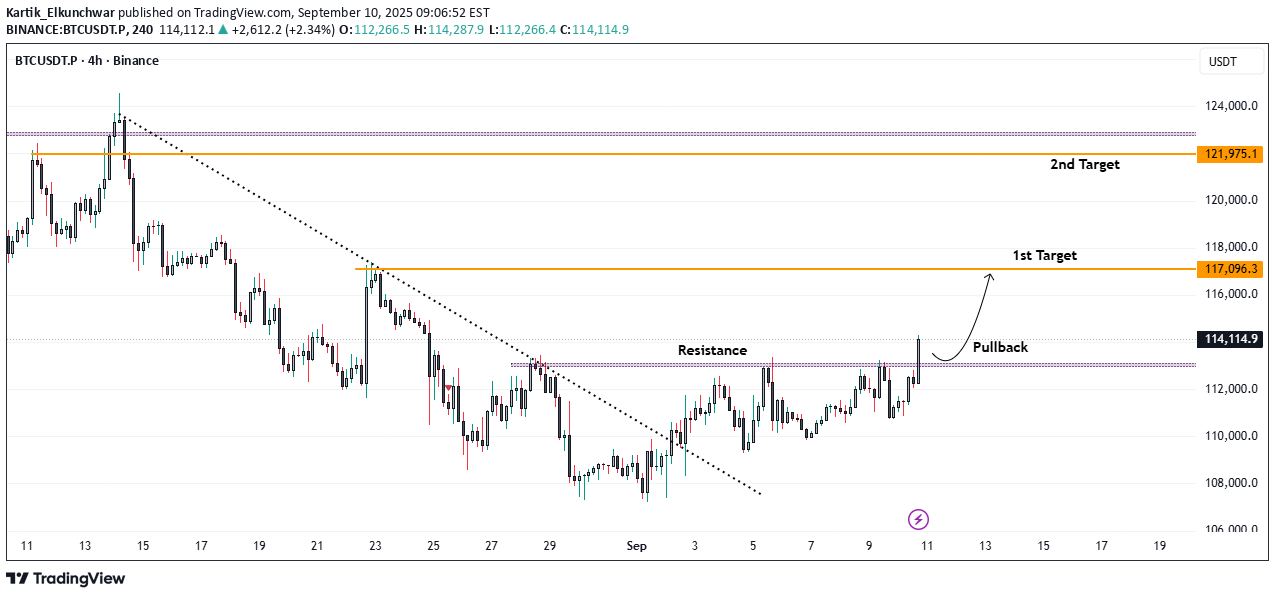
Bitcoin has been consolidating below the $113,000 resistance level over the past few sessions. On the hourly timeframe, price has now successfully broken above this barrier and is sustaining the breakout. 📈 Trading Outlook: * A pullback towards $113,000 could offer a favorable long entry opportunity. * Upside Targets: * First target: $117,000 * Second target: $122,000 The breakout and successful close above resistance suggest strong bullish momentum, provided price holds above the $113,000 zone.
Kartik_Elkunchwar
Bitcoin Breakout Watch: Key Levels Ahead...
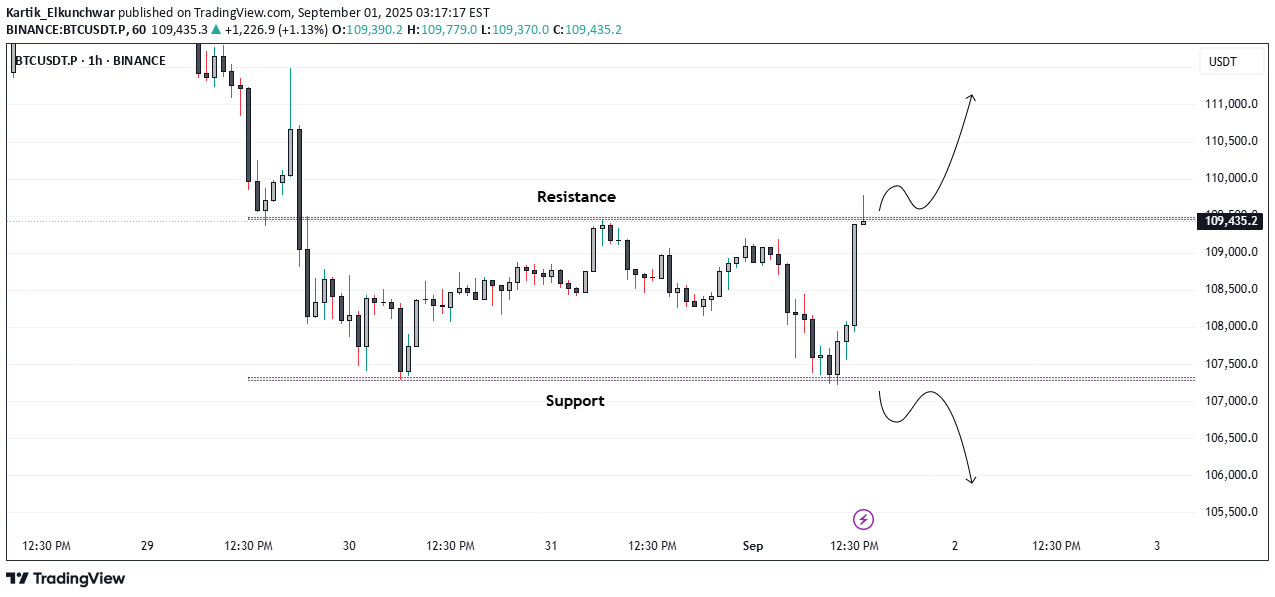
Bitcoin is consolidating in a tight range on the 1-hour timeframe and is showing strong momentum as it tests the $109,500 resistance zone. A decisive breakout and sustained close above this level could trigger a move toward the $112,000 mark, signaling bullish momentum building in the market. Keep a close watch on volume confirmation for a stronger breakout signal. 📈
Kartik_Elkunchwar
Descending Triangle Showdown: XRP Bulls vs Bears at $2.80..!
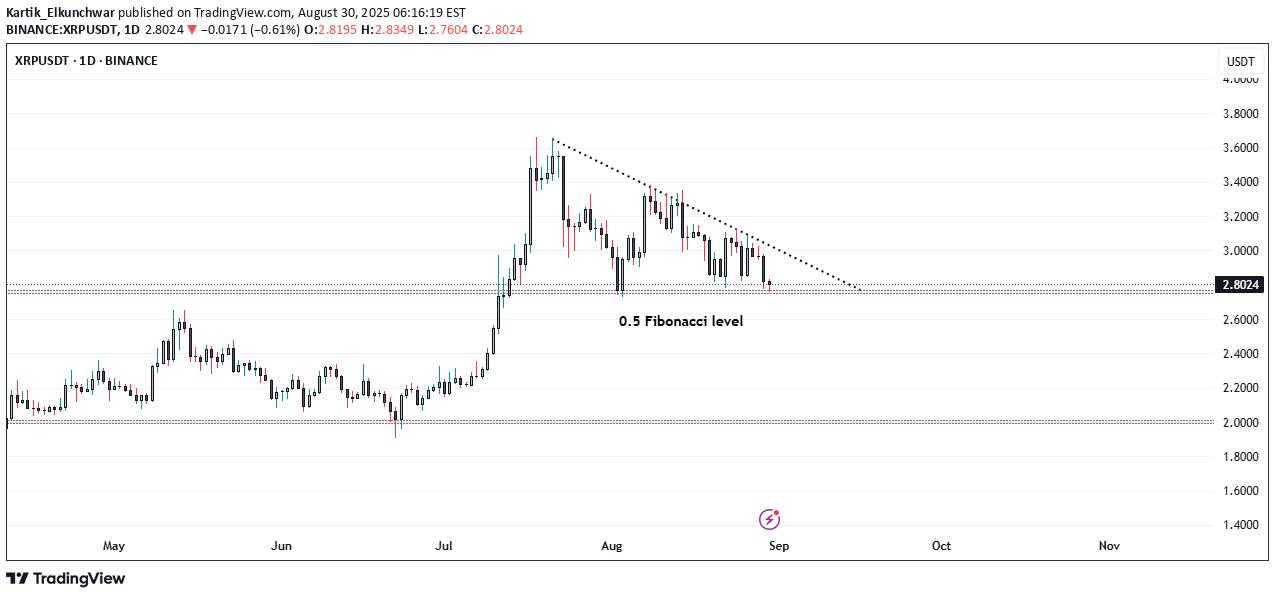
XRP is currently hovering around the $2.80 level, sitting precisely at the 0.5 Fibonacci retracement zone, which has been acting as a strong support level in recent sessions. 📉 Technical Structure: * Price action has formed a descending triangle pattern, indicating a period of consolidation following the sharp rally in July. * The 0.5 Fibonacci level ($2.80) is a critical zone to watch; a strong bounce here could signal renewed bullish momentum. * A break below $2.80 could open the doors for a retest of the 0.618 Fibonacci level ($2.60) or even deeper support near $2.00. * On the upside, a breakout above the descending trendline would be the first sign of strength, potentially driving XRP back towards $3.40–$3.80 resistance levels. ⚠️ Key Takeaway: XRP is at a make-or-break level. Bulls must defend $2.80 to keep the broader uptrend intact, while bears are eyeing a decisive breakdown to extend the correction phase. Traders should stay alert for a confirmed breakout or breakdown from this tight consolidation range. 💡 Strategy Watch: * Aggressive traders may look for long entries near $2.80 support with tight stops. * Conservative traders can wait for confirmation: a break above the trendline for bullish momentum or a clean break below $2.80 for bearish continuation.
Kartik_Elkunchwar
Bitcoin on Edge: Bearish Momentum Building Below $111,800
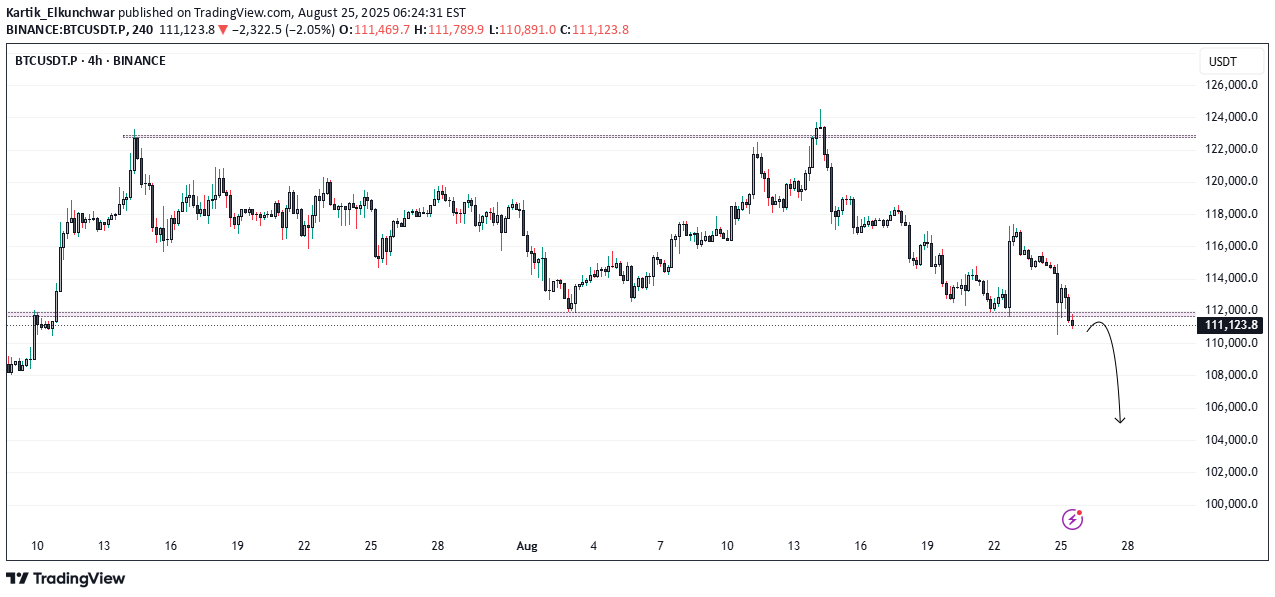
🚨 Bitcoin Alert: Key Support Cracks! 🚨 Bitcoin has slipped below the crucial $111,800 support on the 4H chart, even as rate cut cues try to lift sentiment. 📉 If BTC closes another 4H candle under $111,800, this breakdown could gain momentum, eyeing the $105,000–$107,000 zone as the next major support area. ⚠️ Watch price action closely — failure to reclaim this level may accelerate the bearish move.
Kartik_Elkunchwar
ETH at $4,100 – Can Bulls Defend Key Support Before FOMC..?
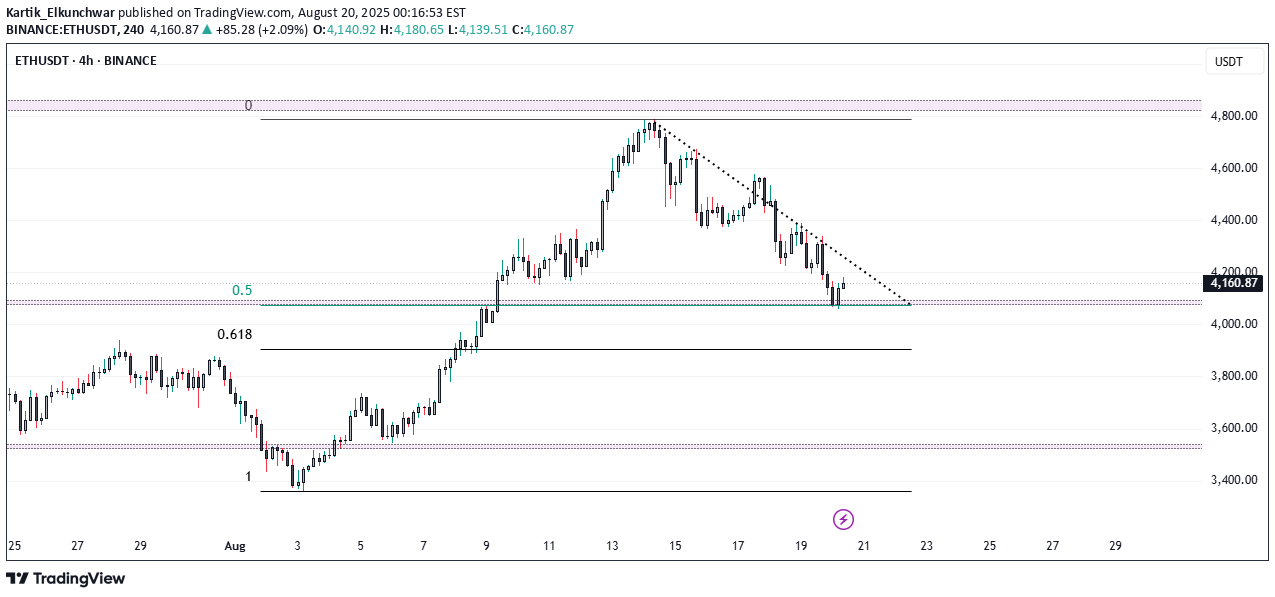
ETH + FOMC = Volatility Ahead ? 🔥 Ethereum at Make-or-Break Zone: $4,100 Support in Focus! Ethereum (ETH/USDT) on the 4H timeframe is showing a decisive battle between bulls and bears. After topping near $4,700, ETH has been in a steady downtrend, respecting the descending trendline. 🔑 Key Levels to Watch * Immediate Support: $4,100 – $4,150 (0.5 Fib retracement) * Major Support: $3,950 – $4,000 (0.618 Fib retracement) * Resistance Zone: $4,300 – $4,350 (descending trendline) * Major Resistance: $4,600 – $4,700 (recent swing high) 📈 Bullish Scenario ✅ A breakout above $4,300 trendline resistance could trigger strong momentum toward $4,500 - $4,600. ✅ Holding $4,100 support will keep buyers in control. 📉 Bearish Scenario ❌ If ETH fails to hold $4,100, expect a deeper retracement toward $4,000 (0.618 Fib). ❌ A break below $3,950 may extend the fall to $3,700 – $3,600. ⚠️ Market Note 📌 Today’s FOMC meeting could heavily impact the crypto market trend. Expect volatility as Fed commentary on interest rates may guide ETH’s next major move. ⚖️ Conclusion ETH is at a critical support zone where the next move will define short-term direction. * Above $4,300 → Bulls regain control. * Below $4,100 → Bears target $4,000 and lower.
Kartik_Elkunchwar
Trend Resumes: Ethereum Breaks Consolidation, Eyes $4050
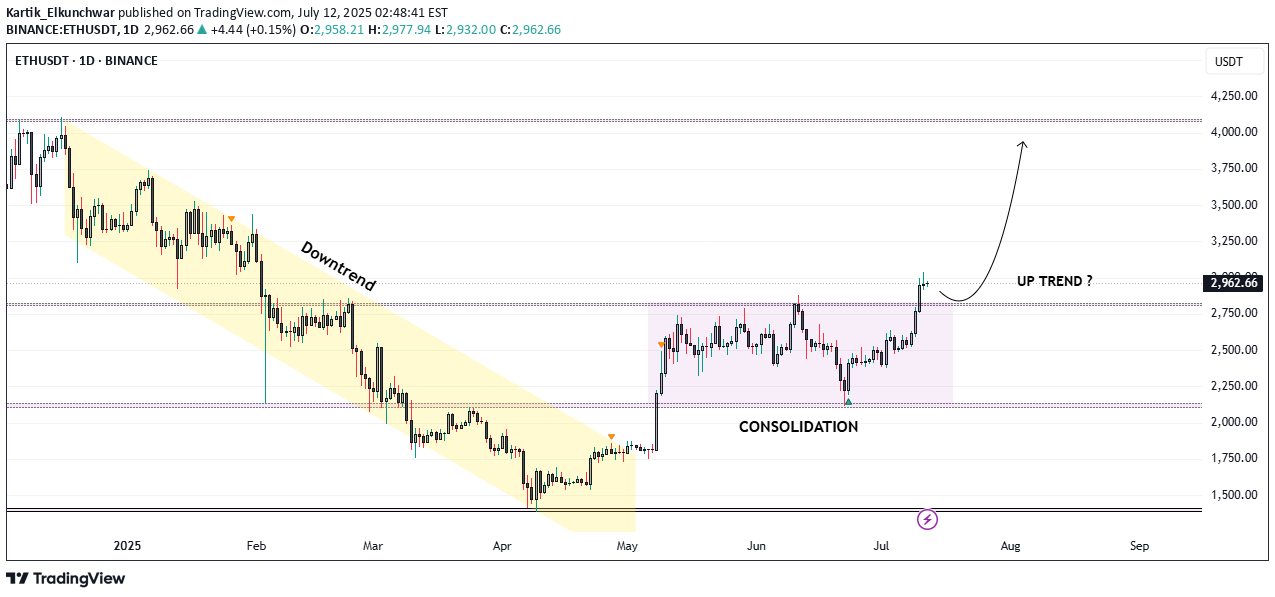
Market Structure Overview: Markets typically move in two major phases: 🔹 Trend Phase (directional movement) 🔹 Consolidation Phase (sideways movement or accumulation/distribution) These phases repeat as: Trend → Consolidation → Trend → Consolidation Ethereum Price Action Breakdown (Daily Timeframe): Mid-December to End-April: Clear downtrend phase. May to Early July: Entered a consolidation zone, forming a tight range. Current Status (July): 🔹 Ethereum has broken out of the consolidation range. 🔹 Currently trading around $3000, confirming strength. 🔹 This breakout may potentially signal the start of Altcoin Season. Trade Setup – Long Position Idea: Entry (Buy Zone): Around $2850 (retest of breakout resistance). Target: 🔹 Primary Target: $4050 🔹 This aligns with a major resistance and Fibonacci extension zone. Stop Loss: $2600 (below key structure support). Technical Confluences: * Breakout above multi-week range. * Retest of resistance turned support at \$2850. * Psychological round level near \$3000 acting as a magnet. * Volume confirmation on breakout (optional to mention if on chart). Risk Note: ⚠️ Caution: The Market may turn volatile due to unexpected geopolitical or macroeconomic news. Always follow risk management and avoid overleveraging. Conclusion: Ethereum’s breakout from a multi-month consolidation phase indicates a potential shift in momentum. If retest levels hold, this could be the beginning of a strong upside rally, possibly leading to a broader Altcoin Season. Traders can position themselves accordingly with a well-defined risk-reward setup.
Kartik_Elkunchwar
Bitcoin's Breakout Fizzles: Is a Major Reversal in Play...?
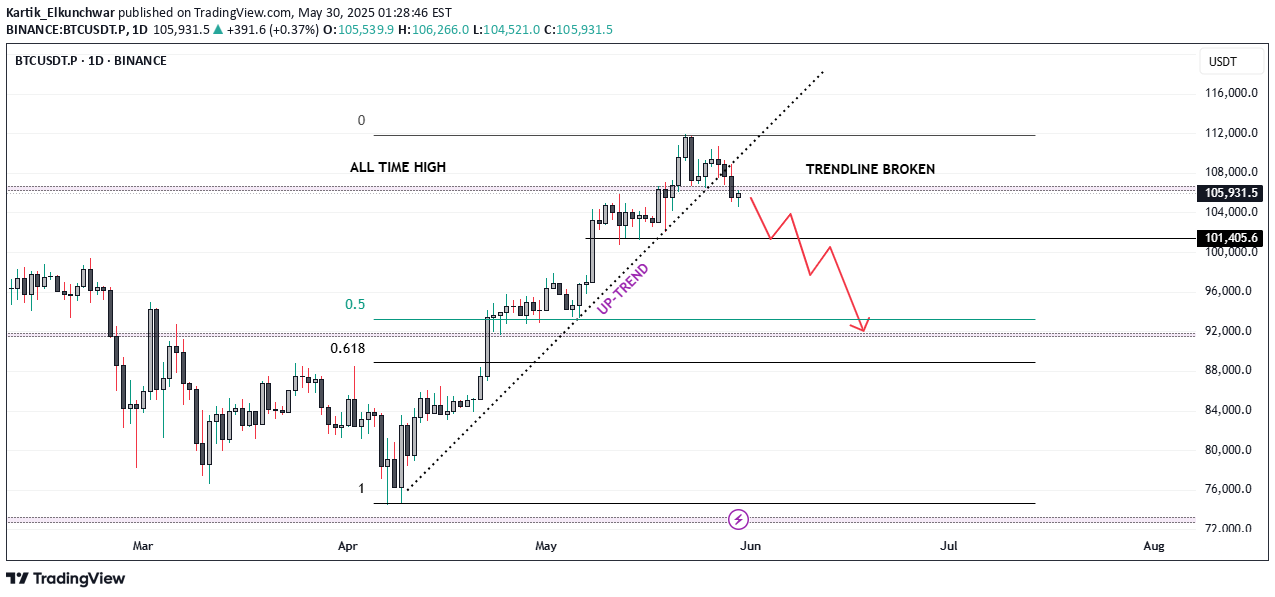
Bitcoin Technical Analysis – In-Depth BreakdownOver the past two months, Bitcoin has exhibited a strong bullish trend, appreciating by approximately 51%. The sustained rally was primarily driven by bullish momentum, increased investor confidence, and broader market sentiment.Recently, Bitcoin broke through its all-time high (ATH) of 106,500, surging to a new peak near 112,000. However, this breakout was short-lived as the price failed to sustain above this level, indicating significant profit-taking activity by traders and long-term holders. This inability to hold the ATH region highlights a potential liquidity pocket where sell orders accumulate, resulting in a rejection wick and a subsequent reversal.From a Technical perspective: The price has now fallen back below 106,500, turning this key level into a major resistance zone. Historically, once a strong resistance level (like an ATH) is breached and subsequently reclaimed, it often acts as a formidable barrier to upward price movement unless there’s renewed bullish momentum. Additionally, Bitcoin has broken its ascending trendline (drawn from the lows of the uptrend) and has already retested this trendline from below. The retest was successful in confirming the breakdown, which further strengthens the bearish bias. The price structure is now forming a potential lower high pattern near the 106,500 resistance. This could signal a shift in market sentiment from bullish continuation to consolidation or correction.In terms of market psychology, the all-time high region represents a crucial psychological barrier. Traders and investors often exhibit heightened caution near such levels. Many choose to lock in profits due to fear of a double top or a false breakout. This behavior can create increased volatility, especially when combined with institutional and retail order flows. Trading Strategy and Risk ManagementGiven the technical breakdown and the psychological factors at play:✅ A short position can be considered, particularly around the 106,500 resistance, with confirmation from the trendline retest.✅ However, exercise caution due to the high volatility typically observed near ATH levels. Whipsaws and fakeouts are common as both bulls and bears battle for control.✅ Avoid high-leverage positions unless you have a strict stop-loss in place. Ideally, place the stop-loss just above the 106,500 - 107,000 zone, where a decisive breakout would invalidate the short setup.✅ For profit targets, initial supports are seen around 100,000 - 98,000, and a deeper correction could test the 94,000 - 92,000 zone.✅ Wait for clear confirmation, such as a strong bearish candle on the retest of the resistance, before entering the trade.
Kartik_Elkunchwar
After a 37% Surge, Is Ethereum Still a Buy...?

Ethereum Breaks Key Resistance, Signaling Potential Trend ReversalEthereum has delivered two significant technical signals indicating a potential trend reversal. The first is a breakout above the longstanding downtrend line, and the second is the breach of the critical \$2,100 resistance level. These developments suggest growing bullish momentum in the market.With both confirmation signals in place, Ethereum appears poised for further upside. Traders may now look for a potential pullback or retest around the \$2,100 level, which could serve as a strategic entry point for long positions.If this level holds as new support, the next target to watch is the \$2,800 mark, aligning with broader market expectations and previous price structure zones.As always, traders should monitor price action closely and manage risk accordingly in case of volatility around key levels.
Kartik_Elkunchwar

Kartik_Elkunchwar
Ethereum Up 30% — But Is This the Start of a Trend Reversal..?

Ethereum Up 30% — But Is This the Start of a Trend Reversal..?Ethereum has seen a notable bounce this month, climbing approximately 30% from its local bottom of $1,400 to its current level around $1,800. While this rally might appear promising at first glance, a deeper look at the daily timeframe reveals a more cautious picture.Despite the recent price surge, Ethereum remains technically in a **downtrend**. A well-respected downtrend continues to hold as resistance, and ETH is currently **retesting this trendline**. This point of contact now sets the stage for two potential scenarios: **Scenario 1: Rejection from the Trendline**If Ethereum fails to break above the trendline, it’s likely to face **rejection**, which could send the price back toward the $1,400 level. A revisit to this support zone would form a **potential double bottom**, a classic reversal pattern. If that plays out, we could then start to look for signs of a genuine trend reversal. **Scenario 2: Breakout Above the Trendline**On the other hand, if ETH manages to **break through the trendline**, that alone shouldn't be a green light to go long just yet. There’s a significant resistance level sitting around **$2,100**, which has previously acted as a ceiling for price action. A true breakout would require Ethereum not only to cross this level but also to **sustain above it for 2–3 days**. Only then could a long position be considered relatively safer, with upside targets extending to **$2,800** and even **$4,000**. **Final Thoughts**While the recent rally is encouraging, it's essential to remain cautious. The downtrend isn't officially over until key technical levels are cleared and held. Until Ethereum breaks above both the downtrend and the $2,100 resistance zone — and proves its strength with sustained movement — the **best strategy may be to sit on the sidelines** and let the market play out.Patience often pays in crypto — and right now, **watching closely** could be the smartest move.
Disclaimer
Any content and materials included in Sahmeto's website and official communication channels are a compilation of personal opinions and analyses and are not binding. They do not constitute any recommendation for buying, selling, entering or exiting the stock market and cryptocurrency market. Also, all news and analyses included in the website and channels are merely republished information from official and unofficial domestic and foreign sources, and it is obvious that users of the said content are responsible for following up and ensuring the authenticity and accuracy of the materials. Therefore, while disclaiming responsibility, it is declared that the responsibility for any decision-making, action, and potential profit and loss in the capital market and cryptocurrency market lies with the trader.