
Jorgebatista8twcp
@t_Jorgebatista8twcp

What symbols does the trader recommend buying?
Purchase History
پیام های تریدر
Filter
Signal Type
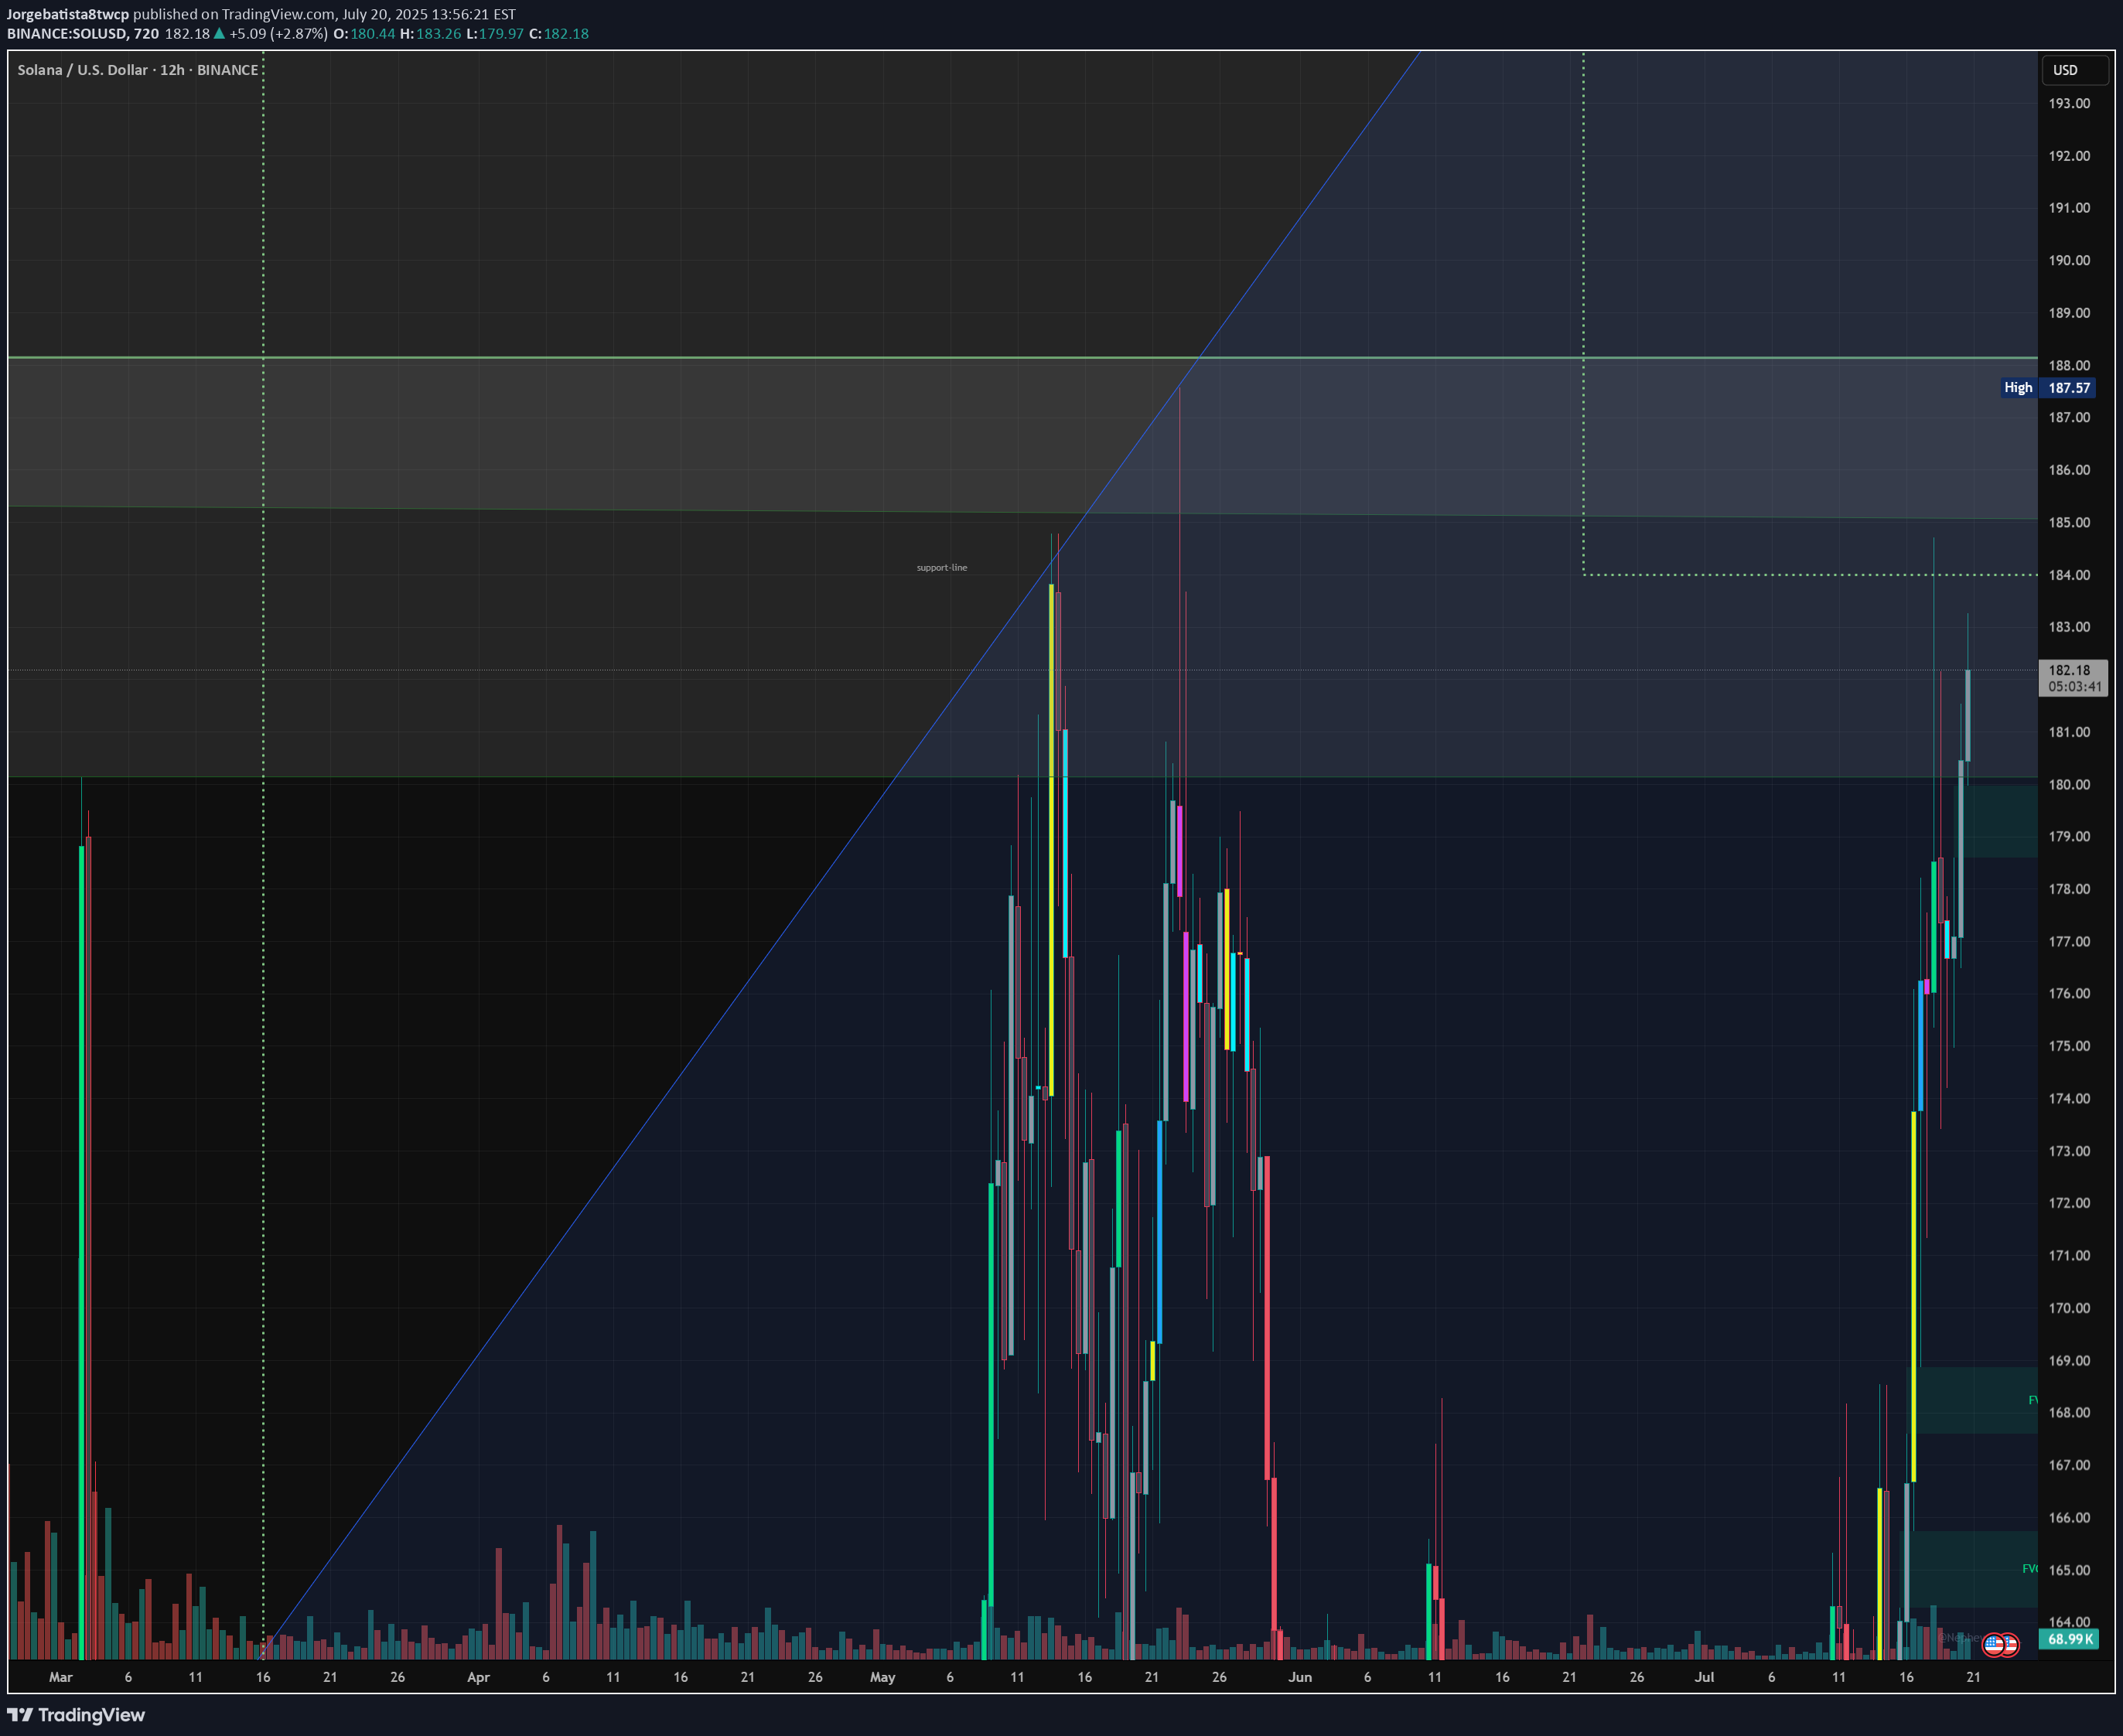
Hello everyone, here is my current outlook on Solana (SOL): Personally, I am currently only watching Solana as we may already be in a correction phase. Nevertheless, there is an interesting scenario where we could still be in a green wave 5, which could potentially reach prices above USD 300. Possible course: In April 2025, the bottom may have been found following an ABC formation. Wave 1 (yellow) could be completed in May 2025. Wave 2 (yellow) could end in June 2025. We could currently be in wave 3 (yellow). Important point to watch: If the price does not make it sustainably above the yellow wave 1 (approx. USD 190), the probability increases strongly that we are still in a B wave. This would mean that we are still in a major correction, which could theoretically take us back to around USD 60. In this scenario, wave 1 would have already ended in January 2025 and we would still be in the correction of wave 2. https://www.tradingview.com/x/NlUANyXb/ Conclusion: The indicators are particularly important in this phase. Keep a close eye on them to better understand the structure.
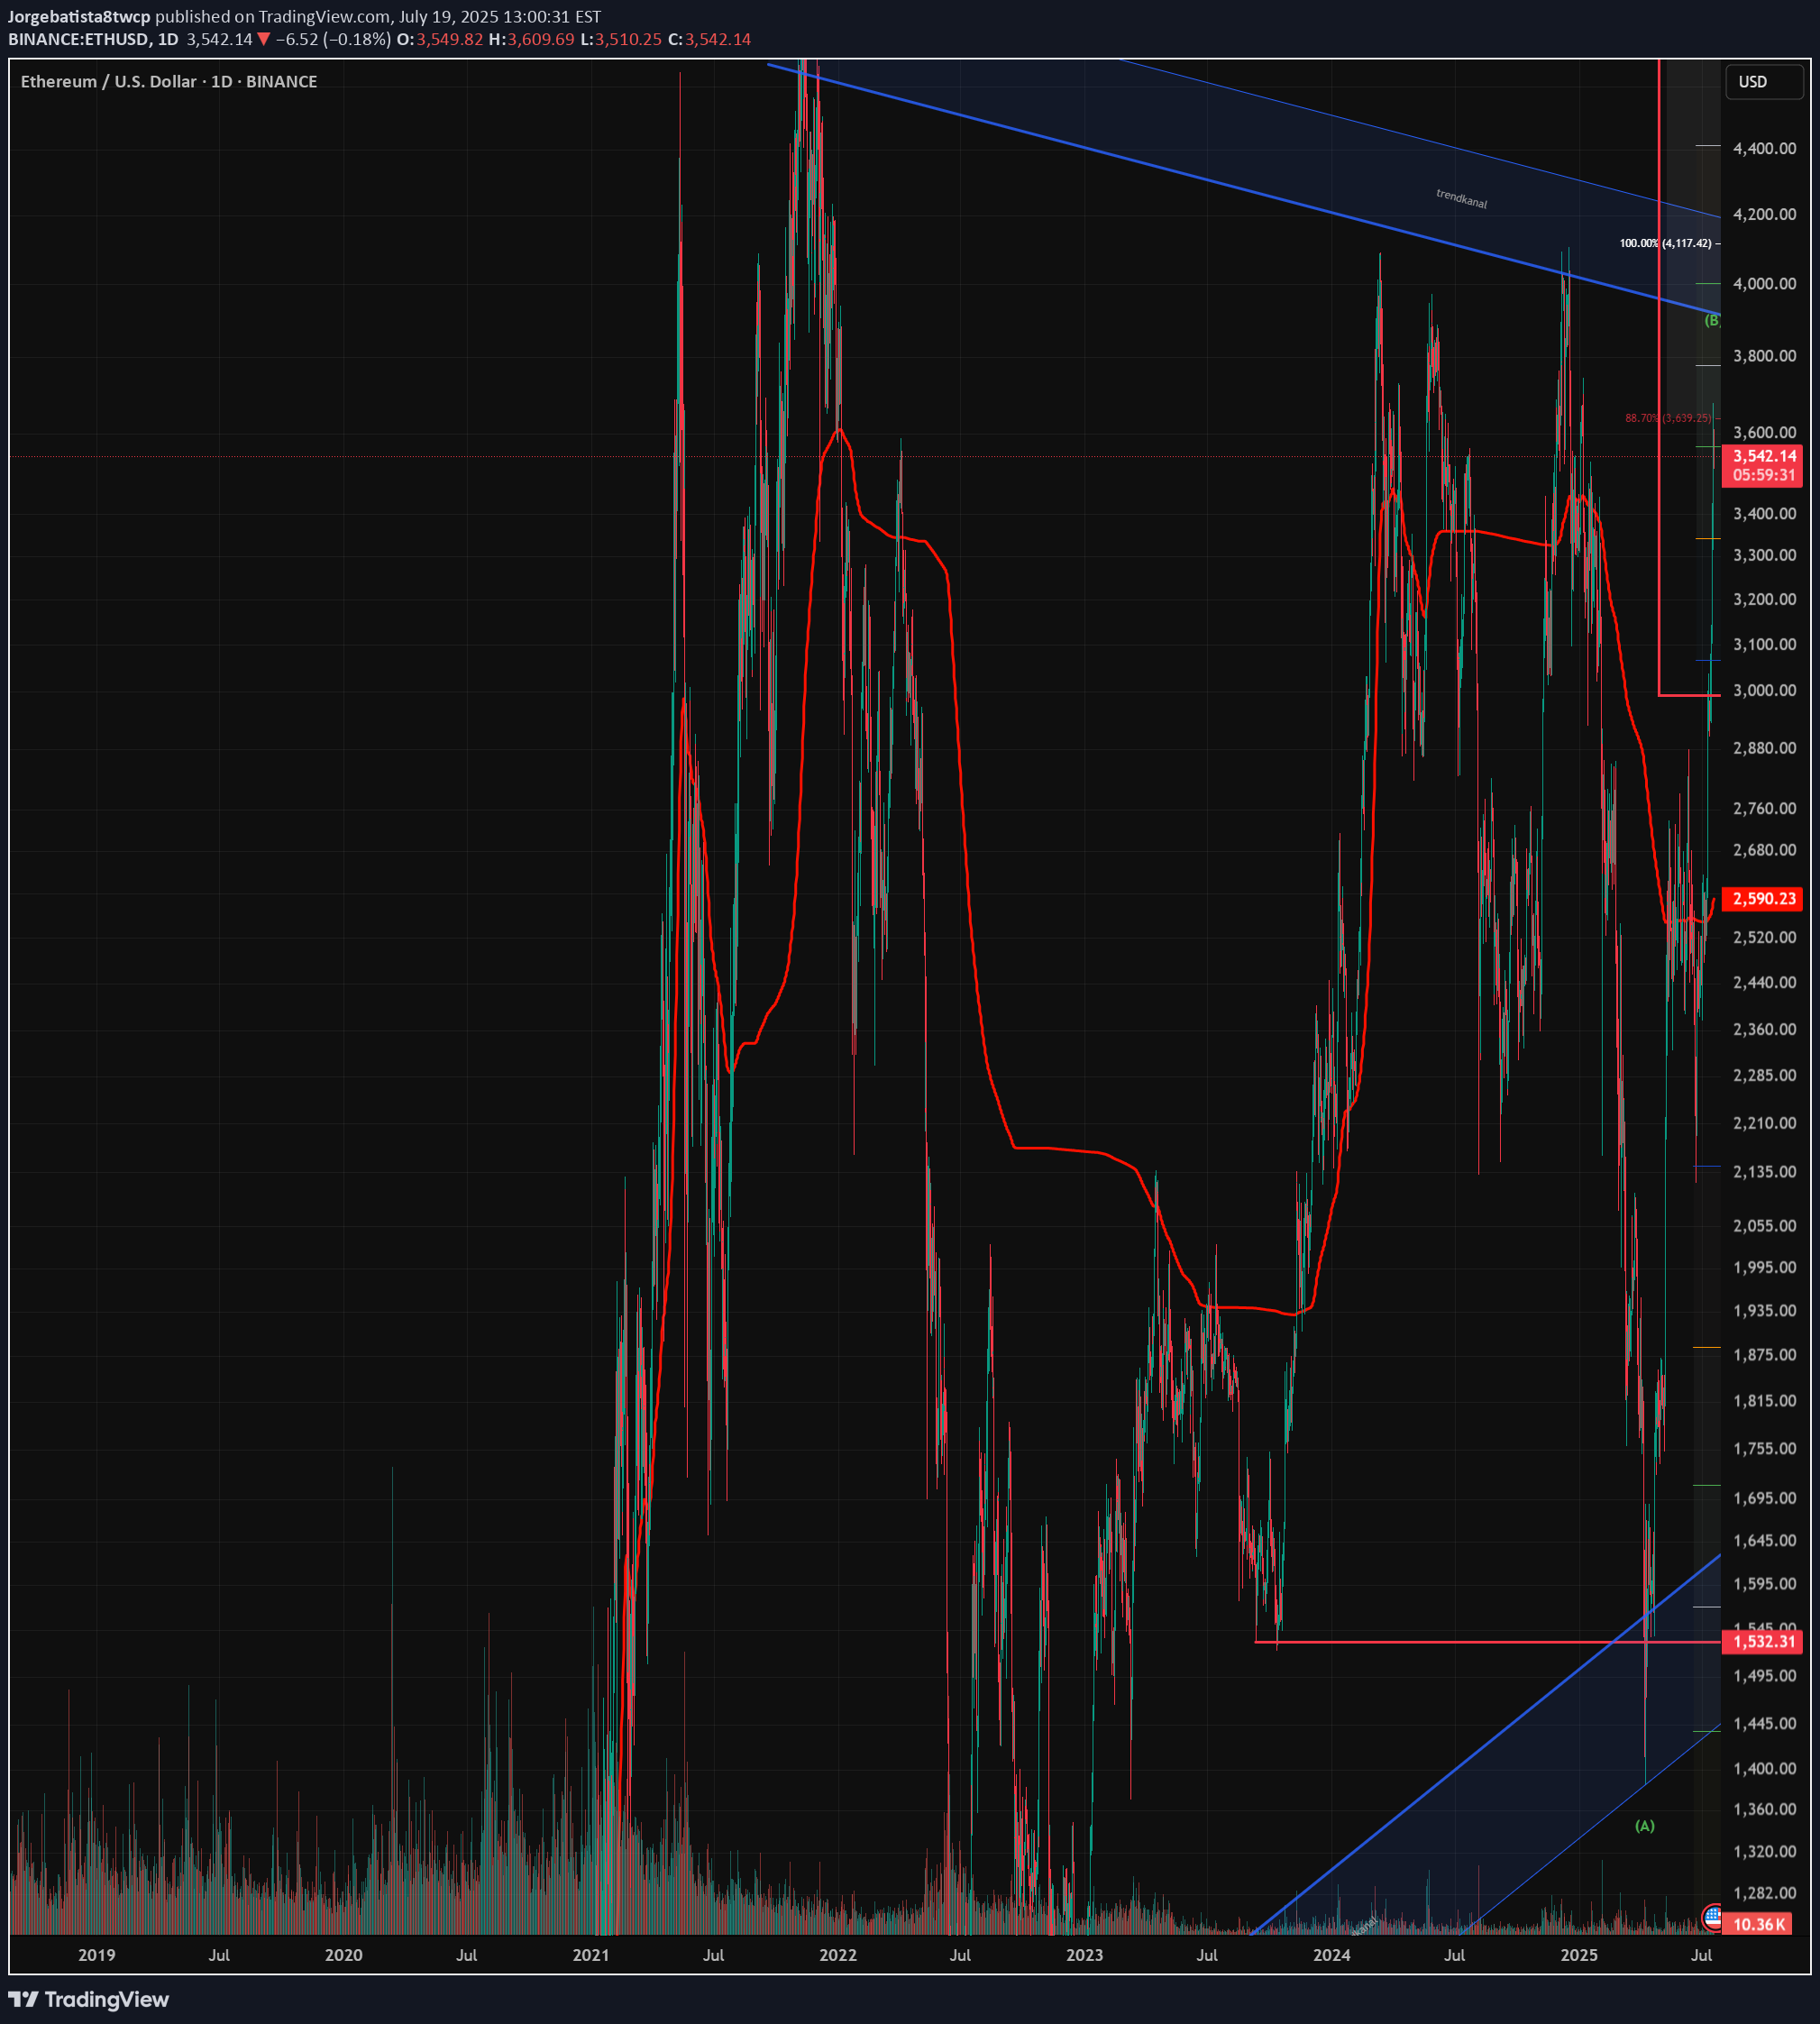
My analysis of Ethereum (ETH): Bullish and bearish scenario The analysis of Ethereum is currently quite complex. The price structure does not show clear impulses in the form of classic wave movements, but frequently overlapping patterns that indicate ABC correction waves. I therefore present both my primary and an alternative scenario for a bullish (rising) and a bearish (falling) trend. Primary bullish scenario: https://www.tradingview.com/x/uaylLcRO/ Wave 2 seems to be completed at the lower end of the blue trend channel and at the 70.70-% FiB. We could currently be in red wave 3. However, the structure of this movement is more reminiscent of an ABC formation, which could indicate a weaker impulse. Should the price break through the upper edge of the blue trend channel and exceed the 100% Fibonacci level at around USD 4,424, several important Fibonacci zones would converge in the “profit area” marked in red. In this case, a setback as part of the red wave 4 could not be ruled out. Alternative (bearish) scenario: It is possible that the blue V-wave could turn into a white ABC structure. In this case, an additional wave 4 would be omitted, which could result in a stronger sell-off. Secondary scenario - bearish: https://www.tradingview.com/x/uxuf9JlP/ If Ethereum fails to play out the primary bullish count scenario, I expect that we will continue to be in an overarching correction phase. This assessment also fits in with the typical market slowdown during the summer months. In this case, a green ABC correction could form, whereby wave C could theoretically still rise to the 100% Fibonacci level at USD 4,416. However, this would be an overextended wave B. In addition, we are already in the area of the sales or profit zone, which indicates that only a limited rise is possible. Subsequently, I expect a stronger downward movement towards the green buy area between the 1.618 Fibonacci level and around USD 1,866. LEAVE YOUR COMMENTS AND ASSESSMENT
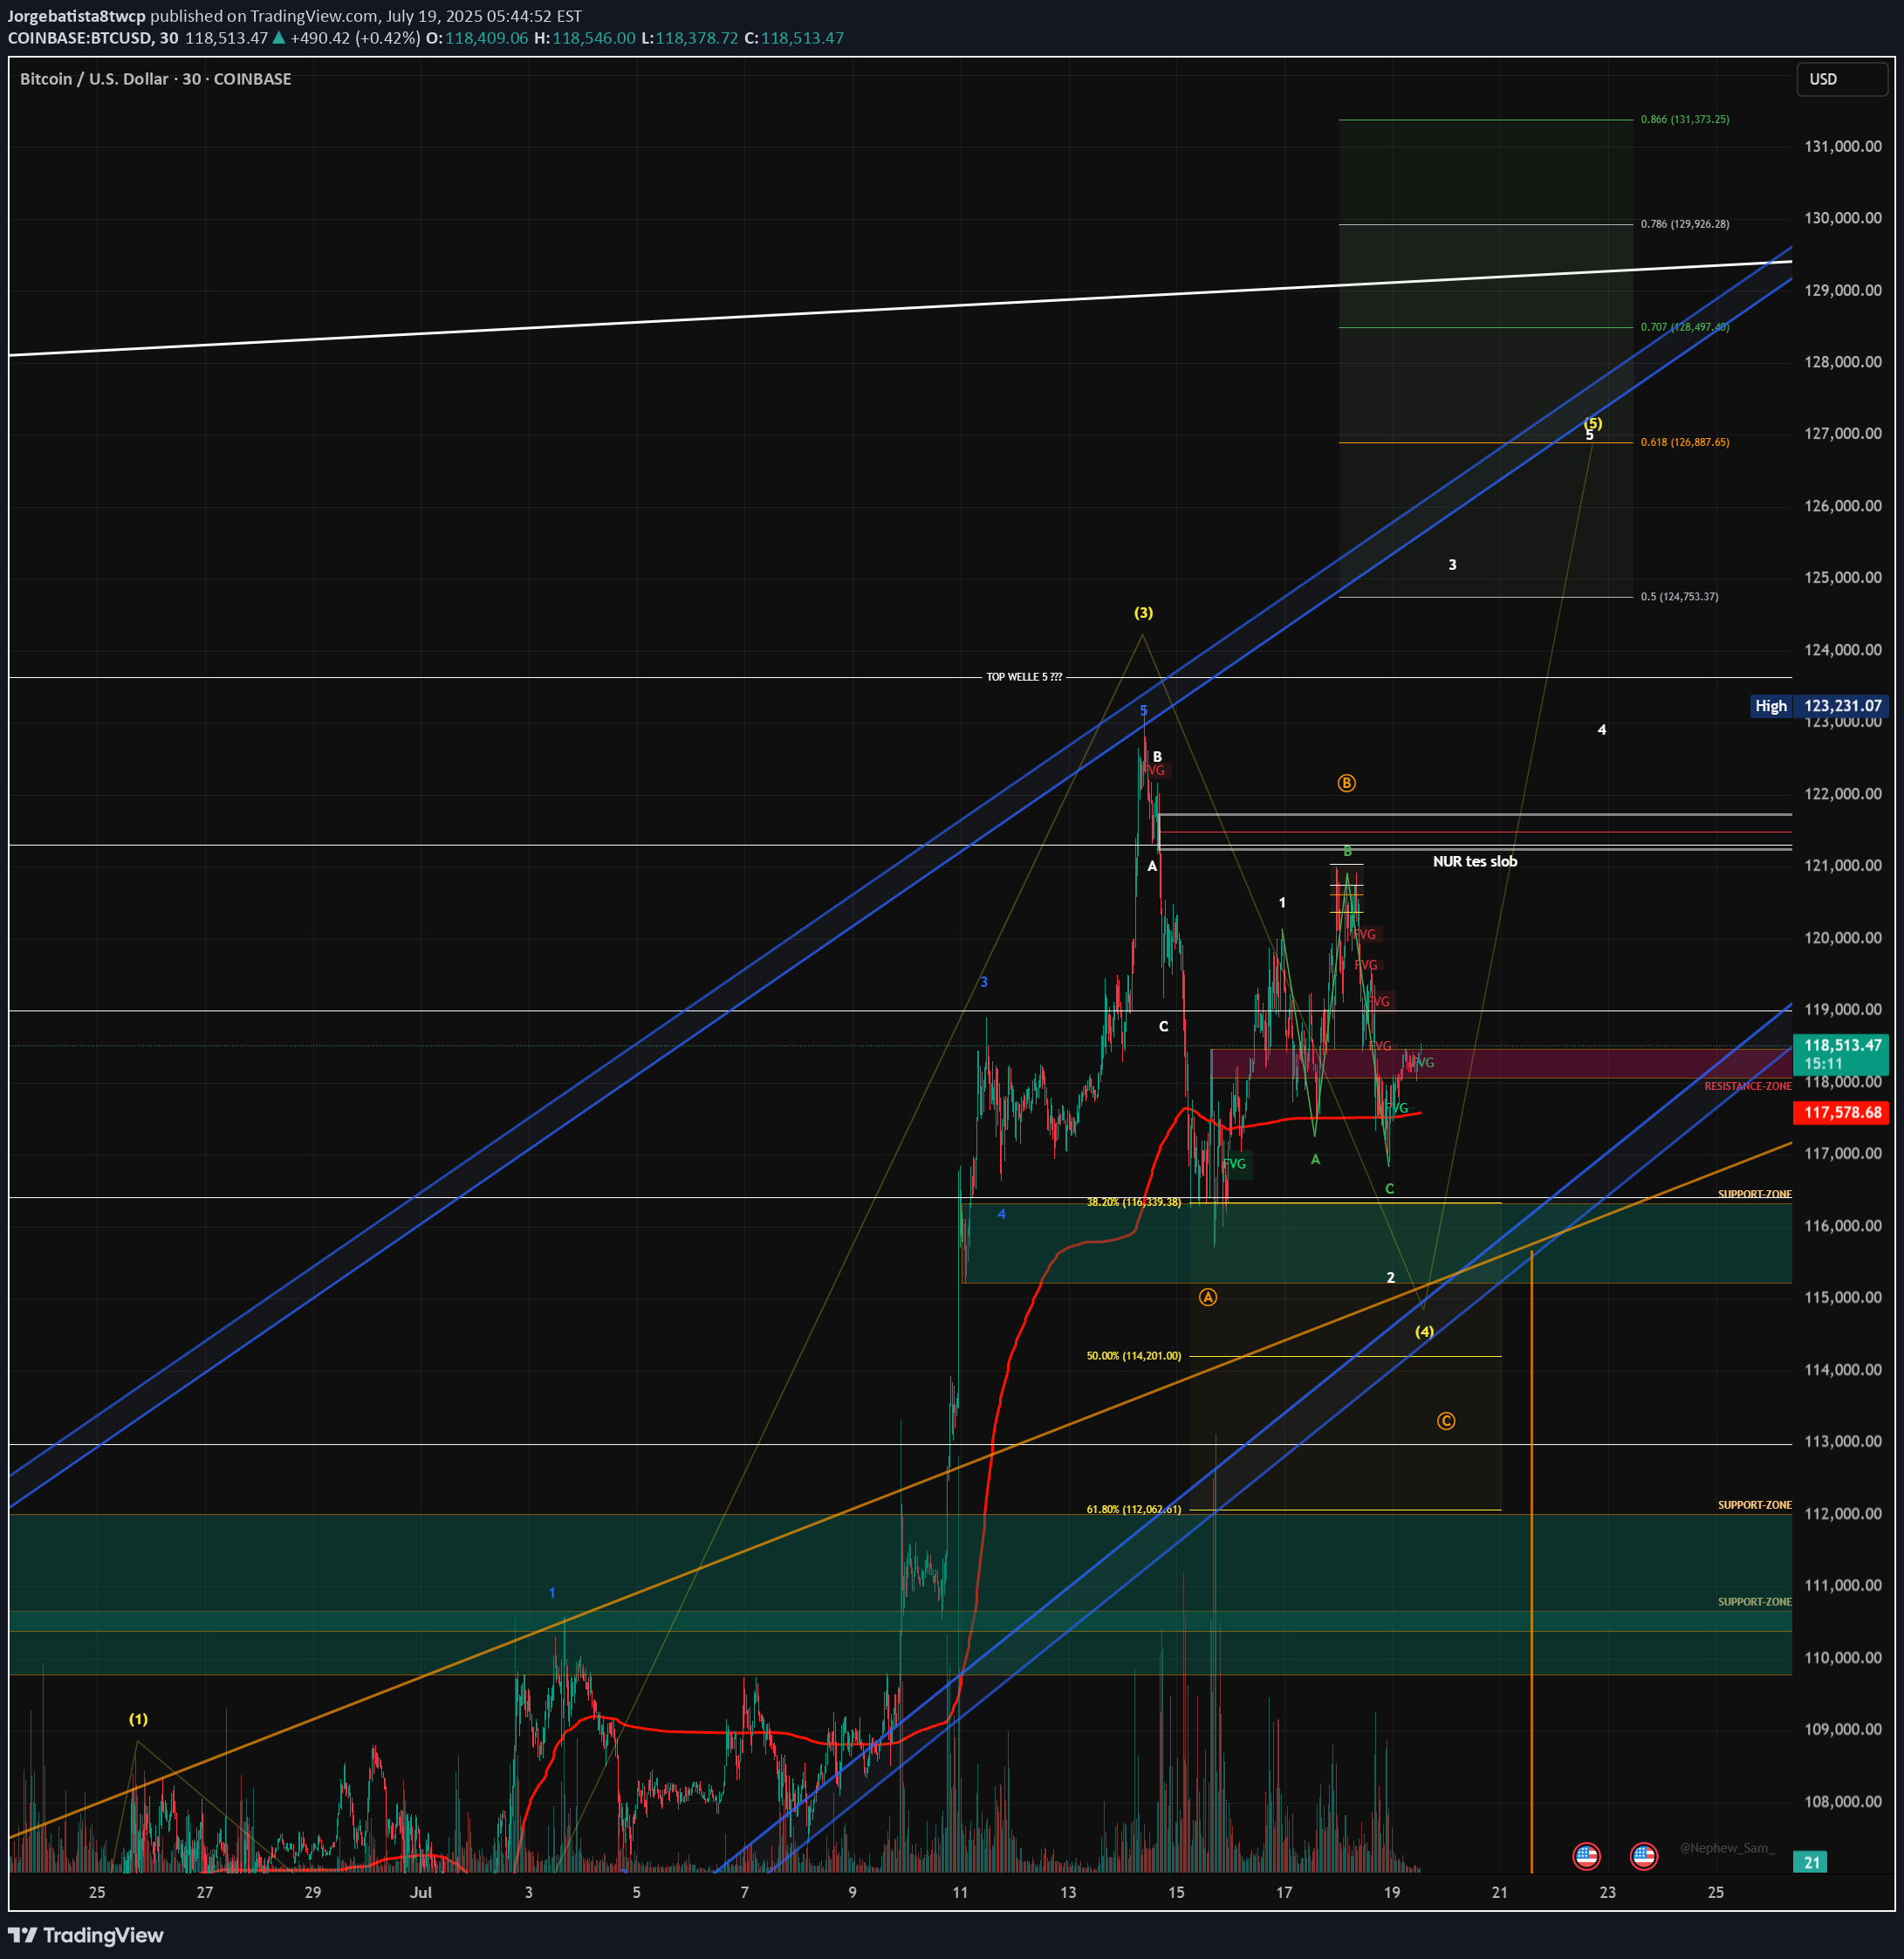
Dear Community, in order to expand my skills analysis, I will regularly share my analyses and ideas here on TradingView. I still consider myself a beginner in the “stock market” and “crypto” area and am therefore very much looking forward to your comments and input! My primary assumption is that we are still in a final upward move. However, I am also pursuing alternative scenarios that could lead to significantly higher levels. BTC analysis - 1H chart In my analysis, wave (3) in yellow is complete and we are currently in wave (4) correction, which may not be complete yet. My guess: - Wave B (yellow) has been completed, wave C has extended and could still reach USD 113 679, where the Fibonacci 100 level is located. There is also an FVG in the 1H chart. - A retest of the blue trend channel would be quite possible in order to pick up liquidity at this level before wave 5 (yellow) is completed between USD 126,887 and USD 130,000. - My risk management is down to USD 107,326 (Fibonacci 1.866). - We have already tested the Fibonacci 0.5 level (pullback level) and seen a positive reaction. However, we currently lack volume in the market. https://www.tradingview.com/x/4SmNym7p/ - If the blue channel and the Fibonacci 100% level break, I have to assume an alternative count. In this case, wave 4 would still have scope to reach the Fibonacci 61.8% level in the yellow box at USD 112,062. If my current forecast does not materialize, I assume that we have already completed wave A and are in the correction to wave B, which will be followed by wave C - with a target of around USD 130,000 for the final impulse. This scenario also fits in well with risk management up to the Fibonacci level of 1.866. There are also high liquidity areas (long) at this level, which are very attractive for market makers. https://www.tradingview.com/x/NoQdhweZ/ What do you think?
Disclaimer
Any content and materials included in Sahmeto's website and official communication channels are a compilation of personal opinions and analyses and are not binding. They do not constitute any recommendation for buying, selling, entering or exiting the stock market and cryptocurrency market. Also, all news and analyses included in the website and channels are merely republished information from official and unofficial domestic and foreign sources, and it is obvious that users of the said content are responsible for following up and ensuring the authenticity and accuracy of the materials. Therefore, while disclaiming responsibility, it is declared that the responsibility for any decision-making, action, and potential profit and loss in the capital market and cryptocurrency market lies with the trader.