Technical analysis by Jorgebatista8twcp about Symbol ETH on 7/19/2025

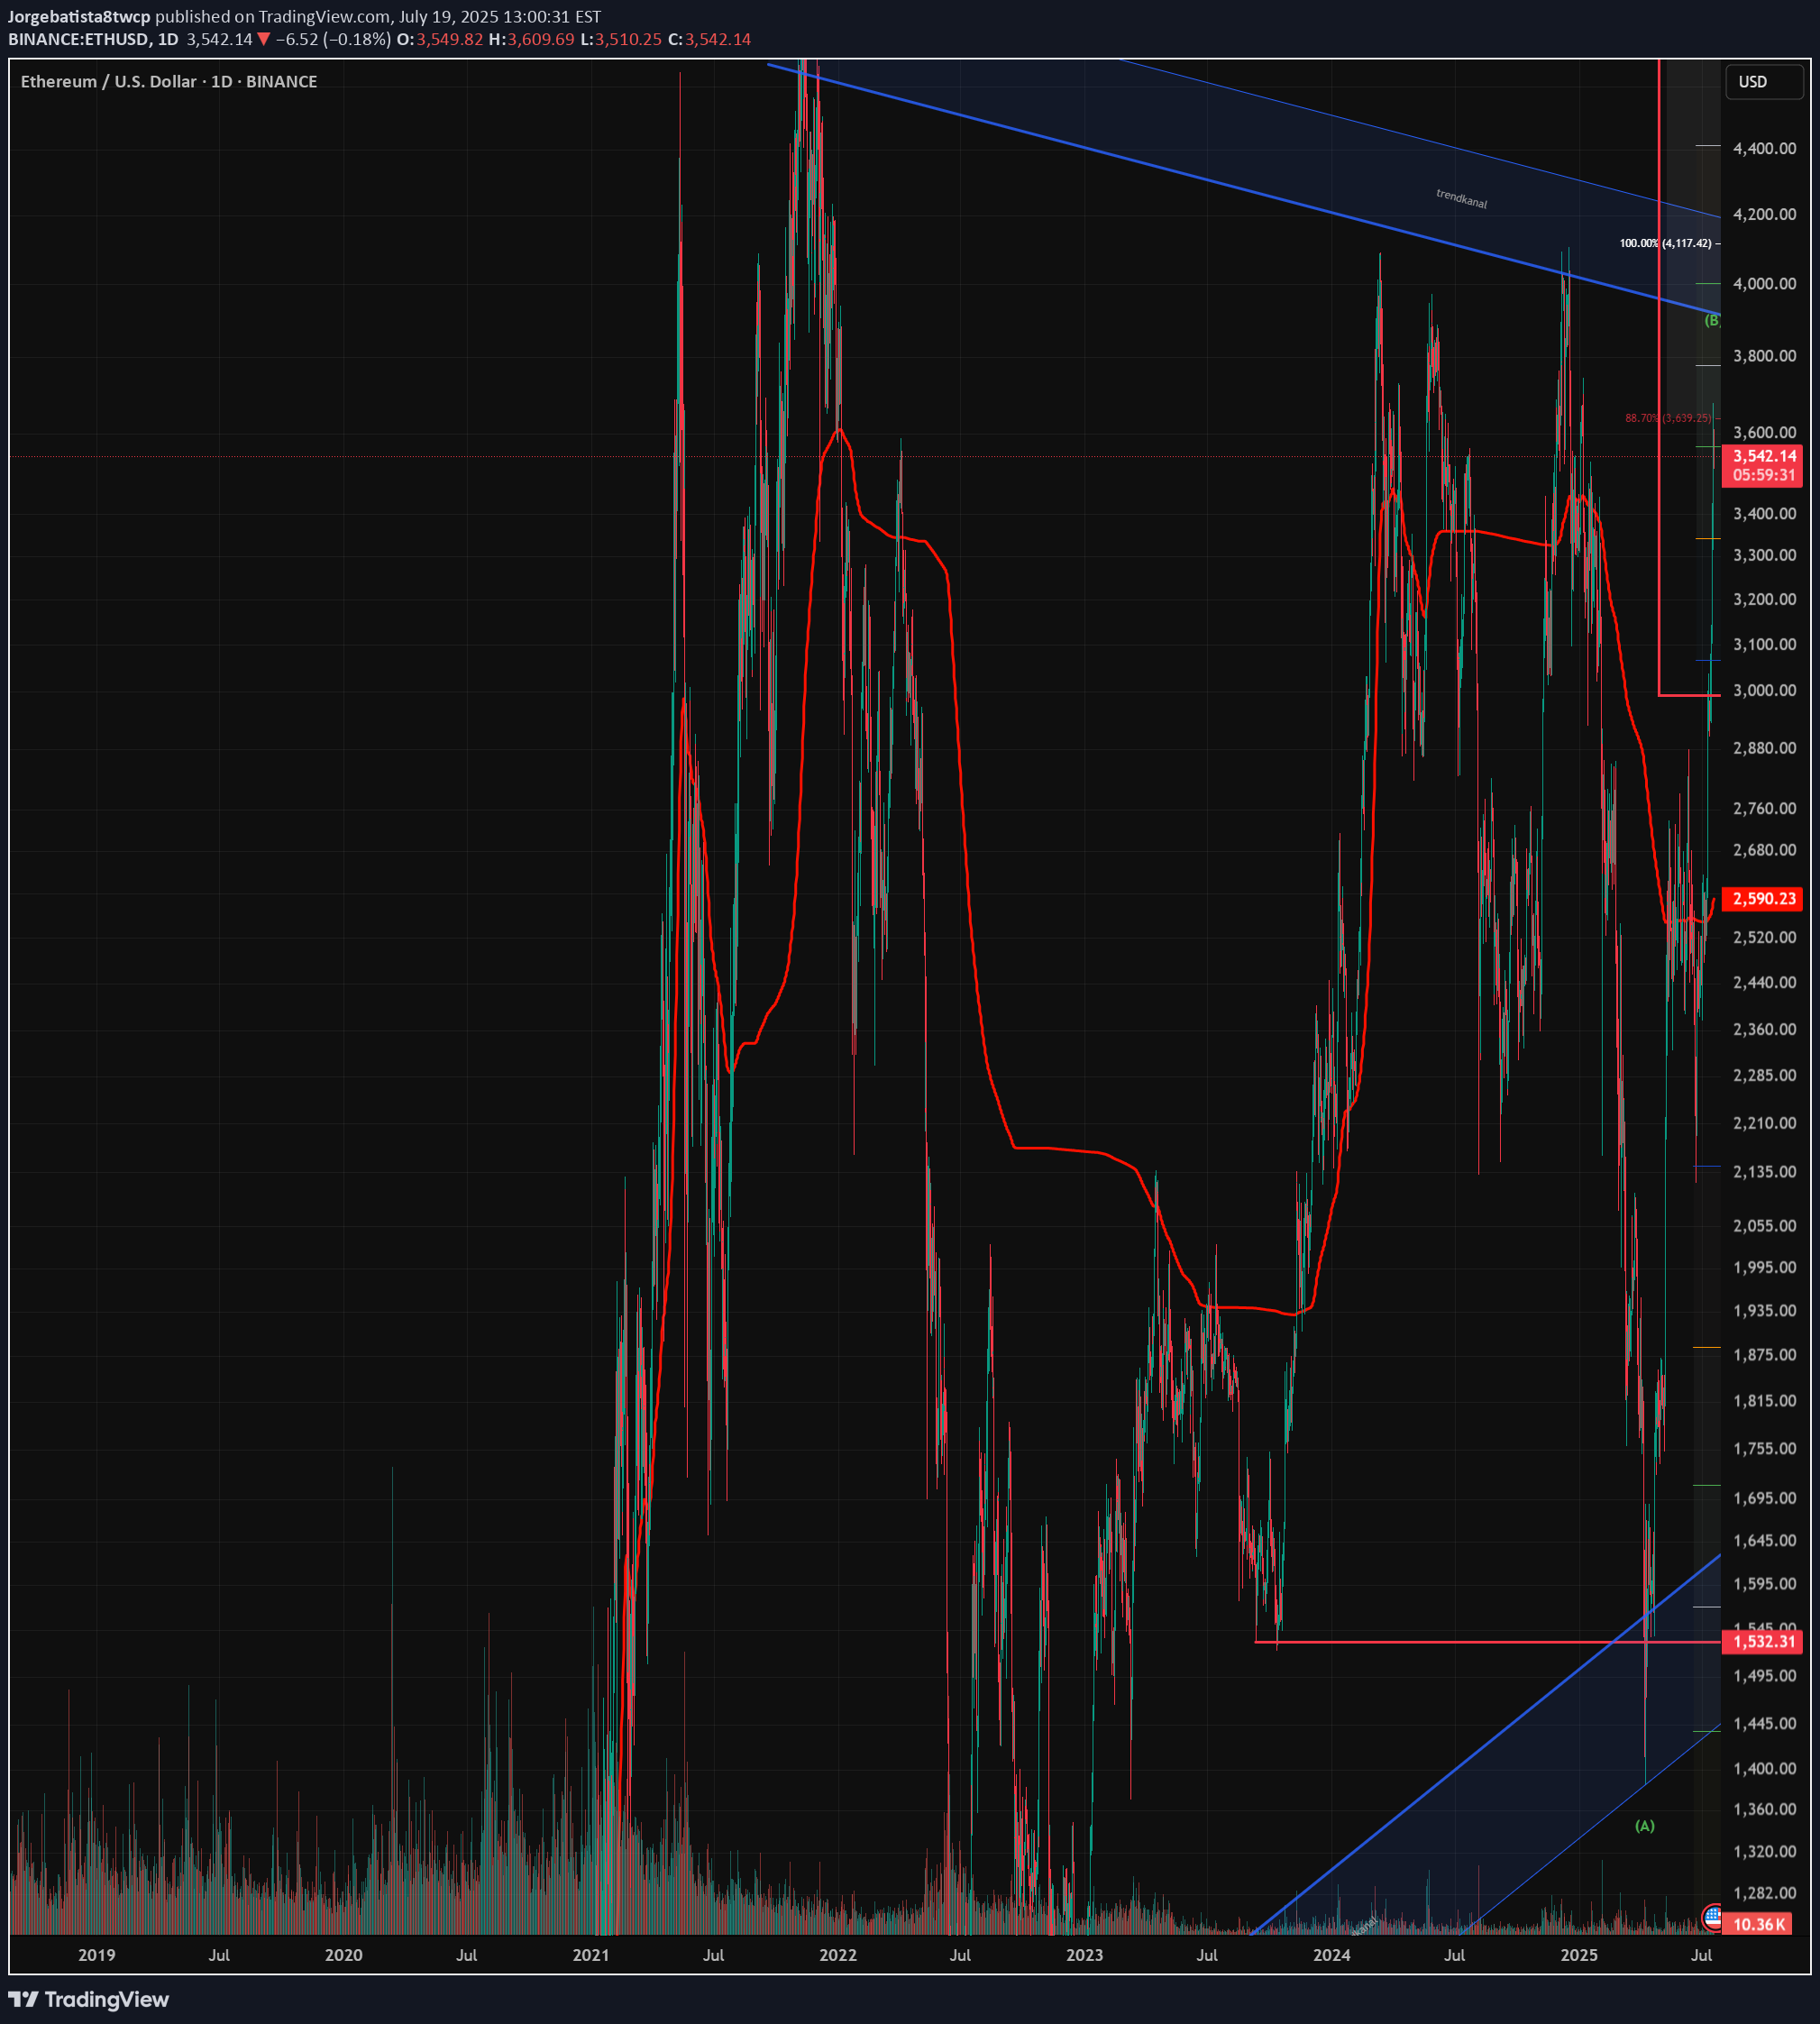
My analysis of Ethereum (ETH): Bullish and bearish scenario The analysis of Ethereum is currently quite complex. The price structure does not show clear impulses in the form of classic wave movements, but frequently overlapping patterns that indicate ABC correction waves. I therefore present both my primary and an alternative scenario for a bullish (rising) and a bearish (falling) trend. Primary bullish scenario: https://www.tradingview.com/x/uaylLcRO/ Wave 2 seems to be completed at the lower end of the blue trend channel and at the 70.70-% FiB. We could currently be in red wave 3. However, the structure of this movement is more reminiscent of an ABC formation, which could indicate a weaker impulse. Should the price break through the upper edge of the blue trend channel and exceed the 100% Fibonacci level at around USD 4,424, several important Fibonacci zones would converge in the “profit area” marked in red. In this case, a setback as part of the red wave 4 could not be ruled out. Alternative (bearish) scenario: It is possible that the blue V-wave could turn into a white ABC structure. In this case, an additional wave 4 would be omitted, which could result in a stronger sell-off. Secondary scenario - bearish: https://www.tradingview.com/x/uxuf9JlP/ If Ethereum fails to play out the primary bullish count scenario, I expect that we will continue to be in an overarching correction phase. This assessment also fits in with the typical market slowdown during the summer months. In this case, a green ABC correction could form, whereby wave C could theoretically still rise to the 100% Fibonacci level at USD 4,416. However, this would be an overextended wave B. In addition, we are already in the area of the sales or profit zone, which indicates that only a limited rise is possible. Subsequently, I expect a stronger downward movement towards the green buy area between the 1.618 Fibonacci level and around USD 1,866. LEAVE YOUR COMMENTS AND ASSESSMENT
