
Jayed
@t_Jayed

What symbols does the trader recommend buying?
Purchase History
پیام های تریدر
Filter
Jayed
Bullish Divergence in RSI right as XRP reaches LPS range.

This is just an update on my ideas from Feb 6th & 7th, view my Feb 6th post for in-depth analysis. The price is behaving a bit more bearish than my projection lines indicated, but the pattern and timeframe for the pattern unfolding has been spookily accurate.
Jayed
Irregular Wyckoff Reaccumulation Pattern + RSI/Price Divergence

Just a thought. Could be wrong, if the "spring(?)" was just slippage, then expect to see a price correction as low as $1.58-$1.55, before a strong bounce back to the current range for a final test, before lift off!
Jayed
XRP's daily & hourly RSI are screaming BUY BUY BUY!

The daily RSI assessment is primarily based upon the fact that the last time XRP's RSI was this low was before the election when price was only $0.49; yet the price is currently $2.34. This is not a bottom call at $2.34, there's still a strong chance the price could collapse as much as another 33%, to around $1.58 before the relief rally. However, the broader pullback the crypto market is experiencing is an obvious over-reaction by low disciplined speculators. As such, the odds of XRP rebounding back above $3 in the next 3-6 months (yielding a comfortable 28% ROI) is extremely high (around 70-80% likelihood). The hourly RSI has also diverted from price; setting a double bottom, while XRP's price has slipped to a lower low; providing a strong short-term indicator that the price trend is about to reverse (maybe not back above $3 in the short term, but high probability of returning to +$2.80/20% gain.) These rebounds are worst case scenarios, best case scenario this is a price range where your entry could easily 2-3x later in the year assuming the US confirms it will be buying up several cryptocurrencies for the newly created US Sovereign Wealth Fund/Strategic Digital Asset Reserve.
Jayed
Bear Trap or Dead Cat Bounce?

XRP has just broken below this movement's supporting Trend line, showing a sign of weakness after an already historic rally, climbing from 7 year depths to just shy of it's ATH within just a month. The question now is if what we're seeing now is the start of a dead cat bounce, that will see XRP return to retest $2.00. Or, perhaps XRP bulls are just taking a pitstop to eat the Bear's lunch, before blasting off to Mars! Personally, I'm long. What about you?
Jayed
XRP EoY/Q1 Price Projection

I'm sharing this as a follow up to a call I made on Reddit as we were running on $0.72 where I called the $0.72 peak and projected a retrace back to $0.55. As we're now nearing the range I called, I've decided to do a bit more thorough price analysis to delve into probability of different short term bottoms as well as projecting the most likely EoY/Q1 price movements that are to come. 1. The Yellow Trend Line: in the chart depicts if the daily RSI finds strength at 30, if this plays out, then we're going to see the price bottom just above $0.56. So if you don't want to miss out on the buying opportunity from this dip, there's a +90% chance you'll be able to fill a buy order at $0.565 in the coming days. 2. The Orange Trend Line: This is the range I've been calling us to pull back to since we ran on $0.72 over two weeks ago and I'm still sold on this being our local bottom for a few reasons. Primary among them; of the 17 times XRP's daily RSI has broken above 80 and then retraced below the 50, only 6 times has the RSI regained strength off the 30. 11 times it's capitulated below the 30. Which suggests a 65% chance you can fill a buy order at $0.542. 3. The Red Line: If XRP breaks below $0.542, it's last line of support before full capitulation is $0.52. A short term pull back to this range (without a strong bounce off one of the prior before hand) is extremely unlikely. Of the 17 times we've seen this RSI pattern, only 3 times has it pulled back as severely as would be required to see the price capitulate to $0.52. So there's only an 18% chance of filling your buy order at $0.52. December/January Analysis: These projections are based upon the downward trend continuing. These do not account for what could happen after we rally from one of the above these levels. If we see the price follow the Red Line the subsequent rally will be a dead cat bounce before we see further pain (and even more downside) in the months to come. Even if we bounce off $0.54 it doesn't guarantee we will have further upside (breaking above $0.72) the most likely outcome will be the price being range bound between $0.72 & $0.54 through the end of the year. Something else to keep in mind is that 6 of XRP's 9 Decembers have been bloodbaths and 6 of it's 10 Januarys have been bloody. Resulting in in 8/9 Dec-Jan for XRP being some of the most painful periods in XRP's history. The only exception to this was Dec/Jan 2017/18 when XRP reached it's ATH. We can exempt this from our data set as the market conditions during that time were almost the exact opposite of what we're witnessing today (ie the whole market was at peak euphoria going into the end of 2017). Optimistic Outlook: In the best case scenario, XRP bounces off $0.56 in short term, ranges between $0.56 & $0.72 through December, capitulates to $0.54 in January, then we see the price break above $0.72 by end of January/early February. Neutral Outlook: XRP bounces off $0.54 in short term, ranges between $0.54 & $0.70 through December, capitulates to $0.52 in January, ranges between $0.52 & $0.66 through all of Q1 2024. Pessimistic Outlook: XRP bounces off $0.52 in short term, has dead cat bounce into mid December, capitulates at end of year/January all the way to $0.44, with no sign of life returning until late Q2 2024.The BTC ETF announcement couldn't have come at a better time for helping lock in the optimistic price path I projected all the way back in November. It's looking like our patience through the bear market is soon to be rewarded.
Jayed
History says XRP's daily RSI is screaming "BUY THE DIP!"

In my last chart, we looked at XRP's weekly RSI, which had just hit an all time historic low. But because it was an unprecedented move, there were very few data points to try to put the potential ROI into context. So today I'm having a look at XRP's daily RSI. Because there's a bit more noise in the daily RSI, I am being rather selective with my data points, and only looking at points when the RSI dropped below 30, rallied, then tested the RSI exponential moving average for support (which XRP has just done in it's current move) So.. as you can see, over the last two and a half years XRP's daily RSI has sunk below 30 before finding support above it's exponential trend 6 times (including the current move). From Dec 23 ’20 to April 25 ’21 XRP rallied 787% From June 22 ’21 to June 29 ’21 XRP rallied 44% From July 20 ’21 to Sept 6 ’21 XRP rallied 175% From Dec 4 ’21 to Dec 23 ’21 XRP rallied 58% From Jan 22 ’22 to Feb 9 ’22 XRP rallied 71% Excluding it's 2021 bull market rally (of 787%) the price, on average, rallied 88% from it's low. In contrast, the current move has only rallied by 37% (when it briefly tested $0.46, which occurred BEFORE finding support on the exponential trend). Looking at the most anemic rally this buy signal has given, that of the June 2021 rally, which only returned 44% and lasted 7 a whopping days, we can see that historically speaking, the best case scenario for bears, is that XRP will form a double bottom, retesting $0.33. While a double bottom is still highly probable (if not guaranteed) I see the potential trade as a question of taking a high risk short for a potential 18% downside vs a low risk long at the current range for a potential +40% upside. And 40% upside from here for XRP is actually incredibly cautious, as in every case (excluding the June '21 flop), the rallies broke at least one over head resistance range, which at the moment for XRP, it's nearest overhead resistance is at $0.58 (which we're currently 40% off of) with the next resistance range sitting at $0.68, which would represent a 110% bounce from the recent low of $0.33 & 71% rally from our current price of $0.40.Oh look, we're all the way down to $0.34 (about to form a double bottom) yet the daily RSI is only down to 30, as opposed to 21 (where it was when we hit $0.33 in May). That's called bullish divergence ladies and gentlemen.
Jayed
For those listening to people say "XRP is going even lower!"

Apparently these bears aren't paying attention to XRP's weekly or monthly RSI. This is the first time in XRP's nearly 9 year lifespan that it's weekly RSI has fallen to 30, and as any trader worth their salt knows, an RSI of 30 or lower is premium buying signal. Which means XRP is flashing the biggest buy signal in it's entire history. This is the first time the asset has truly been under valued. This buying opportunity is further supported by the fact that it's monthly RSI only fell lower from the 2020 lockdown announcement, which gave investors the opportunity for a 7x return (in Dec 2020) and a 20x return one year when XRP peaked just shy of $2 in May 2021. When you take this signal into context with the fact that the FED officials have started voicing concern for maintaining their aggressive interest rate hikes, there's a lot of talk among trad-fi of gold and other commodities rallying. As history shows, crypto correlates highly to precious metals and other commodities, thus if Gold rallies, so too will BTC, XRP and the rest of the crypto industry. Even if the FED intends to increase interest rates in mid June, the dovish bluffing may at least trigger a strong relief rally, after the cataclysmic collapse we've experienced this year across virtually all markets. While this may not signal an end for the bear market, a strong rally (even on false hope) could confirm a technical bottom for XRP (and other assets) which have already experienced overly aggressive pull backs compared to the broader market. So I'm not calling for XRP to return to $2 any time soon, but I could see the June rally take us back to the $0.70 range or even back to ($1.20 if the FED delays it's rate hike at it's June meeting). Where the market tops in June will determine our trade range through Q3. XRP's technical structure suggests we will bounce between $1 and $0.56 (see my Wyckoff post from April). Ultimately this is just my current view on the market. I am not a financial advisor. Take my views with a grain of salt and apply your own perspective to what I'm seeing before making any investment decisions. While my track record has been exceptionally strong since early 2021, my record is far from flawless. May the trend ever be in our favor!
Jayed
Wyckoff says XRP's in for a rough 2022, and an explosive 2023
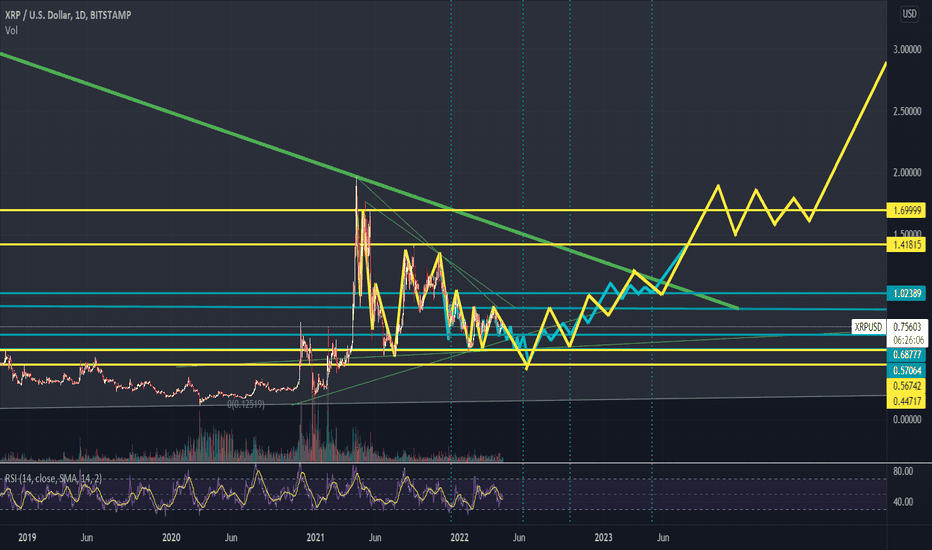
Looking like XRP is ready to collapse back to the $0.64 range any day now and begin the ugliest phase of what will be remembered as a short 2 year bear market.
Jayed
XRP Wyckoff's so much it's gonna go blind.

While I'm posting this as "long" the chart obviously says we're going to form a double bottom, or go slightly lower than our recent $0.62 low. Everyone is talking about 'alt season' going into March, and as history shows "everyone" typically get these calls wrong. So I'm taking profits here & looking to re-enter near the double bottom. Could price fall out back into the $0.50s? Sure, but as I've made clear multiple times, I'm most interested in increasing my XRP position, as opposed to increasing my USD value. For all intent and purpose, XRP has been in a bear market now for nearly a year (arguably for 4 years now; as we never broke our previous all time high) so I'm more interested in bettering my position for it's 'inevitable' new all time high beyond the $3.89 range. So unless you're willing to lose your hard earned money betting on a random analyst's pipe dream, take my charts with a grain of salt. While all my wyckoff charts have been validated so far, there is no guarantee they will continue being validated. All patterns fail eventually. I'm not a financial advisor, this is not financial advice, I'm just some mad lad trying to make a living as a trader and using Trading View to create a catalogue of all my trading plays to document my journey to becoming a millionaire or a hobo.
Jayed
A not so fun XRP fractal..

I'm back on board with my call from last week of a return to $0.67 for XRP. This time instead of using wyckoff, I've adjusted XRP's 4 hour price history (from it's initial run up in March 2021 until present) and the price correlation to this week is too striking to ignore. If this plays out, we'll see as short term peak below $0.83, before returning to the high $0.60s, low $0.70s leading into March and if the fractal holds, this will likely continue all the way into May. While this is not a fun scenario for any long term investors in XRP, consider it a golden opportunity for your final entries in the sub $1 range, as by late May, should XRP's price remain in this range it will touch it's 10 year support. Historically every time we've touched this ascending support, the price has experienced it's most extreme price rallies.For a more macro/zoomed out view of what I expect to see happen with XRP later in the year, have a look at this chart in which I project how upcoming events in the XRP/Ripple Lawsuit timeline will effect price.
Disclaimer
Any content and materials included in Sahmeto's website and official communication channels are a compilation of personal opinions and analyses and are not binding. They do not constitute any recommendation for buying, selling, entering or exiting the stock market and cryptocurrency market. Also, all news and analyses included in the website and channels are merely republished information from official and unofficial domestic and foreign sources, and it is obvious that users of the said content are responsible for following up and ensuring the authenticity and accuracy of the materials. Therefore, while disclaiming responsibility, it is declared that the responsibility for any decision-making, action, and potential profit and loss in the capital market and cryptocurrency market lies with the trader.