
Jason_Traders
@t_Jason_Traders

What symbols does the trader recommend buying?
Purchase History
پیام های تریدر
Filter
Signal Type
Jason_Traders
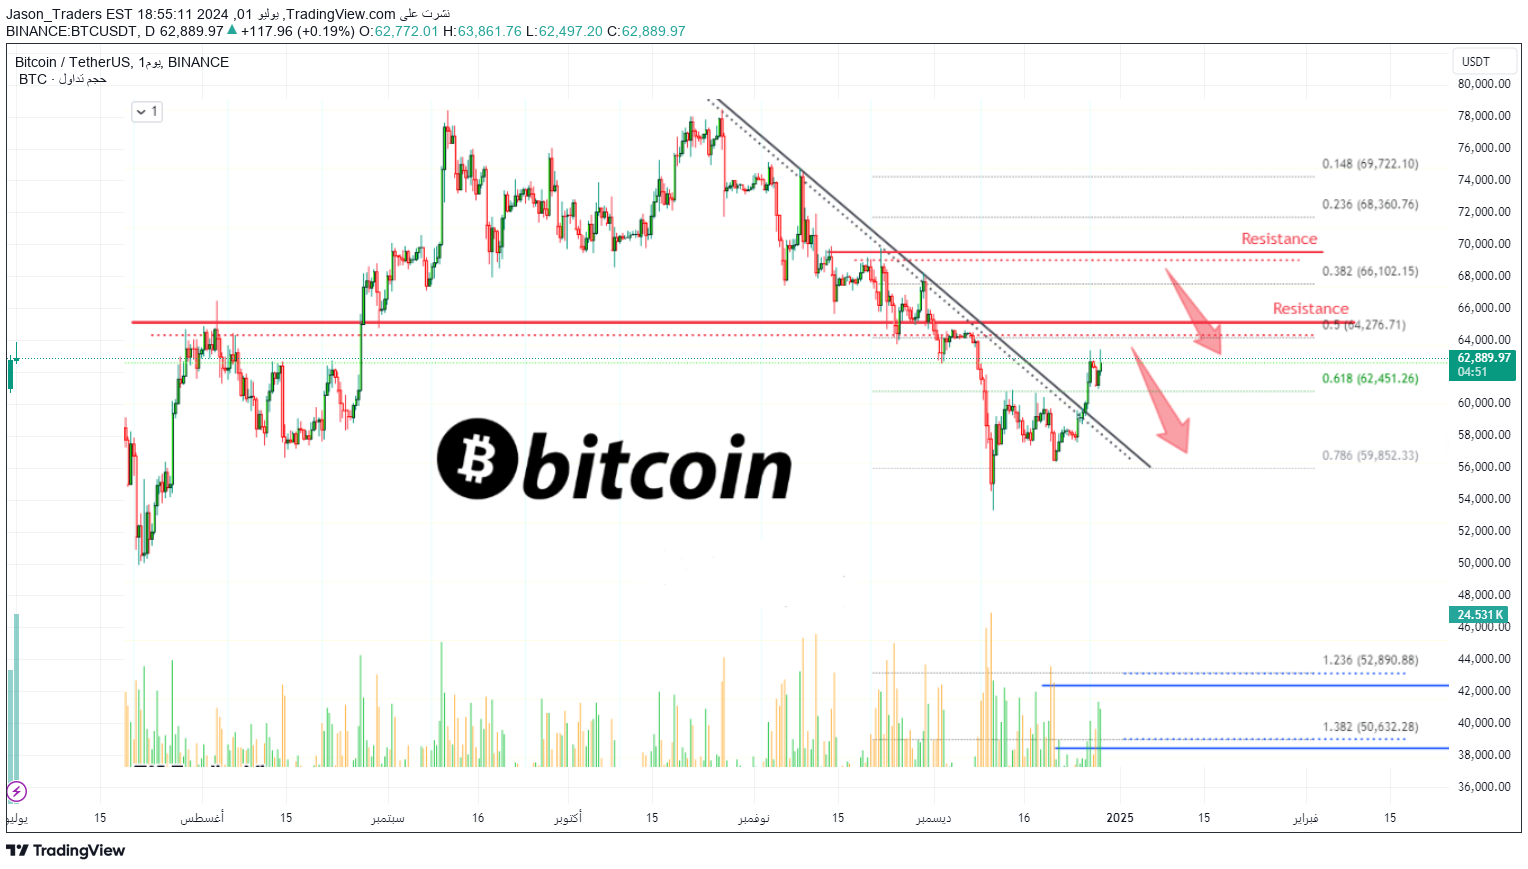
بیتکوین خط روند نزولی محلی (D-Trend) را شکست؛ حجم معاملات پایین است و همچنان به زیر "مقاومت" سقوط میکند. ما در اینجا مقاومت را سطوحی تصادفی تعریف میکنیم که صرفاً با نگاه کردن به نمودار به صورت تصادفی انتخاب کردهایم… اما واضح و آسان است که ببینیم چگونه این خطوط انتخابی تصادفی در واقع سطوح مقاومت واقعی را بر اساس قیمتهای گذشته نشان میدهند. 👈 اهداف را میتوان در پایین نمودار مشاهده کرد… فقط به حجم معاملات توجه کنید. نوسانات بیشتر؛ چرخشهای بیشتر. به یاد داشته باشید، این دورههای جانبی زمانی هستند که معاملهگران بیشترین ضرر را میکنند… نهنگهای تازهکار – کوچک – توسط امواج نهنگهای بزرگ باتجربه، تسلیم میشوند. نهنگهای تازهکار کوچک بر اساس حجم موقعیت معامله میکردند در حالی که نهنگهای بزرگ به موقع معامله میکردند… آنها اغلب لیکوئید میشدند، تا جایی که کاملاً تسلیم شدند. پس از این دوره، بازار بر اساس چرخه بازار، مسیر طبیعی خود را از سر گرفت. تصحیح به دنبال دوره رشد رخ میدهد. میدانم که خوشبختم که امروز این مطلب را میخوانید. خوشبختی من حمایت شماست. بیایید وضعیت نهنگهای کوچک را بیشتر بررسی کنیم تا از آن در آینده اجتناب شود. دلیل اصلی ضررهای بزرگ، طمع، کمبود صبر و برنامهریزی است. عدم درک پویایی بازار. بازار ارزهای دیجیتال - بیت کوین - یک بازار شگفت انگیز است. دارندگان این بازار اصالتاً حامی اکثریت هستند، همیشه و تا حد امکان. اگر کسی بخواهد در این بازار موفق شود، مهم است که با حس احترام، طول عمر و عدالت و نه طمع با آن برخورد کند. اگر کسی تصمیم بگیرد با دهها میلیون دلار وارد شود و فکر کند یک شبه ثروتمند میشود، این کارساز بود. متخصصان قدیمی و شرکتکنندگان پیشرفته بازار به سرعت خود را وفق میدهند و این افراد را بیرون میکنند. راه لذت بردن از سودهای هنگفت با موقعیتهای بسیار بزرگ، //کاهش// موقعیت است. یک موقعیت بزرگ را میتوان در یک دوره طولانی ایجاد کرد. در این حالت، یک موقعیت شورت را میتوان به آرامی، در طول ماهها، با افزایش موقعیت در هر صعود ایجاد کرد. این کار را نمیتوان به طور همزمان انجام داد، زمانی که یک واکنش رخ میدهد، بلکه به آرامی اما پیوسته زمانی که بازار آرام و پایدار است. اگر بازار تحت فشار بیش از حد قرار گیرد، حرکت خود را متوقف میکند و به دنبال جهت میگردد. به طور خلاصه، بازار خود را وفق میدهد. وقتی گروهی از افراد، که فقط چند ماه در معاملات کریپتو هستند، وارد میشوند و فکر میکنند که به سرعت پیشرفت کرد، این مشکلساز است. همه چیز در زندگی نیاز به فداکاری و کار دارد. همه چیز ارزشش را دارد. بنابراین، برای فرصت بعدی که در سمت لانگ بود، اولین احساس منفی که باید از بین ببرید، طمع است. بله، ما میتوانیم کف کف کف را تشخیص دهیم، اما اگر در آن بمانیم، در آن «راحت» هستیم. و اگر یک موقعیت بسیار بزرگ، از هیچ جا ظاهر شود به محض اینکه کف به کف برسد، قطعاً به جای کف، یک سطح پایین تر دیگر داشت. و اگر مردم در سطوح پایین طمع کنند، بازار به سقوط و سقوط ادامه داد تا زمانی که تمام طمع از بین برود. در عوض، مقداری از آن را میخریم. بخشهایی در هر حمایت… ساختن موقعیت در تمام طول مسیر به پایین و همچنین در تمام طول مسیر به بالا. ما باید از بازار در هر دو جهت حمایت کنیم. و اگر بتوانید موقعیت خود را در یک دوره چهار تا شش ماهه بسازید، بازار از شما حمایت میکند و به شما اجازه میدهد پولهای هنگفت را به خانه ببرید. اگر تصمیم بگیرید دیروز بپرید تا امروز میلیونها دلار به دست آورید، بازار راهی برای از بین بردن این نوع برنامهها دارد… این کار را انجام نمیدهد. این فقط یک تجربه است، البته، اما بسیاری از متخصصان و معامله گران بلندمدت میتوانند آنچه را که به اشتراک گذاشتهام تأیید کنند. این یک جامعه است، و در حالی که ما با پول معامله میکنیم، این بازار را برای مردم، به عنوان جایگزینی برای یک سیستم از قبل موجود ساختهایم. برای آزادی، شکوفایی، رشد و موفقیت. ما نمیتوانیم اجازه دهیم این اتفاق بیفتد. بلند شوید و دوباره امتحان کنید. این بار، قبل از بازی حتماً مطالعه کنید. یک طرح خوب توسعه یافته میتواند منجر به موفقیت چشمگیری شود و زمان، زمان، زمان، زمان. همیشه بلند مدت فکر کنید. از حمایت همیشگی شما در این دوران سخت بسیار سپاسگزارم. به زودی یک بازار صعودی سبز داشت… نمیتوانم صبر کنم تا درباره هر ایده تجاری بنویسم، "بیت کوین در حال افزایش است! … اما در حال حاضر باید منتظر تصحیح باشیم یا تأیید کنیم که هیچ تصحیحی رخ داد. به یاد داشته باشید که من یک طرفدار (بیت کوین) درجه یک هستم، اما کار من در اینجا خواندن نمودارها است.
Jason_Traders
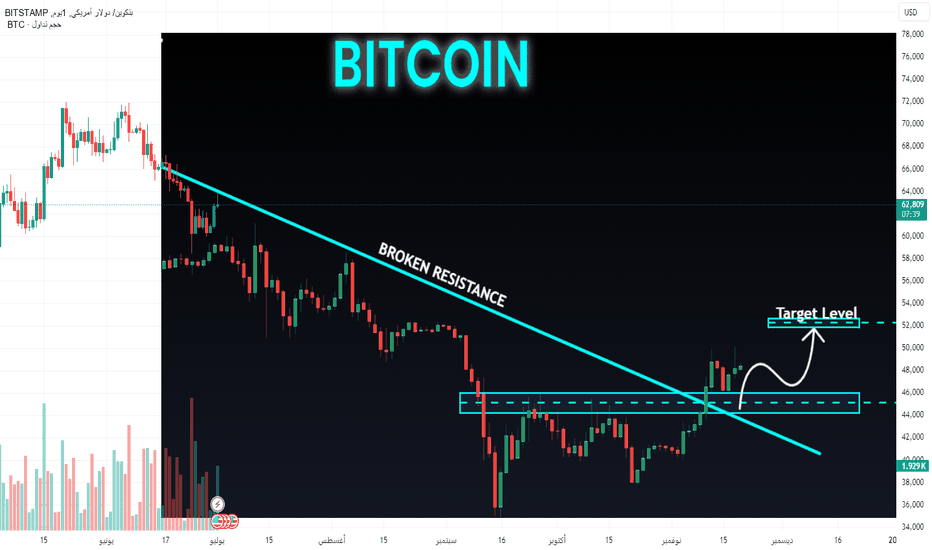
Hello, merchants (Pitukon), making chaos from the long -term increase in support, and we are the vision of a sudden escape, the resistance group, the fall and the horizontal resistance is about 62 thousand dollars, so we are optimistic locally, bachelors, and we will expect that another step for the Imachera!
Jason_Traders
Summary Summary Description: The chart offers visions of the critical levels of the market, with a focus on the basic demand area: where the low -risk purchase area that extends from 216.00 to 214.00 respectively is highlighted. Possible. 2327.00: Potential Packing Zone. 22335.00: Possible Dreaming Zone. We must evaluate how the market interacts before thinking about any decisive moves. Keep waking up and responding to the immediate developments on the market.
Jason_Traders
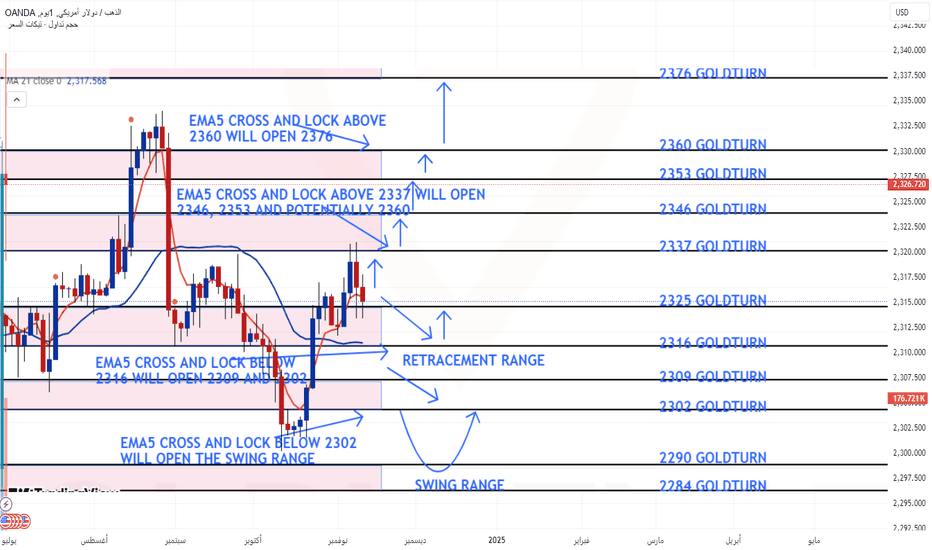
سلام به همه. لطفاً بهروزرسانی نمودار 4 ساعته و اهداف هفته آینده را بررسی کنید. ما شاهد قیمتی بین دو سطح احتمالی هستیم. 2337 مقاومت گلدن، 2325 و 2316 سطوح حمایتی گلدن را داریم، با 2337 مقاومت احتمالی و 2316 حمایت احتمالی. سطوحی در این محدوده را دید که در کنار هم تست میشوند تا زمانی که یکی از سطوح احتمالی شکسته شود تا جهت محدوده بعدی را تأیید کند. 2337 شکاف باز داریم و برای بستن آن بالاتر از 2337 به EMA5 نیاز داریم تا محدوده بالاتر را تأیید کنیم. همچنین 2316 را به عنوان یک منطقه کشش داریم و برای باز کردن محدوده پایینتر، باید EMA5 را زیر این سطح ایمن کنیم. هنگام پذیرش خرید از کفها، موارد فوق را در ذهن داشت. سطوح بهروز شده و سطوح احتمالی ما به ما امکان میدهند حرکت رو به پایین را ردیابی کنیم و سپس جهش رو به بالا را بگیریم. ما به خرید در کفها با استفاده از سطوح حمایتی که 30 تا 40 پیپ میگیرند ادامه داد. همانطور که قبلاً ذکر شد، هر دو ساختار سطح ما 20 تا 40 پیپ برگشت میدهند که برای ورود و خروج خوب کافی است. اگر سطوحی را که هر هفته در 24 ماه گذشته به اشتراک گذاشتهایم آزمایش کنید، میتوانید ببینید که چقدر در استفاده از آنها برای تجارت با نوسانات و روندهای کوتاهمدت/میانمدت یا بر خلاف آنها مؤثر هستند. اهداف صعودی: عبور و قفل EMA5 بالاتر از 2337 هدف بعدی را باز میکند: 2346 به احتمال زیاد 2353 2360 عبور و قفل EMA5 بالاتر از 2360 هدف بعدی را باز میکند: 2376 اهداف نزولی: 2325 2316 عبور و قفل EMA5 زیر 2316 اهداف اصلی بعدی را باز میکند: اهداف نزولی: 2309 2302 عبور و قفل EMA5 زیر 2302 محدوده نوسان را باز میکند: محدوده نوسان 2290-2284 آیا برای برنامه خود آماده هستید؟ نوسانات اخیر بازار زیاد است، اگر به تنهایی تجارت کنید، با خطرات بیشتری روبرو شد، اگر کاملاً مطمئن نیستید، احتمالاً حساب خود را میسوزانید، اگر میخواهید از چنین خطراتی جلوگیری کنید، با من تماس بگیرید، من به شما کمک کرد! سلام معاملهگر عزیز. این هفته دادههای اشتغال غیرکشاورزی منتشر میشود که به این معنی است که بازار نوسانات زیادی داشت. طبیعتاً این فرصت خوبی برای کسب درآمد است، زیرا من دوستانی دارم که در فدرال رزرو کار میکنند و من از قبل اطلاعات داخلی زیادی از جمله برخی روندهای طلا، ارزهای دیجیتال و ارزهای خارجی را دانست. من همچنین در تجارت دادههای بزرگ خوب هستم. میتوانید ببینید که من از طریق معاملات در نوسانات اخیر سودهای زیادی به دست آوردهام و اگر حساب شما ضرر میدهد، یا اگر حساب شما مسدود شده است، یا اگر یک معاملهگر جدید هستید، میتوانید با من تماس بگیرید، مهم نیست چه مقدار پول دارید، میتوانید کمک من را دریافت کنید! امروز ما اطلاعات داخلی زیادی منتشر میکنیم که 99 درصد آنها قابل بهرهبرداری هستند. اگر حساب شما ضرر میدهد، یا حساب شما مسدود شده است، یا شما یک معاملهگر جدید هستید، میتوانید با من تماس بگیرید و من به شما کمک کرد.
Jason_Traders
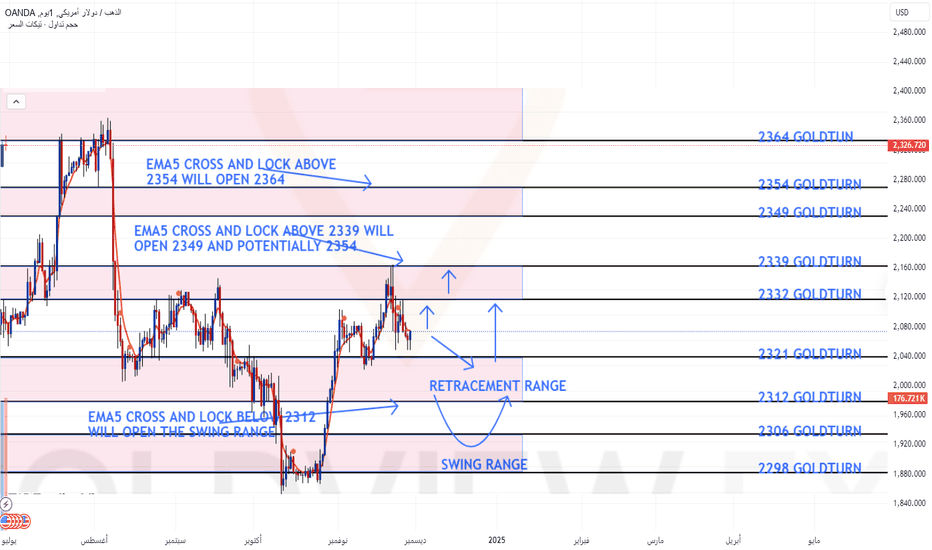
Hello all, please see the levels of the graph 1 hour and goals for the next week. We see a price ranging from two likely levels. We have 2332 and 2339 levels of resistance of Goldranan, 2321 and 2312 as Goldran support levels with 2339 as a weighted resistance and 2312 as weighted support. And we will see levels within this range that is tested side by side until one weighted level is broken to confirm the next range. We also have 2321 and 2312 as a cloud area and we will need an EMA5 lock under this to open the swing range. We will keep the above in our mind when we accept the purchase from the dividers. The updated levels and levels of our weighted will allow us to track the movement down and then catch up with upwards. We will continue to purchase declines using support levels that take from 30 to 40 points. As mentioned before each of our level structures give 20 to 40 bounce points, which is enough to enter and exit gentle. If you test the levels that we share every week in the past 24 months, you can see how effective in using it for trade with or against fluctuations and short/medium -term trends. The goals of the idiot 23322339 will open the EMA5 crossing and lock above 2339 the next goal 23492354. Primitive 23212312 crossing and lock EMA5 lower 2312 will open the swing range in the ups off 2306-2298. Are you ready for your plan? The last market fluctuations are great, if you traded on your own, you will face more risks, if you are not completely sure, you may burn your account, if you want to avoid such risks, call me, I will help you! Hello, my dear, the Tajrost, publish data on non -agricultural workers this week, which means that the market will fluctuate significantly. Of course, this is a good opportunity to make money, because I have friends working at the Federal Reserve, and I will know in advance a lot of internal information, including some trends in gold, in -kind currencies and foreign currencies. I am also good in the big data trade. You can see that I have made great profits through transactions in the last fluctuations, and if your account is losing, or if your account is closed, or if you are a new merchant, you can contact me, regardless of the amount of money you have, you can get my help! Today we publish a lot of internal information, and 99% of it is exploitative. If your account is losing money, your account is locked, or you are a new merchant, you can contact me and will help you
Jason_Traders
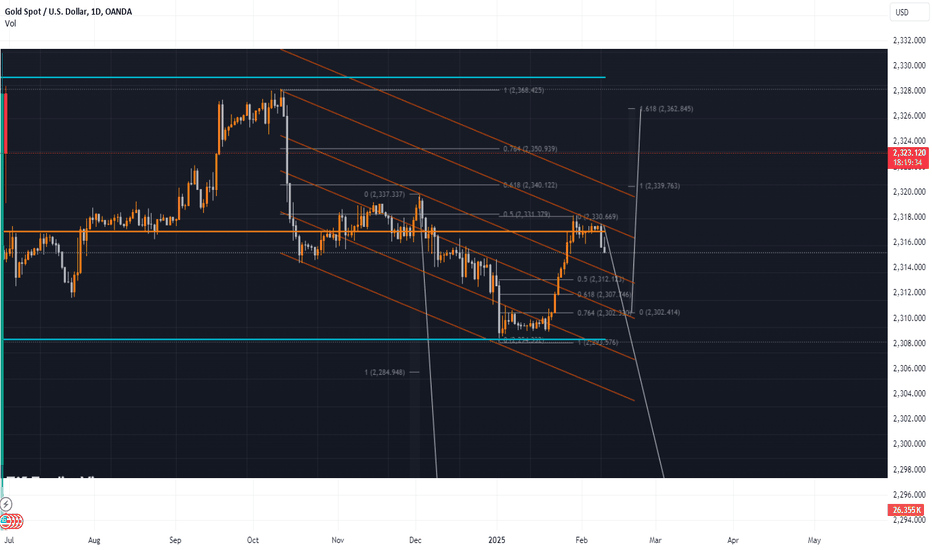
Hello, trader.The current price is around 2,321.045.There is a visible downward trend from recent highs around 2,362.845.Trend Lines:Several descending trend lines are drawn, indicating potential resistance levels.The price is moving within a descending channel, suggesting a bearish trend.Fibonacci Retracement Levels:Key Fibonacci levels are marked, including 0.5 (2,330.669) and 0.618 (2,339.763), suggesting potential resistance points.The 1.618 extension level is at 2,362.845, The 1.618 extension level is at 2,362.845, indicating a possible target if the price reverses and breaks above current resistance levels.Price Channels:Multiple orange channels are drawn, illustrating different slopes of price movement, with the price oscillating within these channels.The price is currently near the lower boundary of a descending channel, which could act as support.Support and Resistance Levels:Horizontal lines indicate critical support (2,284.948) and resistance (2,357.337) levels.The resistance at 2,357.337 coincides with a recent high and a Fibonacci retracement level.Projected Movements:If the price maintains its downward momentum, it may test the support at 2,312.123 and potentially aim for lower levels at 2,284.948 or even 2,252.571 (1.618 extension).A break above the current resistance level at 2,330.669 might lead to a rise towards 2,339.763 and further up to. A break above the current resistance level at 2,330.669 might lead to a rise towards 2,339.763 and further up to 2357337.Conclusion:The Gold futures are showing a generally bearish trend with potential support at 2,312.123. Traders should watch for breakouts below this level for further downside potential towards 2,284.948. Conversely, a break above the resistance level at 2,330.669 could indicate a reversal towards 2,339.763 and 2,357.337. A break above the resistance level at 2,330.669 could indicate a reversal towards 2,339.763 and 2,357.337.Buy Strategies:Buy Entry:Price Level: Around 2,312.123 (nearby support).Condition: Confirmation of a bounce from this level, such as a bullish candlestick or a reversal pattern.Target 1: 2,330.669 (nearby resistance and Fibonacci 0.5 level).Target 2: 2,339.763 (next resistance level and Fibonacci 0.618 level).Target 3: 2,357.337 (resistance level).Stop Loss: Below the support level at 2,293.576.Buy Entry:Price Level: Around 2,284.948 (support level).Condition: Confirmation of a bounce from this level, such as a bullish candlestick or a reversal pattern.Target 1: 2,312.123 (nearby resistance).Target 2: 2,330.669 (resistance level and Fibonacci 0.5 level).Stop Loss: Below the support level at 2,252.571.Sell Strategies:Sell Entry:Price Level: Around 2,330.669 (nearby resistance and Fibonacci 0.5 level).Condition: Confirmation of rejection from this level, such as a bearish candlestick or a reversal pattern.Target 1: 2,312.123 (nearby support).Target 2: 2,293.576 (next support level).Stop Loss: Above the resistance level at 2,339.763.Sell Entry:Price Level: Around 2,339.763 (Fibonacci 0.618 level).Condition: Confirmation of rejection from this level, such as a bearish candlestick or a reversal pattern.Target 1: 2,330.669 (nearby support and Fibonacci 0.5 level).Target 2: 2,312.123 (next support level).Stop Loss: Above the resistance level at 2,357.337.Important Notes:Confirmation: It is crucial to wait for confirmations at the mentioned levels before entering a trade. This can include candlestick patterns, additional technical indicators (like RSI or MACD), or trading volumes.
Jason_Traders
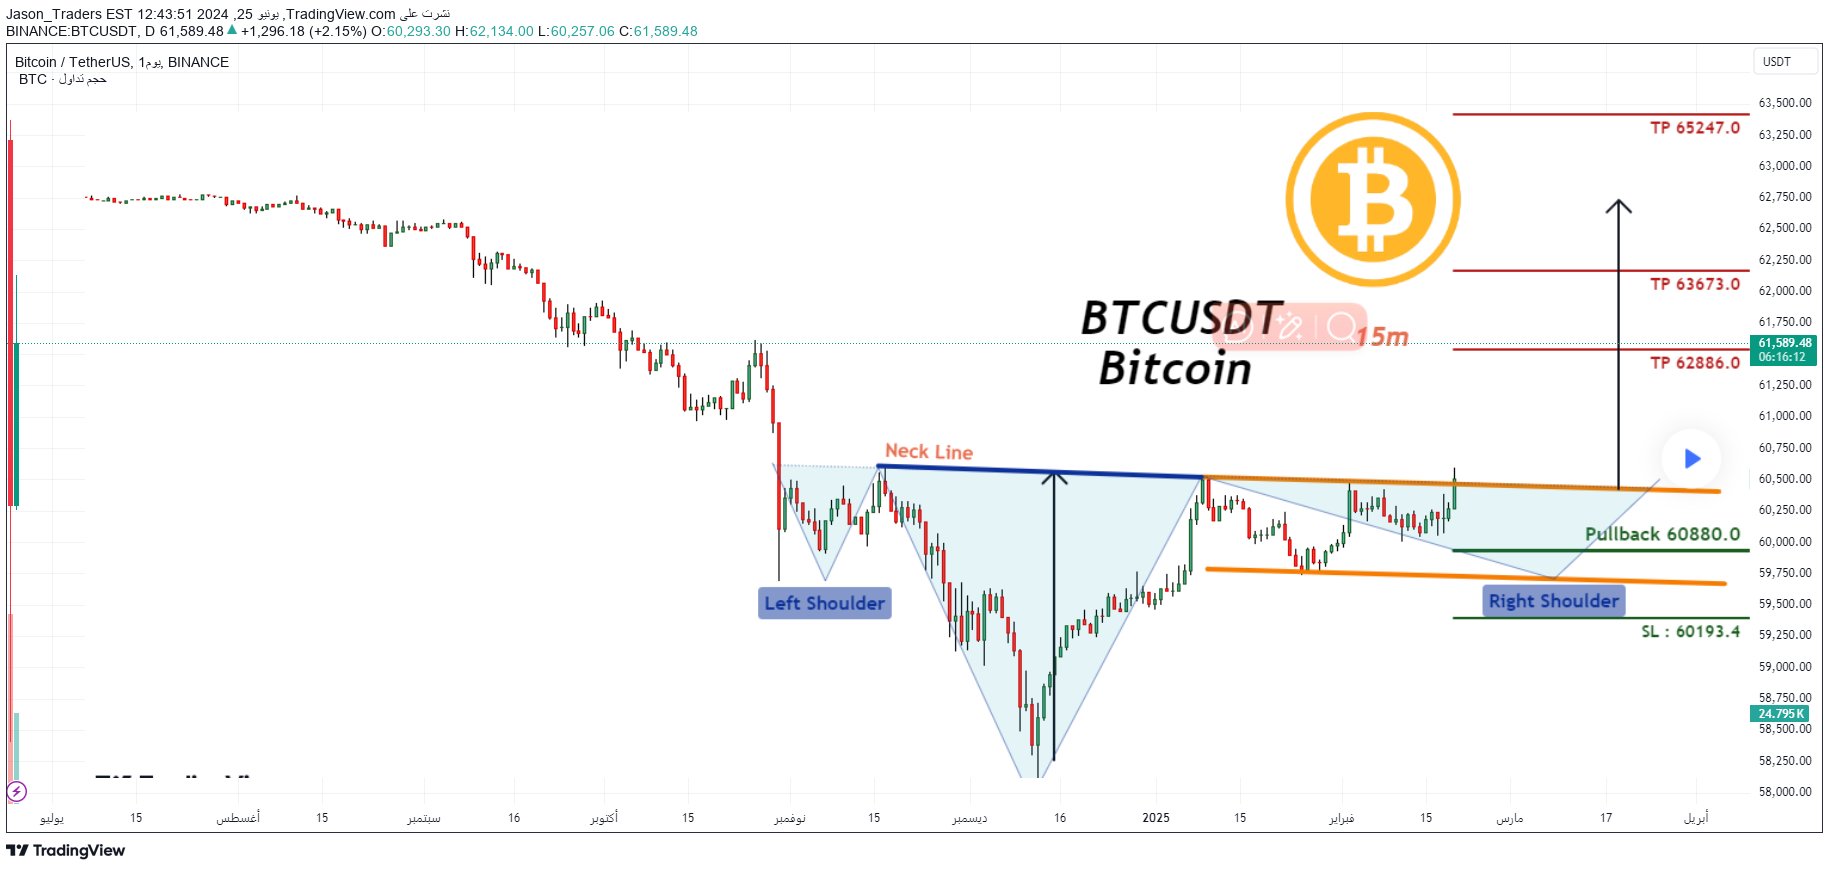
Trade Setup: There is a buy signal in BTCUSDT Bitcoin 15M (Futures) Traders can open their buy trades now ⬆️ Buy now or buy at 60880.0. ⭕️SL @ 60193.4. 🔵TP1 @ 62886.0. 🔵TP2 @ 63673.0. 🔵TP3 @ 65247.0. What do you base these signals on? Classical Technical Analysis Price Action Candlestick Fibonacci RSI, Moving Average Ichimoku, Bollinger BandsTrade Opened: Are you ready for your plan? The recent market volatility is big, if you trade alone, you will face more risks, if you are not completely sure, you may burn your account, if you want to avoid such risks, contact me, I will help you! The deal is opened: I hope everyone can understand that if you make enough profits on the trading day, you will have enough time and money to spend the weekend with your family, but reality and imagination are often the opposite, most people in this week because of the market volatility caused by the loss of accounts, if you trade alone, they often face great risks. If you want to receive accurate signals every day of the trading day, maybe you can contact me and I will help you
Jason_Traders
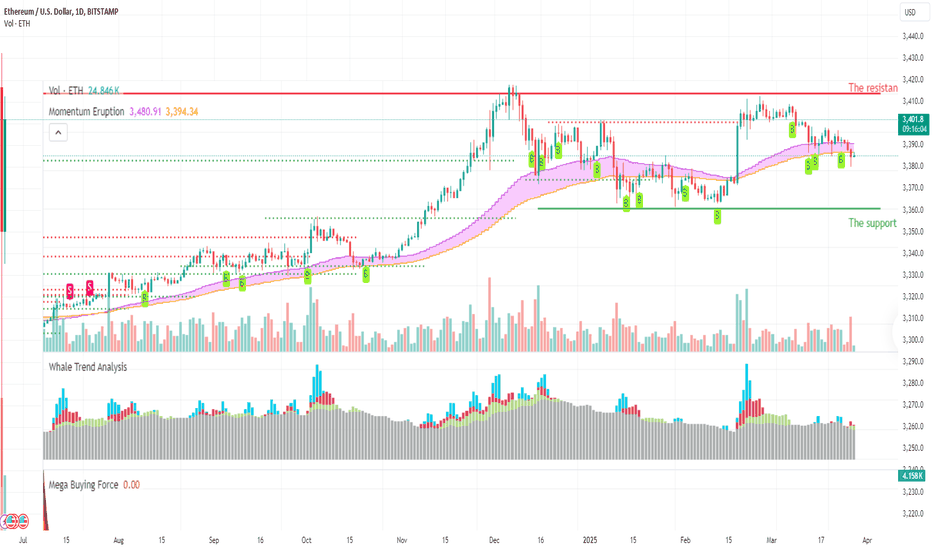
Hello, trader. The market fell further as we expected last week. During the economic data window, the market began to price in only one interest rate cut this year. This is not just for crypto market, but for all financial markets. This is likely to last until early July, before bulls come back and bring enthusiasm again. During this period, the PCE released this Friday will bring about a small rebound. In addition, multiple BTC ETFs have experienced net outflows for several consecutive days, which is also a microcosm of the US market sentiment. After some asset management companies submitted S-1 documents for the ETH ETF, the market expected that the ETH ETF would be officially listed in early July, which would also bring about a small-level rebound. Regardless, we are on the way to a rate cut, and the long-term trend for all types of financial assets must be upward. ETH fell less than BTC. This may be related to the upcoming listing of ETF ETH. Yesterday's decline saw significant trading volume, but eventually a pin-bar formed. For ETH, the MBF indicator does not indicate bottom-buying sentiment. There is no obvious blue column representing whales on the TSB indicator. The ME indicator continues to maintain a bullish trend, but the wavy area gradually narrows. To sum up, we believe that ETH is likely to remain fluctuating this week. We maintain our original resistance level 4000 and support level 2800. Disclaimer: Nothing in the script constitutes investment advice. The script objectively expounded the market situation and should not be construed as an offer to sell or an invitation to buy any cryptocurrencies.Trade active: I’m so lucky you clicked on this article. Don’t rush into reading analysis, let alone advice! No matter how correct I read the trends, no matter how accurate I read the key points, if I don't do it well, it's all wasted effort. There are trading opportunities every day. If you have problems with your ideas, concepts, or techniques during the operation, and you cannot grasp the key points, stop. If you don't bear losses, buy and sell at will, and don't manage your positions well, it means nothing no matter how good the market is. The big waves wash away the sand, and what sinks is the gold. I am willing to move forward side by side with you! Every time I write an article, I also hope to meet someone who is destined to me. Whether your account is currently losing money, your account is stuck, or you are new to trading, no matter how much money you have, I can help you
Disclaimer
Any content and materials included in Sahmeto's website and official communication channels are a compilation of personal opinions and analyses and are not binding. They do not constitute any recommendation for buying, selling, entering or exiting the stock market and cryptocurrency market. Also, all news and analyses included in the website and channels are merely republished information from official and unofficial domestic and foreign sources, and it is obvious that users of the said content are responsible for following up and ensuring the authenticity and accuracy of the materials. Therefore, while disclaiming responsibility, it is declared that the responsibility for any decision-making, action, and potential profit and loss in the capital market and cryptocurrency market lies with the trader.