
Jack-Strainer
@t_Jack-Strainer
What symbols does the trader recommend buying?
Purchase History
پیام های تریدر
Filter
Signal Type

Jack-Strainer
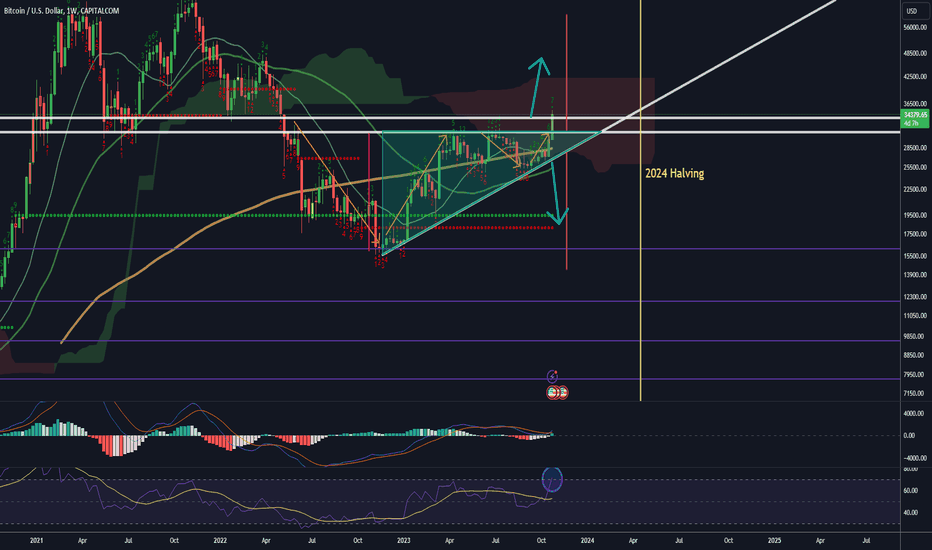
( I AM SHORT AT $33,600 ) 170 days = 20 1W candles First I want to show and discuses past halving's and price action before and after it happened. 2012 This was back when BTC first started, we cant really compare PA to now because of low liquidity and whatnot. What I will note is after the halving it stayed stable for 6 weeks straight. 2016 Here, more money was in its marketcap and it did jump close to its highs before the halving, then right after it fell for 4 weeks before it bottomed. 2020 This is the most important halving to this day because of it big marketcap, billionaires first started playing with BTC and it going mainstream. We were nowhere near our highs of $20k and 20 weeks before the halving we had a big fall killing every long with a mini rise before it killing most shorters (I was one of them who died LOL). -------------------------------------------------------------- 2023/2024 We are in a ascending triangle pattern with very strong resistance from 31k to 34k. An ascending triangle pattern can brake up or down but a brake above would mean its target would be its highs of 60k.... based on past data we shouldn't be at highs when the halving hits, we need to hurt shorters and longers before it all happens and based on PA in 2023 ALL SHORTS DIED but when did longs die? not yet. Looking at the liquidity map shorts are no where to be seen! everyone is long! most people leveraged up there current positions and pushed up liquidations based on braking new 2023 highs and the rest have just been holding from 18k to 24k. THEY NEED TO BE SCARED OUT OR KILLED. Lets not forget about the WW3 possibility looming. Now lets look at the triangle braking down, the target would be back to its "bottom" which would mean taking out all of its higher highs and brake the "Bullish Scenario" and that would most likely cause a dramatic liquidation event which would brake 15k and taking us down to the purple lines. Remember all longs are still here and alive without any real pain, never in history has a multi billion dollar asset let one big group win. Normally they hurt and kill everyone before a big move happens. PURPLE LINES ARE THE BUYING AREA

Jack-Strainer
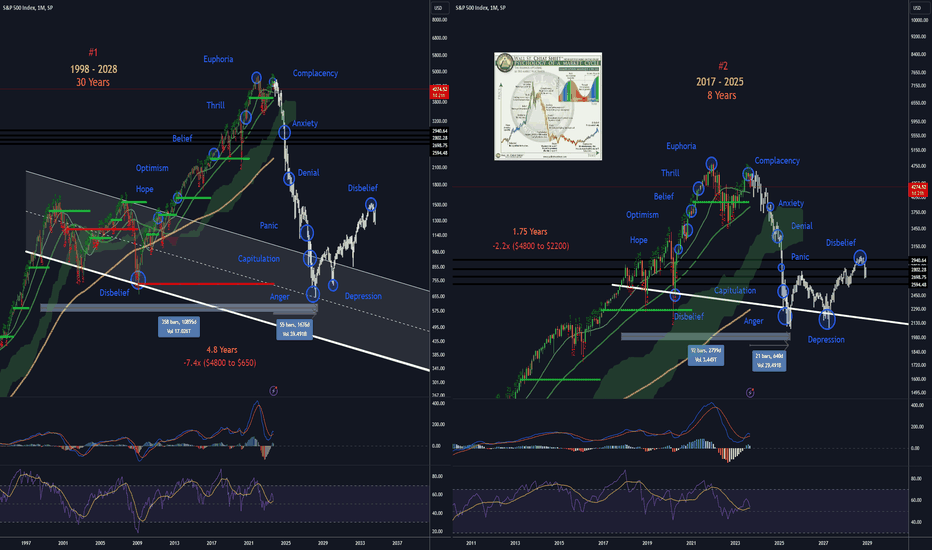
This is all based on a failed soft landing scenario where we get pushed into a Resection/Depression. The main difference between #1 & #2 is the WW3 outcome and the failing of banks. In chart #2 the war was fast and non nucellar with banking getting hit but not that badly. In chart #1 the war was long, major and nucellar and the banks crash, the government would want to converting every account to CBDC's to "re work and fix the banking system". In chart #1 it will take 4.8 years to hit bottom (Sep 2023 to Jan 2028) & chart #2 it'll take 1.75 years to hit bottom (Sep 2023 to Jun 2025). Chart #3 1902 - 1932 It took 2.1 years (Apr 1930 - Jun 1932) to top out in its 'Complacency' phase and reach its 'Anger' phase. From the touch of the main channel till the ending of the Great Depression it took 30 years The top of the market was at $30 and the bottom was -$85% away at $4.4 (-6.8x) Comparing the 1900s chart (#3) and chart #1; The similarity's in both are insanely accurate from the 30 year time frame to the same amount in price change. The only difference is the amount of time it takes for the bottom to form, if the #1 chart plays out then it would mean it'll take double the time to form a bottom then chart #3 or it plays out faster witch ends it faster. I would bet on a bottom in 2028 with a 4.8 year distance to go threw and end WW3 with a mass liquidation of all banks and the middle class, to be able to change the entire banking system and replace it with CBDC which they would control and monitor (FEDNOW already is online and working). $KBW the Nasdaq banking Index The end of the triangle is somewhat @ $62 to $75, if this brakes that means major bank liquidations are coming, there's no way around the destruction of banks. With its monthly grinding on the 200MA not looking too promising. The credit card debt compared to personal savings are dramatically inverted. Now lets get into a market crash with no war aka chart #2. Taking an almost 2 years to find the bottom and ending in 2025 also finding support at the same line and area from the coved level bottom. Taking 2.2x from the price the market ending somewhat stable and strong which means banks do not die but just fell. Chart #2 & #3 play out similarly in price action other then the distance fallen under the 200MA, chart 2 would be grinding on it or under it. The distance between the first bottom and the last is 8 years and a depression should be at least similar to a past great depression witch would be 30 years or close to it, the formation starts from the beginning to the bottom and touching the formation for one last time.the VIX is about to blow

Jack-Strainer
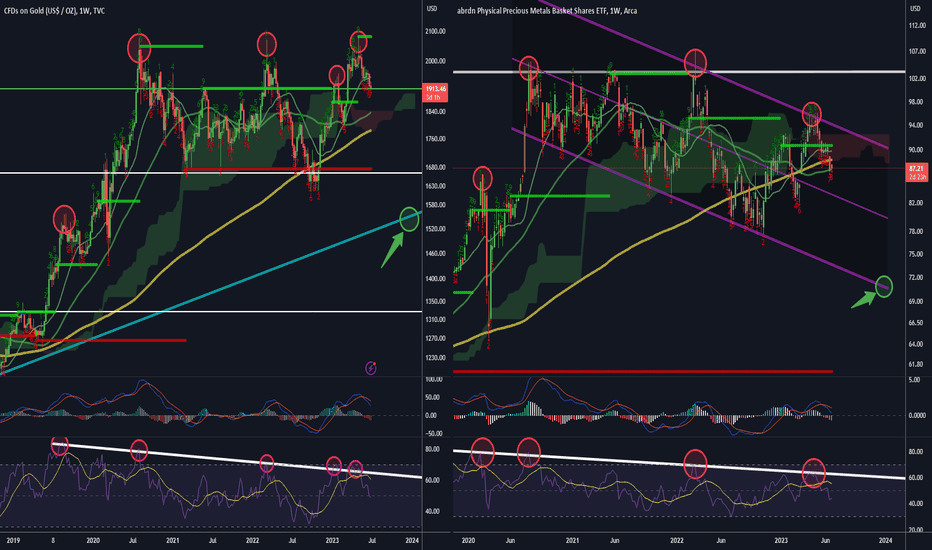
GOLD My last post about gold was at the start of 2023, bullish, looking for a brake of 2k USD but that didn't happen. The main point of the last post was looking at the long term trend line starting back at 1973, the buy point was supposed to be $1500 because after every real push up it needed to hit the trend line to get max momentum for a new brake of zones. 1973 - 2003 With 4 trend line confirmations at the beginning then a bull run from $100 to $800 it fell back down for a multi year trend line grind from 1993 to 1996 with a brake down to $230 corelating with the dot come bubble burst starting in 1997 and ending in 2000. 2003 - 2023 This chart is where the trend line really shines. It took 6 years to re test the trend line, testing it 5 times in the term of 1 year. Before a brake of the top ($800) it had to fall back down to the trend line at the yellow circle to rush to new highs of $1900 in 2011. After the rush to new highs it took 5 years to hit the trend line and formed a bottom in 2016 at $1000, it rushed up to create a TD 9 on the 1 month and form a top to fall back down and grind on the trend line for multiple years. In 2018 it hit the trend line one last time to rush up to semi new highs at $2100 but consolidated for years. The last trend touch was 2 ish years before the corona pandemic rushing back to the top with semi new highs but it couldn't budge till this day. The past 3 months proved its not ready yet with the perfect bareish push back down right when the TD9 was hit just like 2016 to 2019, why isn't it ready you ask? because it hast hit the trend line that will give it the momentum it needs to push higher also the so called covid "recession" wasn't really a real recession because so much money was pushed into the market it didn't last or even show in the charts anywhere. A recession takes money out of the market and pushes it into non risk assets but in 2020 everything and i mean everything went up. We need a real recession to get this ball rolling aka WW3, fun times ahead. Golds buy area $1500 to $1350 My guess is gold will bottom in December 2023 on the brink of 2024 with a target of $5k once broken. Metals Basket ETF The basket of metals consists of (Gold, Silver, Palladium, & Platinum) the top metals in the world. if these make a move the rest of the metal market follows, so its a grate way to see how the metal markets are going by watching the basket and find trends with this instead of just gold or silver or what have you. This chart is in a downward channel with the RSI also in a down trend, each hit of the RSI line creates a top while simultaneously hitting a very important/strong part of the down channel. With the one exception in the fall of the covid recession, the channel started at the end of 2020 and is still in it. Once the channel brakes its time for a metal bull run and obviously it hasn't done that yet with an obvious top in these past few months. Look forward to under 80, that should make gold at $1500 or under and silver under $15/$10 which are great buy areas.

Jack-Strainer
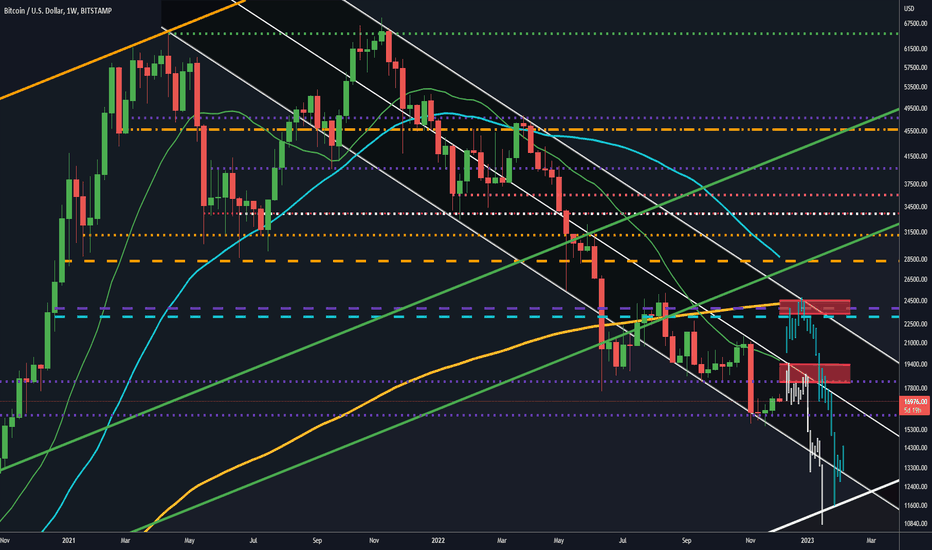
(FYI MY POSITIONS ARE AT $23.9K) If I miss it I miss it, oh well Positions Potential positions; $18.2k & $23.9k 18.2k broke a few weekly candles, this isn't good at all but with a good position everything will be fine right? well we will see If we get into a position at 23.9k and the weekly stays under 18.2k I can promise we can make profit but if it closes above 18.2k then that's when I get confused with a miner bullish thesis. Once bulls close weekly/weekly's above $24k then ill have a major bullish thesis but I highly doubt till happen. We need weekly's to close under $18.2k and when the last weekly closes under 16.1k then that's when we see a +20% fall [i ]Take Profit T1: $9,699 T2: $6,999 T3: (aka sell your soul): $1,000 - $2,500 glhf, be safe leverage is no jokeThe kiss of deathgood luckclosed at brake even, my short was 24k and im out sadly. waiting for 28k-31k or let a daily close under 24k again then ill re enter.31k-33.5k is resistance (MY SHORTS ARE AT 33.5K)the monthly an weekly's stayed under the 1.618 fib also under the resistance at 28,260. I canceled my orders at 33.5k, sold all my spot and still thinking about if I should start shorting. my plan: lets just say my position is 1 btc short, im thinking of shorting .5 btc around 28.3k ish and get the next .5 btc once a 1D closes under 24k or wait for a weekly close under 24k to enter the rest of my position. It all depends on pa THE MOST IMPORTANT THING IS CANDEL STICK CLOSES ill update when I start, I haven't made a move yet glhf

Jack-Strainer
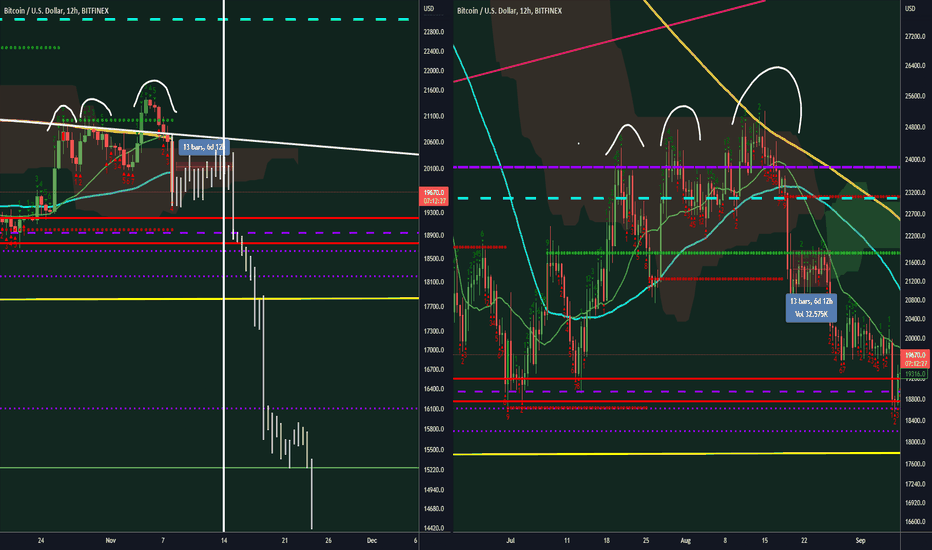
good luck, there will be big opportunity's coming side note: watch gold hers what its feels like its trying to copy: NOV 14th 2018 dashed line: Nov 14thPDF of autumn panics, it explains the weird phenomenon of crashes in autumn spiralcalendar.com/wp-content/uploads/2016/09/autumn_panics.pdf

Jack-Strainer
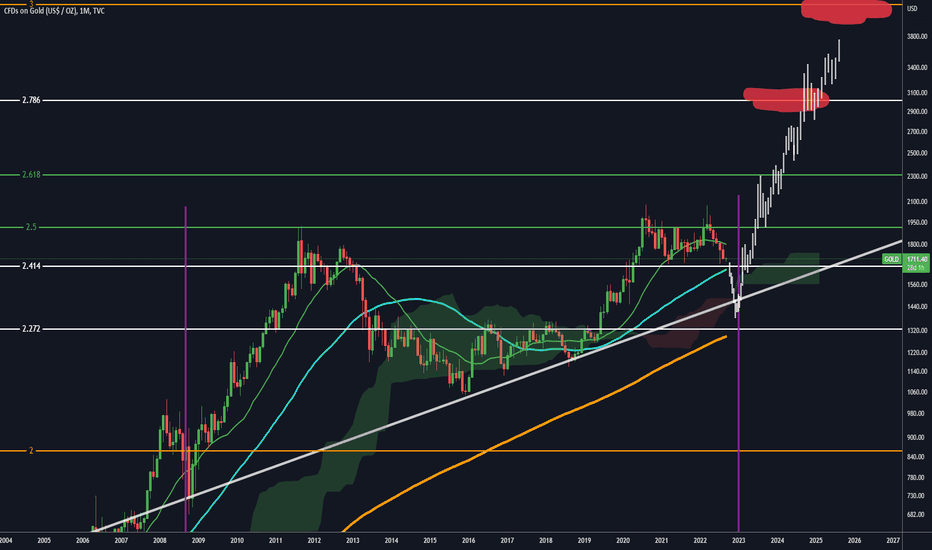
stocks and crypto will have a rise from the FED printing more to "save us from a depression" but that's BS and it will kill everyone in its path. good luck economy

Jack-Strainer
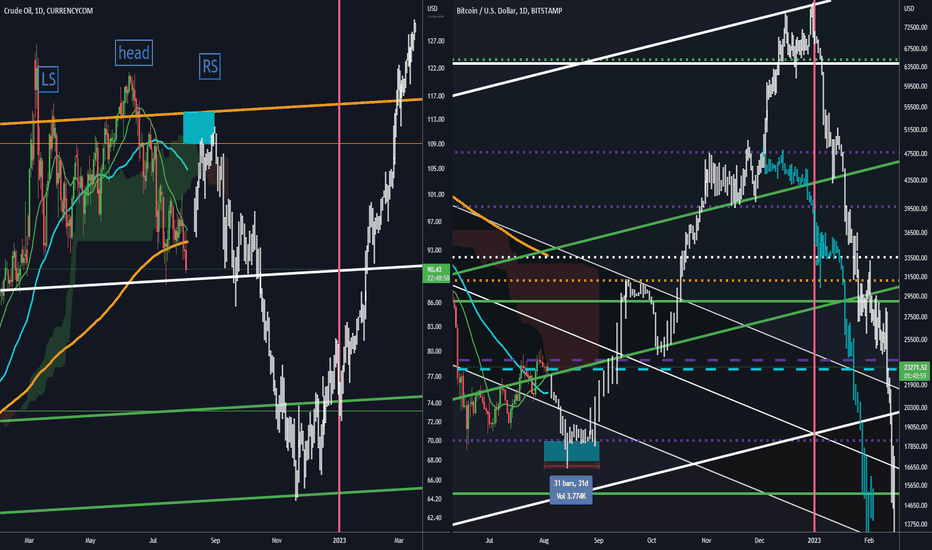
all of this will be disqualified if 18.2k breaks, im sure it wont. this month will end summer and with summer comes pain so this could be the last month of the bears good luckI wanted to wait for the day to close before showing you resistance, it just confirmed and its looking great for a fall. hope you guys are ready (:BTC/USD the weekly closed above 24k and this could be whats about to happen BUT i still don't like the TD 9 on the 1 M A 9 normally touches the most important support.... 22.5k isn't that strong. just staying cautious who knows really 22.5k could be it but I would put my cash on 18.2kI actually cant bet on a rise with a 12hr top so beautifully made add to that a TD 9 on the 1M

Jack-Strainer
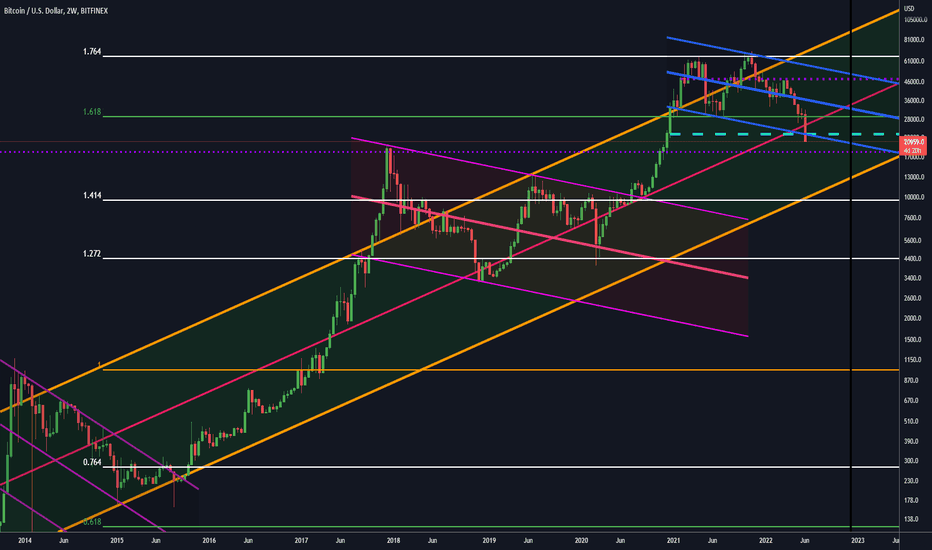
3 multi year bear channels (Purple, Pink, Blue) 1 long term channel from the beginning (Orange) We did break the blue channel with a few daily closes also the major announcement tomorrow from the FED will impact the market for sure I personally am not bearish even with all the blood on the streets -- the black line is 2023 -- I see 2023 as a really bad year... not now. with mass corp liquidations about, massively effecting the market lets not get fully scared yet... My Vision maybe this summer we see low volume PA and ugly charts. the rule is "sell in May go away", summer is the worst. lets see how this goes though. (I bet the only big liquidity will be corporations dumping trying to not get liquidated) looking at the chart now seems a bit crazy but if a depression or a recession was/is happening, the US wouldn't be warning the people about it. lets step back from the media for a second and stay zen. Bitcoin always proved it self long term so please don't get fed drama. stay true and strong 1 BTC = 1 BTC I personally see atls taking off (fighting the BTC chart) but time will tell stay safe, stay zen JackSremember $18,200 is last markets top (purple dots). breaking that with a weekly close would be extremely bad. gl be safenoiceeeeim calling a bottom @ 18.2k till after 2023nice 2nd touch

Jack-Strainer
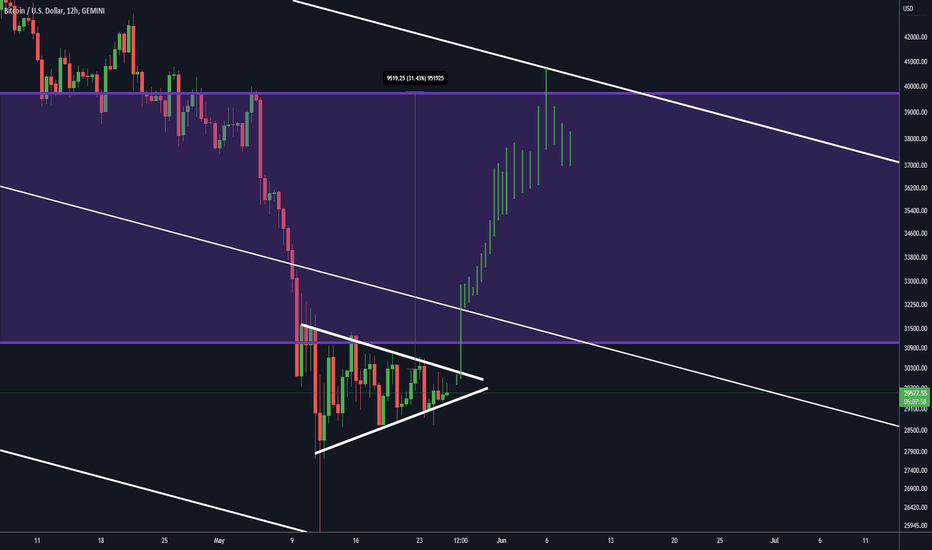
The weekly closed under 31k... if I followed my rules id have to go short but my gut tells me its all manipulated. With a break of the triangle we will see what direction it chooses to go, it feels like an up to me. You'll have to note how fast of a jump BTC will pull this off, if it happens before weeks end and the weekly climes back down under 31k and the week closes then I can be 99% sure well fall from there This could be the bottom but id like 40k to break first to officially be confident in that good luck, be safemy god BITCOIN DECIDE!!!!

Jack-Strainer
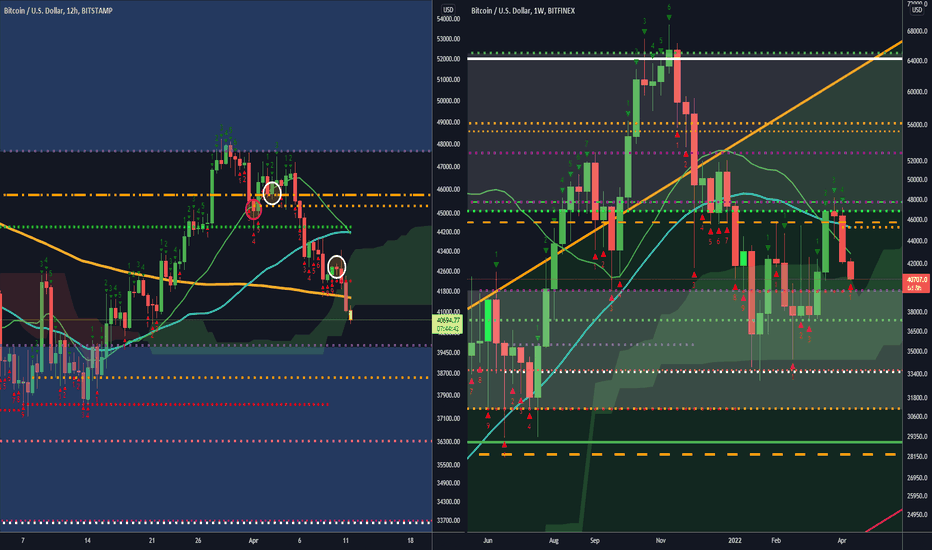
First thing I have to mention is my channels, the top one to be exact, these past two weeks while we were trying to breach the top channel I thought we broke it with a 46k + new support close but there's a strong line at 48k and the channel deceived me i updated the bottom of the channel to 48k and the top of that channel stays the same at 65k (: Left chart: with the start of the month; April 1st, new support came in at 8:30 UTC The pink/red circle is the newest resistance/support @ 45,300 (orange dots) It's pretty big also its really close to 46k aka the second strongest line (first strongest line is @ 34k) ( side note... this is just a thought but maybe this is a monthly play, monthly closes above 45.3k then dips to find monthly support with a pull back before months close..... just a thought) The white circles are the weekly closes….. The first weekly close looked good, closed on top of 46k + 45.3k then the weekly right after closed horribly @ 42.6k That close ruined everything Right chart: Weekly chart, hitting the top of the ichi cloud…. Really close to the top of the bottom channel This chart sadly shows a top made at the bottom of the top channel At the moment we're in and closed in no man zone (46k - 40k). I'd like to see a break of one of the channels before I pick a side…. And I mean a weekly close breach…. Sorry General: Look at these support lines @ 38.5k @ 36.3k @ 34k @ 31k Look to break these resistance lines @ 48k @ 53k @ 56.2k @ 65k + Because of the new line @ 45.3k I'm sure it will show strength+ I don't have much to say except state facts but this is documentation of how these lines fail too good luck be safethe D is holding up well, top of the channel still looks like support
Disclaimer
Any content and materials included in Sahmeto's website and official communication channels are a compilation of personal opinions and analyses and are not binding. They do not constitute any recommendation for buying, selling, entering or exiting the stock market and cryptocurrency market. Also, all news and analyses included in the website and channels are merely republished information from official and unofficial domestic and foreign sources, and it is obvious that users of the said content are responsible for following up and ensuring the authenticity and accuracy of the materials. Therefore, while disclaiming responsibility, it is declared that the responsibility for any decision-making, action, and potential profit and loss in the capital market and cryptocurrency market lies with the trader.