
Ivan3tt
@t_Ivan3tt

What symbols does the trader recommend buying?
Purchase History
پیام های تریدر
Filter
Ivan3tt
SHIB/USDT 1D. Current situation. Triangle. Breakout. Mems pump.

SHIBA INU/USDT 1D. Daily chart. Middleterm trend - horizontal channel. Price is now being in the support zone of this channel. Symmetrical triangle formed. Price now broke out the resistance of this triangle. Accumulating as for now. Other memes are pumping one after another. Those coins often pump before market local correction. This one highly connected with doge, as the main memcoin. This, as the one of the most liquid, will likely pump the last(for example, now LADYS is pumping). Triangle has been forming for more then 300 days. Now broke out. Price is a bit higher than the previous accumulation zone(2021), after which there was pump. This idea is mostly for price monitoring and understanding what's happening on the coin. It's also very important as to count with enormous pump from the bottom(ain't seen on the chart).
Ivan3tt
APTOS/USDT 1D. Cup forming. Phases. Target zones. Time zones.

Here's hype Aptos blockchain chart. When listed, dumped huge by about 71%. Similar as SUI for example now. After that - rocket pump for about 565%, showing "strength" of an instrument. After that pump, huge cup started to form, which is shown in this idea. 1st phase of this pattern - is descending in the downtrend trend channel. You may also call it ABC correction. After that, being in this channel - falling wedge started to form, which gave the beginning of the second phase of this big cup potentially(!). From the height price has corrected for about 85% of the impulse to the previously resistance of the local accumulation zone, which was also the first stop during the pump. We're now being in the second phase of this cup, which is - accumulation. Right now potential horizontal channel is forming. It's worth noting, that this can last for a very long time, so you should notice that. But, the plus is, that this asset is only the first cycle on market, so due to it, it might move very quickly(volatility), which can be used. As for now, the price of the Aptos is breaking above the falling wedge and forming potential bull-flag(consolidation in the form of a triangle after an impulse). Hence - if the price breaks above this local triangle - the target zone will be the amount of the previous impulse which is about 82%. I have marked the potential targets zone on chart. As a bonus, i have also pointed the approximate time zone of each next phase of a cup potentially: 1) 3d phase is rise towards the resistance of the cup, which is firstly 12$ zone, then - 20,4$ zone. This could happen somewhere in the spring 2024(april-june). 2) After that - next phase, which is the 4th one - breakout of cup and rise, which falls approximately on Fall 2024 in the date somewhere of october-november 2024(as altcoins local season right now). As for now, the price is between 2 zones - support zone, which previously acted as the resistance, and the resistance local zone, which previously acted as support, this two zones form the channel, which the price is currently in right now. Until we're walking in this channel - we might still see the move somewhere to the middle of the channel or even it's bottom part, to retest the broken falling wedge. Might even be the false breakout downwards if the market sees capitulation at the moment. Yet, it's likely to be bought out quite quickly. As to that matter, you might even use this period(somewhere about january-february potentially), if it will occurs, or just skip it and stay calm(don't react). If price breaks the resistance - it might move to the next resistance zone, after which it's very likely to see the pullback(mention timezone above), after which rising to the resistance of the cup. In that case - very beautiful cup will be formed, which is very good for the manipulator(people will see that cup). After that, the price might see the movement to somewhere about 60-100$ zone approximately. Better make the update later with the clear targets. But those are the approximate milestones of this cup. The volume is now seeing the compression, which can be observed on the volume indicator.
Ivan3tt
BTC/USD 1M. Monthly chart. Global trend

Here's the global - main - trend of Bitcoin from the Bitstamp chart. We see a channel forming here. Now Bitcoin is near the support zone. All the main details by my view are shown on the chart. Still not all the details, not to make the chart messy. Locally(from the perspective of the monthly chart) we see a down trendline forming here(orange). We can potentially reach and broke this trendline in the near future. If we don't break it now - our potential then the nearest monthly support level, which is 13880$. Still. If we break this local downtrend we can reach the monthly resistance zone which is 38500-45500$(shown on the chart). The POC of all distribution of 2021 is around 36000$. So this same zone might be the medium of the potential future distribution. Eventually, we are still to reach 13880 support zone in my opinion. Also, if you pay attention, the same price movement that was in 2017, when we reached 20k$, might happen this time also, but this time in the other side. It's be a squeez from the support of the channel down. Exactly the same percent down, as it was up in 2017, is precisely the 13880$ level. You can check it by yourself. So there are basically 2 main scenarios - break of a trendline and reach of 38-45k$ zone. Or not break of a trendline and then we reach at least 13880$. Everything is quite simple.
Ivan3tt
BAL/USDT 1D. Balancer. Interesant moneten.
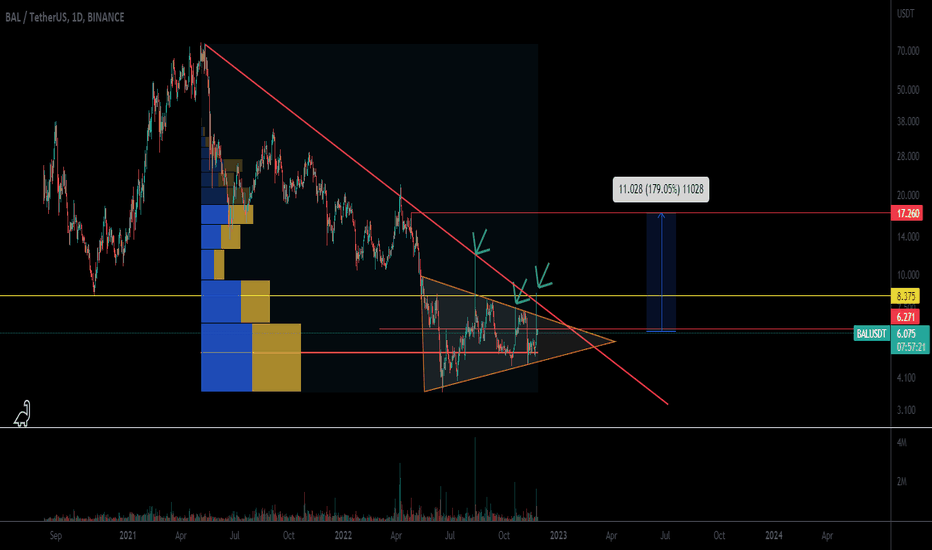
Baal was a title and honorific meaning "owner", "lord" in the Northwest Semitic languages spoken in the Levant during antiquity. From its use among people, it came to be applied to gods. Definition from Wiki. Interesting coin, named after a god. Pay attention to the volume coming in(shown on the chart). In the secondary trend the downtrend has formed(red line on chart). The price is currently under the support(yellow line). Now it acts as resistance. Locally some form of triangle forming(the price is tightening). As the classic for the alts the target may be aroung 180%. Also pay attention to the current zone - it's 666 zone(6.66). Taking in consideration the big volume spikes(and price spikes) we can see a good move forward.
Disclaimer
Any content and materials included in Sahmeto's website and official communication channels are a compilation of personal opinions and analyses and are not binding. They do not constitute any recommendation for buying, selling, entering or exiting the stock market and cryptocurrency market. Also, all news and analyses included in the website and channels are merely republished information from official and unofficial domestic and foreign sources, and it is obvious that users of the said content are responsible for following up and ensuring the authenticity and accuracy of the materials. Therefore, while disclaiming responsibility, it is declared that the responsibility for any decision-making, action, and potential profit and loss in the capital market and cryptocurrency market lies with the trader.