
Houmani
@t_Houmani

What symbols does the trader recommend buying?
Purchase History
پیام های تریدر
Filter
Signal Type
Houmani
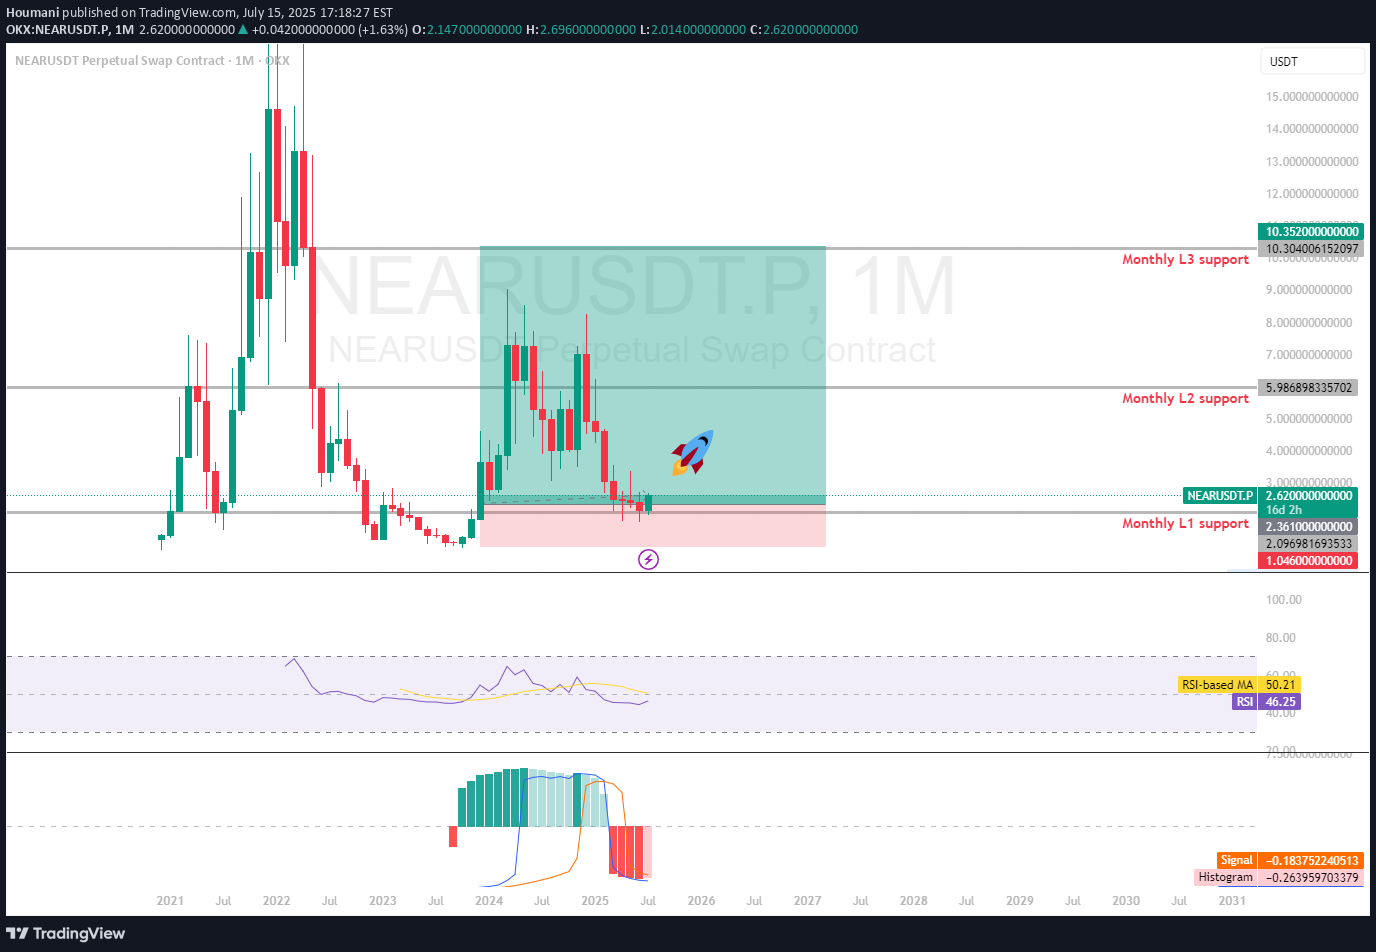
NEAR Protocol has just broken above the Monthly L1 resistance at $2.361, signaling a possible long-term bullish reversal. With strong price momentum, eyes are now set on the next major levels ahead. 🔍 Technical Breakdown: Monthly L1 at $2.361 has been decisively broken with volume. Clean structure forming higher lows since local bottom. Bullish structure emerging on higher timeframes. 🎯 Upside Targets: Target 1 – Monthly L2: $5.9868 (mid-term resistance zone) Target 2 – Monthly L3: $10.30 (macro resistance, historical supply zone) 🛡️ Key Support Zones: Retest of $2.36 could offer a high-R/R entry if bullish momentum holds. Maintain bullish bias above $2.00 – invalidation below this level on high timeframes. 📈 Momentum picking up — if volume sustains and BTC remains steady, NEAR could be setting up for a larger trend continuation.
Houmani
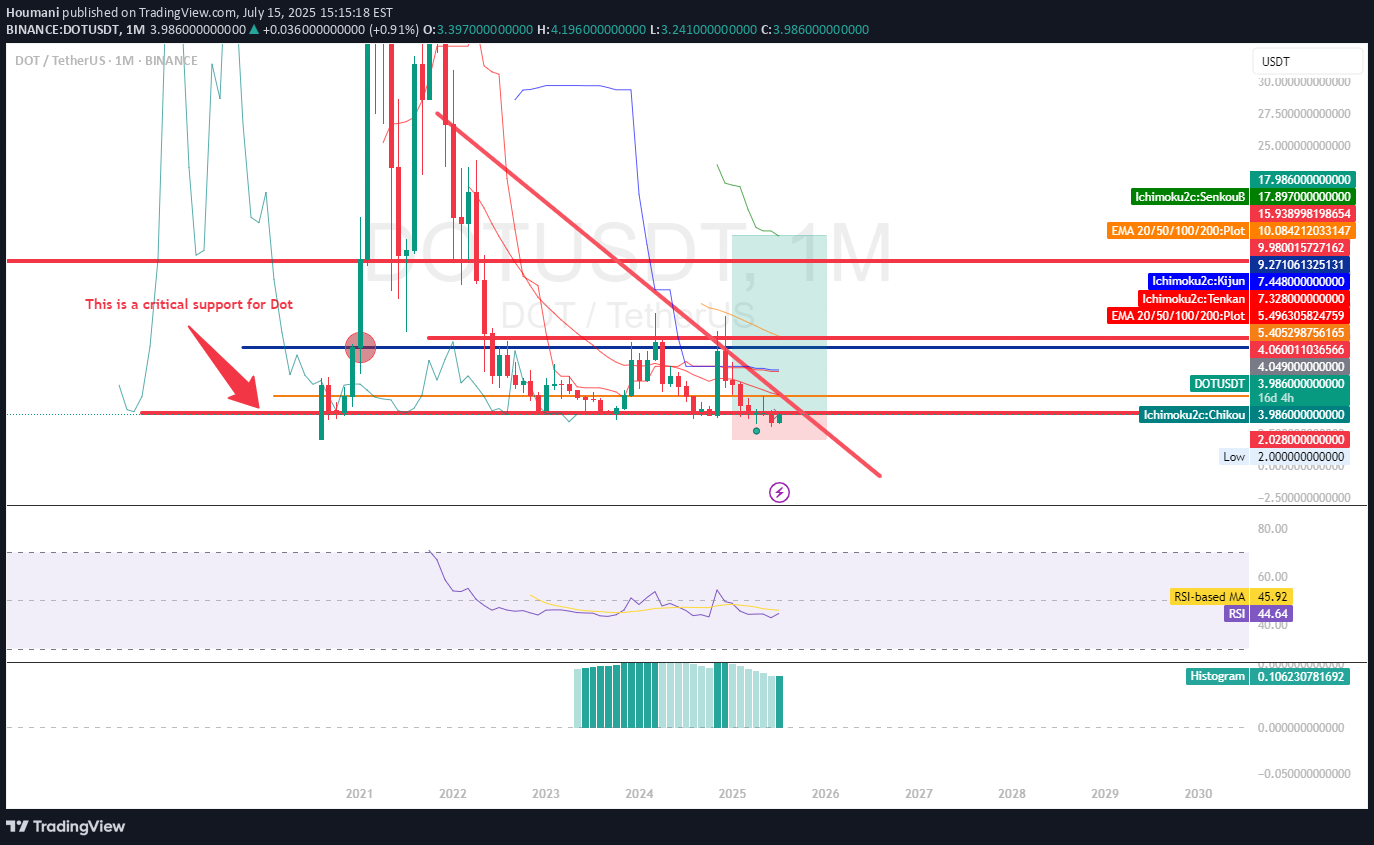
Polkadot (DOT) is forming a solid base and is now approaching a key resistance zone around $3.98. A clean breakout above this level could mark the start of a bullish reversal. 🔍 Technical Setup: DOT is consolidating near resistance after a prolonged downtrend. Breakout above $3.98 signals strength, possibly confirming a trend shift. Volume spike and higher lows suggest accumulation. 🎯 Bullish Targets Post-Breakout: TP1: $5.00 (psychological + structural level) TP2: $10.00 (mid-range consolidation zone) TP3: $15.00 (macro resistance, potential long-term play) 🛡️ Support to watch on pullbacks: $3.50–$3.60 zone. Bias: Bullish above $3.98 Invalidation: Close below $3.50 with volume Keep an eye on the breakout confirmation with volume and candle structure. DOT might be gearing up for a larger move if the market sentiment aligns.
Houmani
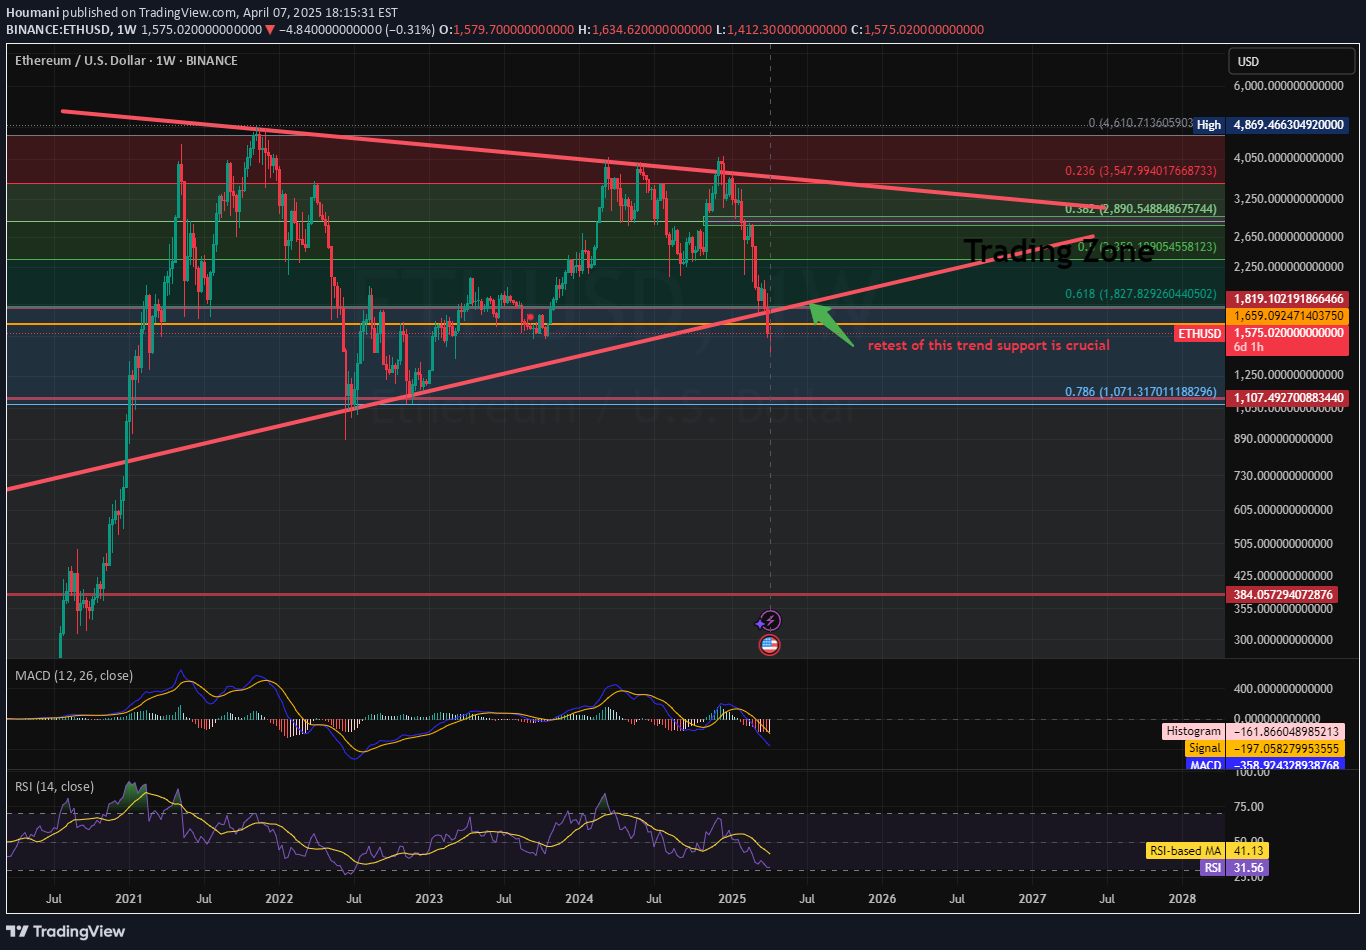
I believe that this might be a start of a bearish movement.Weekly candle closing below the 1660 USD is an indication of a start of a down trend for Ethereum and the next important level would be around the 1100 - 890 USD.I recommend waiting on the monthly candle closure to confirm the above statement. It is always possible that this is a fake break out and Eth can recover from here (again on a monthly observation).Let us wait for now
Houmani
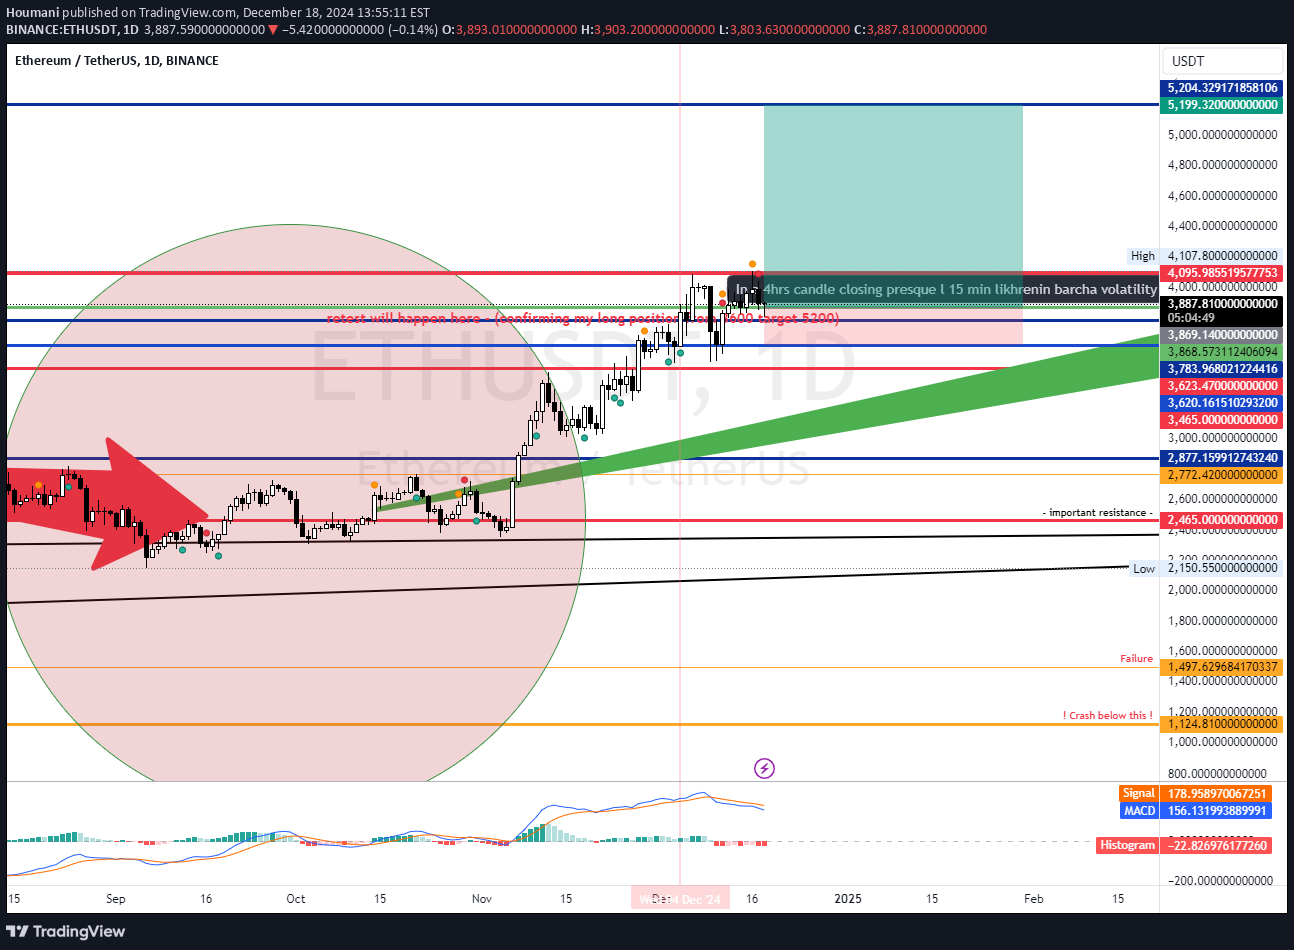
Here is the final chance to catch the Eth bull run and new ATH.Confirming with a 4hrs candle the closure about the 3868 USD. This is a pretty solid indicator of the 30% upwards movement that Eth is about to finish. Use this Scalping at your own risk. I am continuing my holdings on Eth as per my previous posts
Houmani

📈 LTC Breakout Alert: 🚀 On the Verge of Something BigLitecoin (LTC) is showing exciting signals, and the charts are speaking volumes! Here's why you should pay attention:🔹 Current SetupResistance at $94: LTC has been consolidating beneath this critical resistance level, forming what appears to be a classic rising flag pattern.Historically, Litecoin's price action has respected these technical setups, often leading to explosive moves.🔹 Historical ContextPrevious ATH: Back in 2017, LTC hit its all-time high of $375 before retracing. While it reached a second peak near $410 during the 2021 bull run, it has since pulled back, leaving significant room for upside.With its halving now behind us and the broader market trending upward, LTC is poised for another major move.🔹 Bullish MomentumThe $94 resistance is being tested repeatedly, indicating that sellers are running out of steam. A breakout above this level would validate the rising flag pattern.If confirmed, LTC's measured move could project a 3x target in the range of $270–$300, aligning with historical resistance zones.🔹 Why Litecoin?Known as the "silver to Bitcoin's gold," LTC often follows BTC’s movements but with higher volatility, making it an attractive choice for traders.Its strong fundamentals, including adoption and utility in payments, continue to strengthen its long-term outlook.🚀 What’s Next?A clean break above $94 with strong volume could ignite the rally.Immediate resistance levels to watch after the breakout: $130, $170, and then $250–$300.Stay sharp and prepared. This could be the start of LTC's next significant run! 🌟
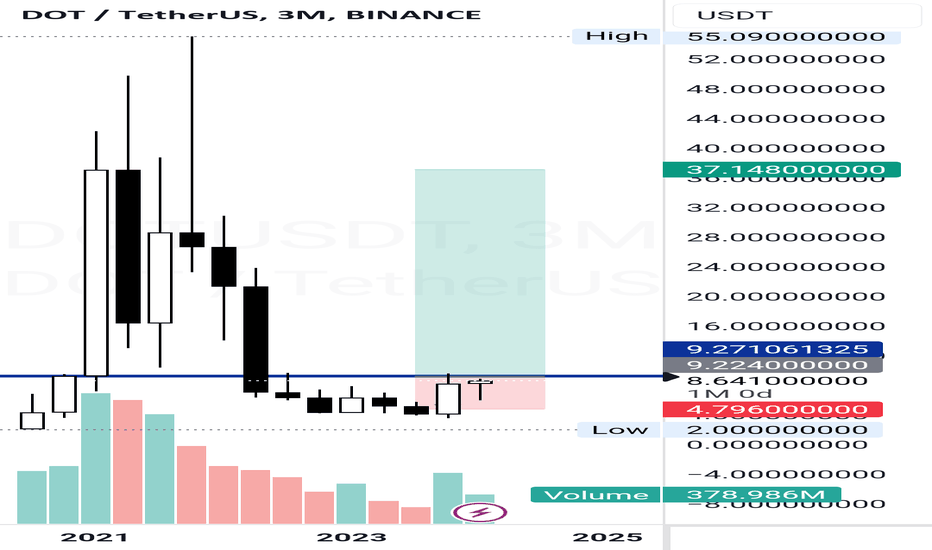
Houmani
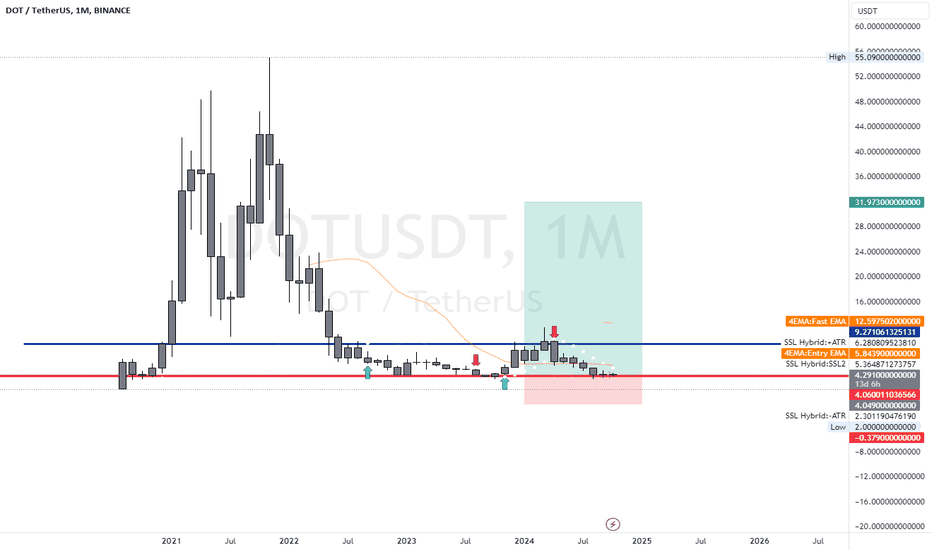
DOT/UST has successfully held above the monthly support level at $4.06, indicating a strong defense of this critical zone. The recent formation of a bullish reversal candle suggests a potential trend reversal, with price action signaling upward momentum. This pattern, combined with sustained support, hints at a breakout scenario, possibly leading to a significant upward move.Key technical indicators, such as volume spikes, RSI divergence, or MACD bullish crossovers, could further confirm the strength of this reversal. A breach of the immediate resistance levels may signal the beginning of a new uptrend, potentially accelerating the rally. DOT appears poised for an upward breakout—momentum is building for a substantial move.
Houmani
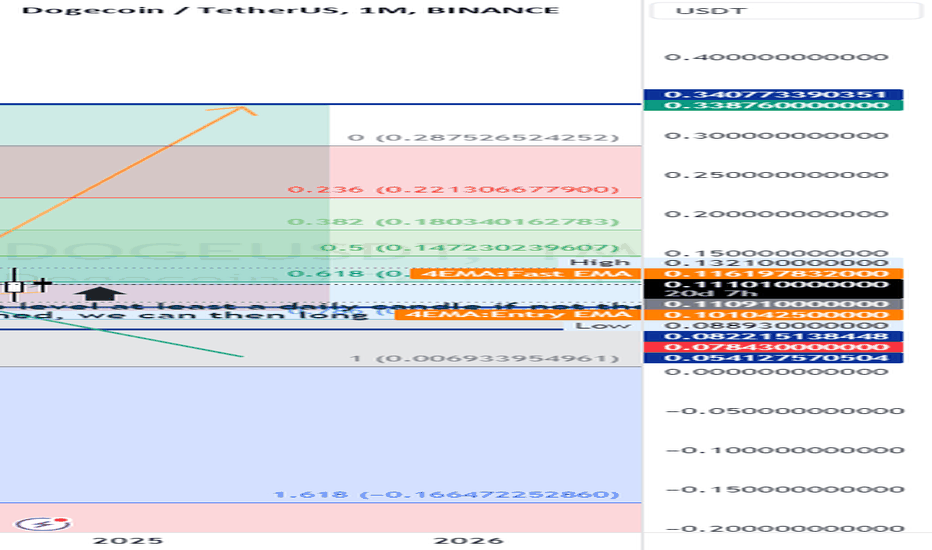
Dogecoin is poised for a breakout as it approaches a critical technical level, the Fibonacci 0.618 retracement. A successful breach of this resistance could ignite a significant bullish rally, with potential for exponential price action. Traders should watch closely for confirmation signals as we could witness strong upward momentum and increased market volatility.
Houmani
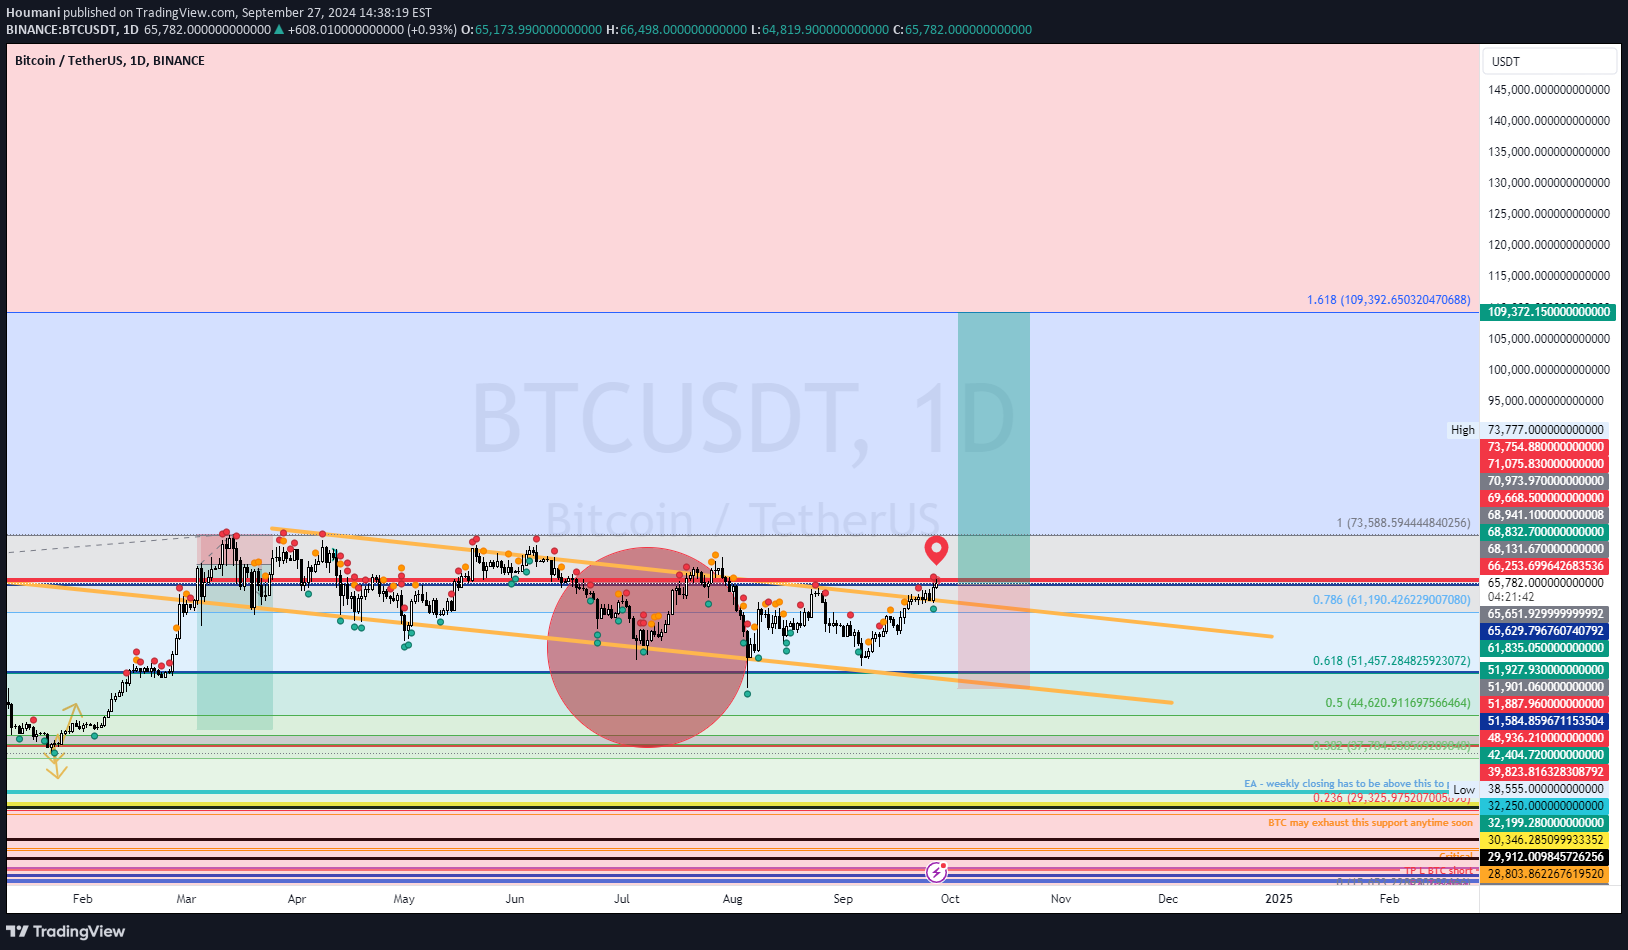
If Bitcoin (BTC) can successfully break through the resistance level at $66,253 and maintain a weekly close above this threshold, we can anticipate a significant rally towards the $100,000 mark. This breakout would indicate strong bullish momentum, potentially attracting more investors and driving prices higher.
Houmani
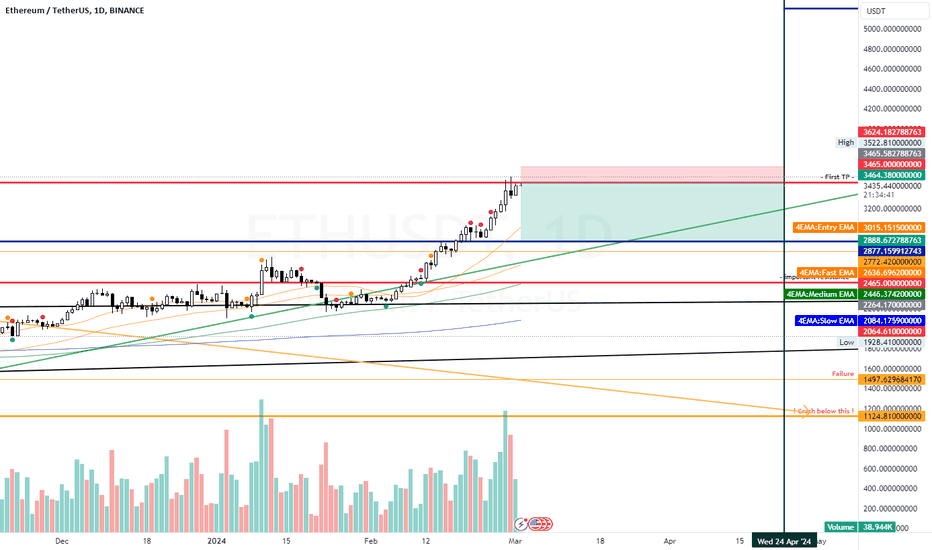
Despite the over all picture of Etherium being bullish (check out my previous post), I think it would be a normal behavior for Eth to get back and revisit the ~ $2877 support level.
Disclaimer
Any content and materials included in Sahmeto's website and official communication channels are a compilation of personal opinions and analyses and are not binding. They do not constitute any recommendation for buying, selling, entering or exiting the stock market and cryptocurrency market. Also, all news and analyses included in the website and channels are merely republished information from official and unofficial domestic and foreign sources, and it is obvious that users of the said content are responsible for following up and ensuring the authenticity and accuracy of the materials. Therefore, while disclaiming responsibility, it is declared that the responsibility for any decision-making, action, and potential profit and loss in the capital market and cryptocurrency market lies with the trader.