
HoneySophy
@t_HoneySophy

What symbols does the trader recommend buying?
Purchase History
پیام های تریدر
Filter
Signal Type
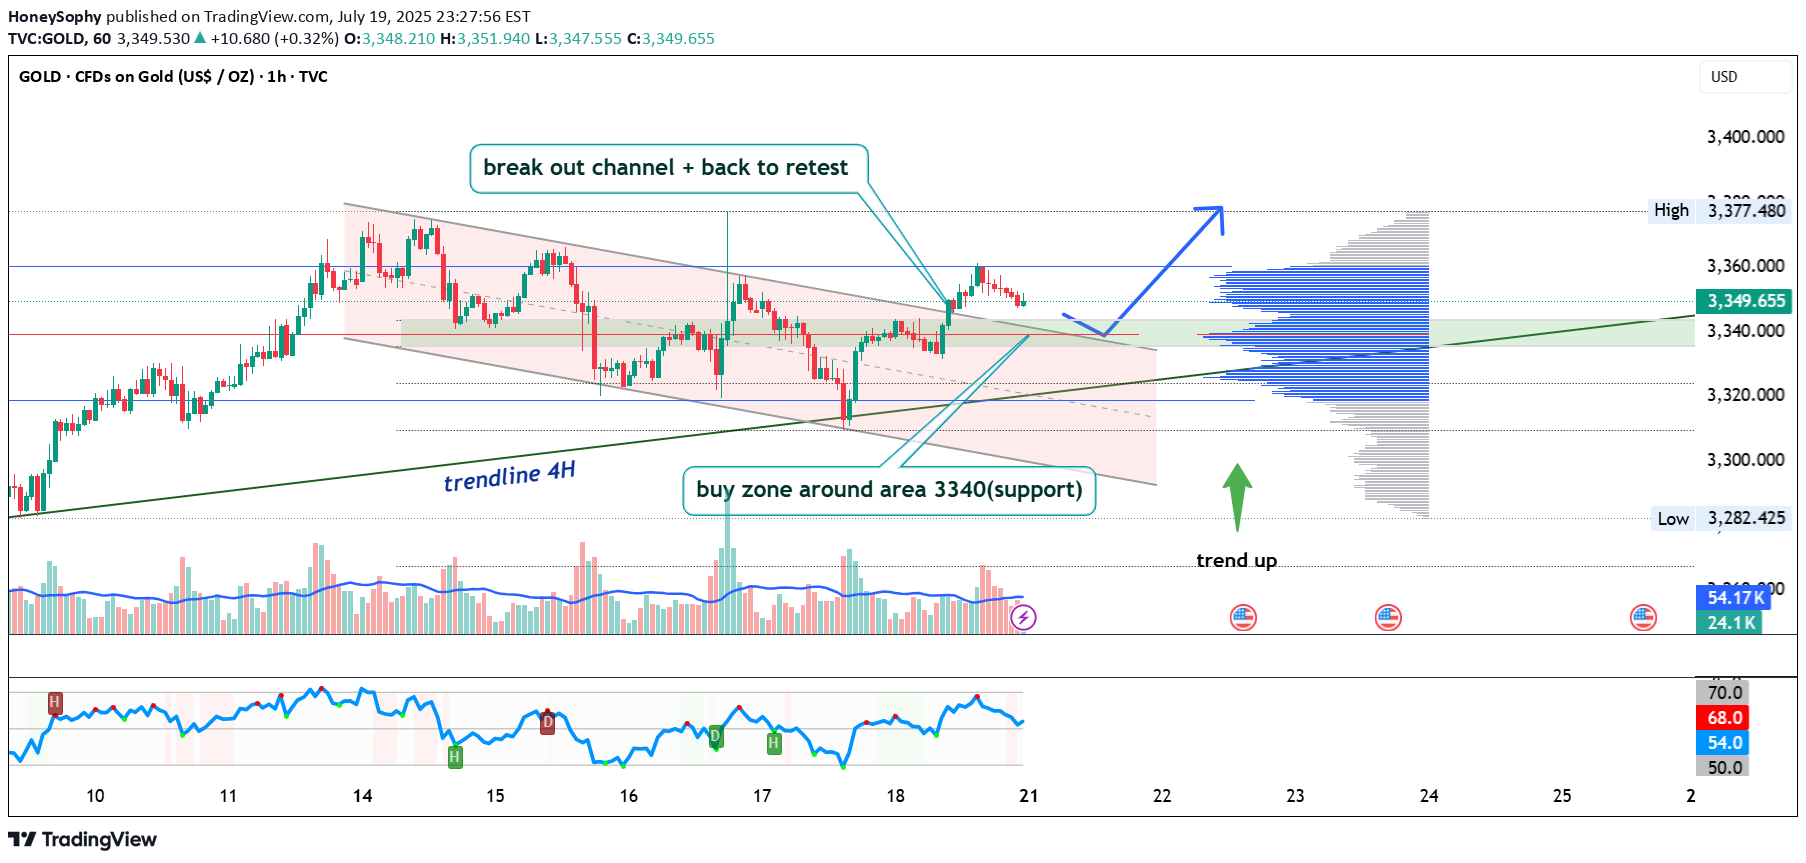
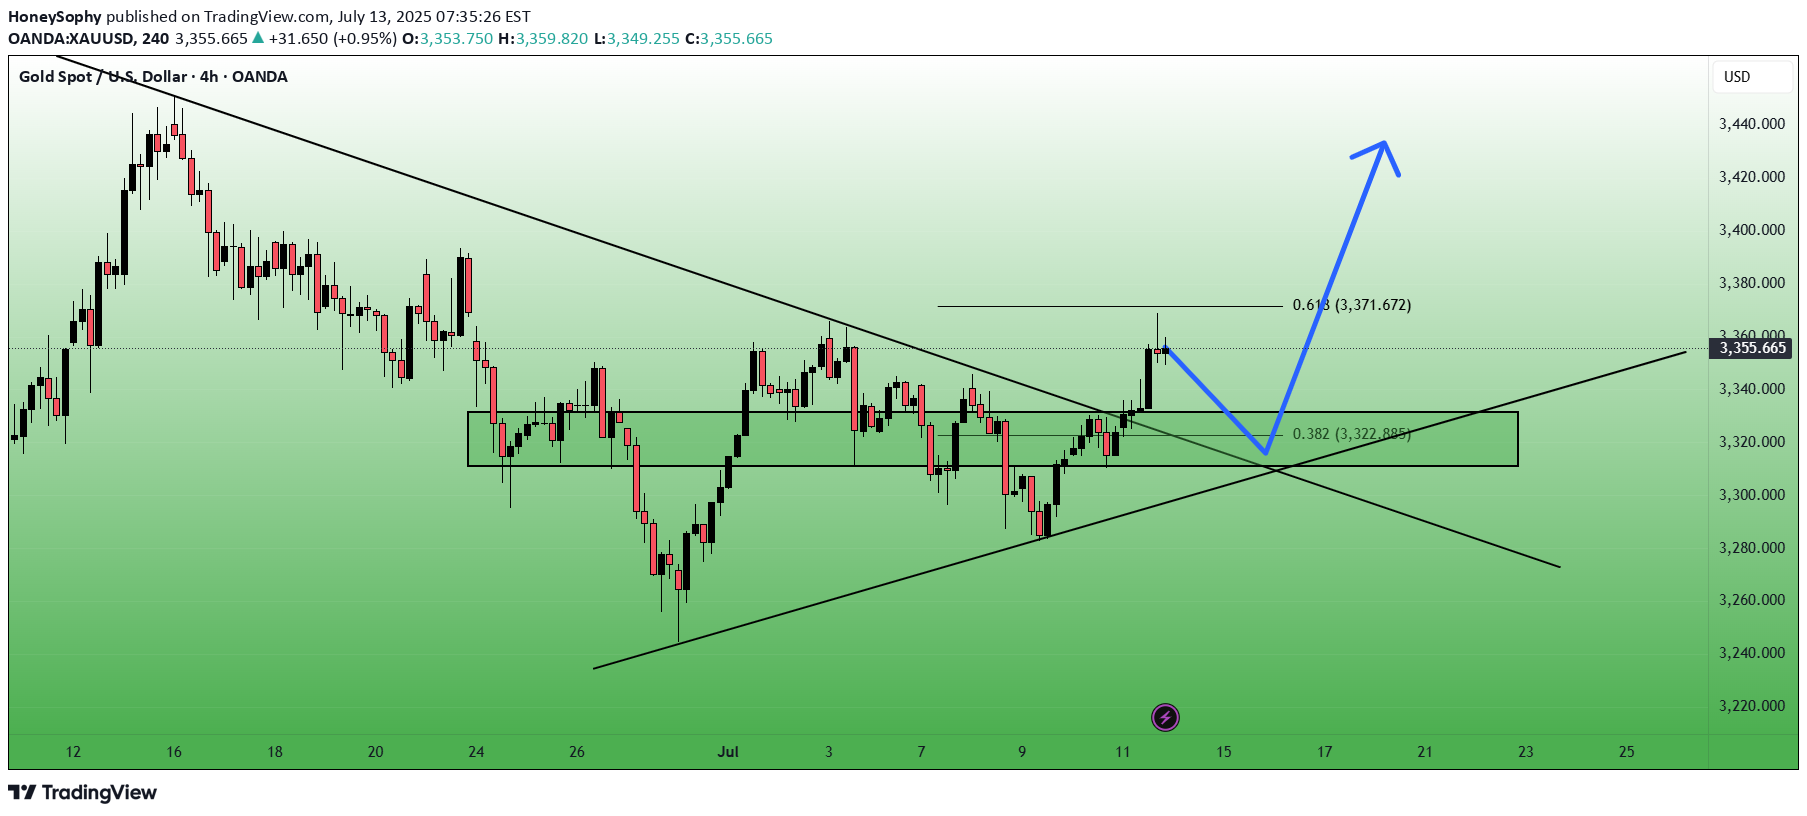
After breaking out of the falling channel, gold is currently retesting its upper boundary — now acting as support. The 3340 zone is particularly important as it aligns with the 0.618 Fibonacci level and high volume node on the visible range volume profile. The price action suggests a potential bullish rejection from this area. With both the 50 and 200 EMA below price on the 1H, the short-term trend remains bullish. The 4H trendline further supports this setup. RSI is cooling off near the neutral zone, leaving room for another leg higher toward the 3377 resistance zone. If 3340 fails, 3324 (0.786 Fibo) becomes the next line of defense. Until then, the structure remains bullish following the successful breakout and retest of the channel.Our goal for this week is to achieve a profit of at least 300%. This means that if you have an account of 10k, your profit for this week will exceed 30k. If you don't believe that I can achieve this goal, you can provide me with a demo account. I will then connect it to my main account. You can observe how I accomplished a 300% profit step by step. Click the link below to join us: t.me/+X7OWgK6GMTVjZTNk
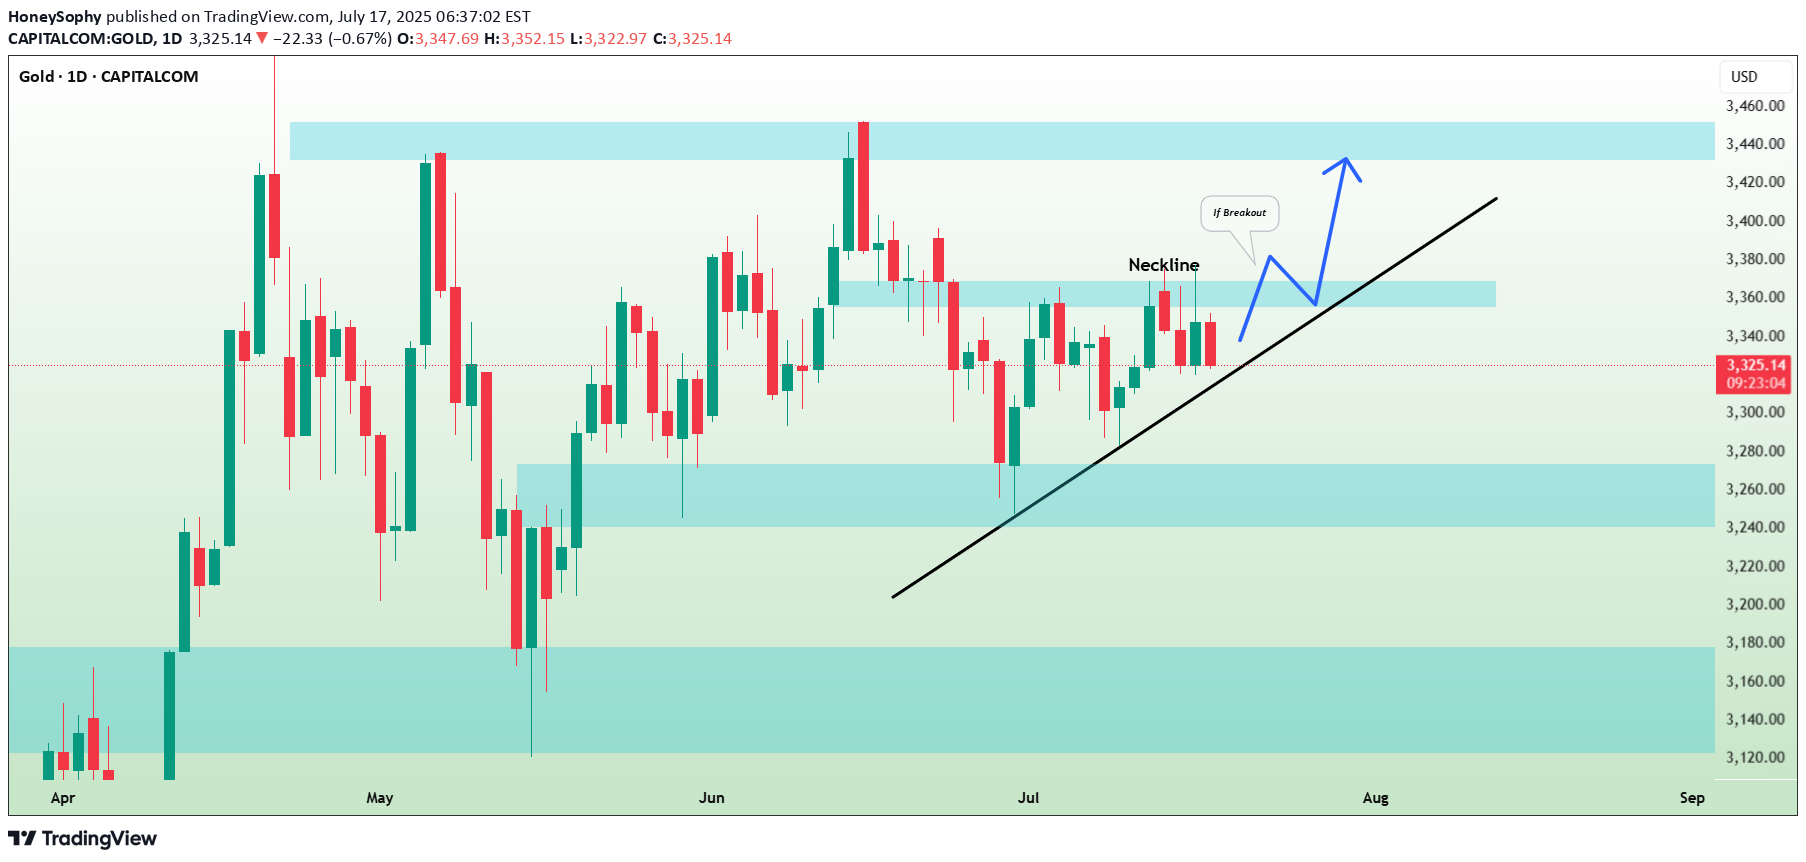
I spotted a clear ascending triangle pattern on a daily time frame. To validate a bullish continuation, we need a breakout above the neckline. A daily candle close above 3370 will serve as a strong confirmation, and we can expect a move up to at least the 3440 resistance level.Our goal for this week is to achieve a profit of at least 300%. This means that if you have an account of 10k, your profit for this week will exceed 30k. If you don't believe that I can achieve this goal, you can provide me with a demo account. I will then connect it to my main account. You can observe how I accomplished a 300% profit step by step. Click the link below to join us: t.me/+X7OWgK6GMTVjZTNk
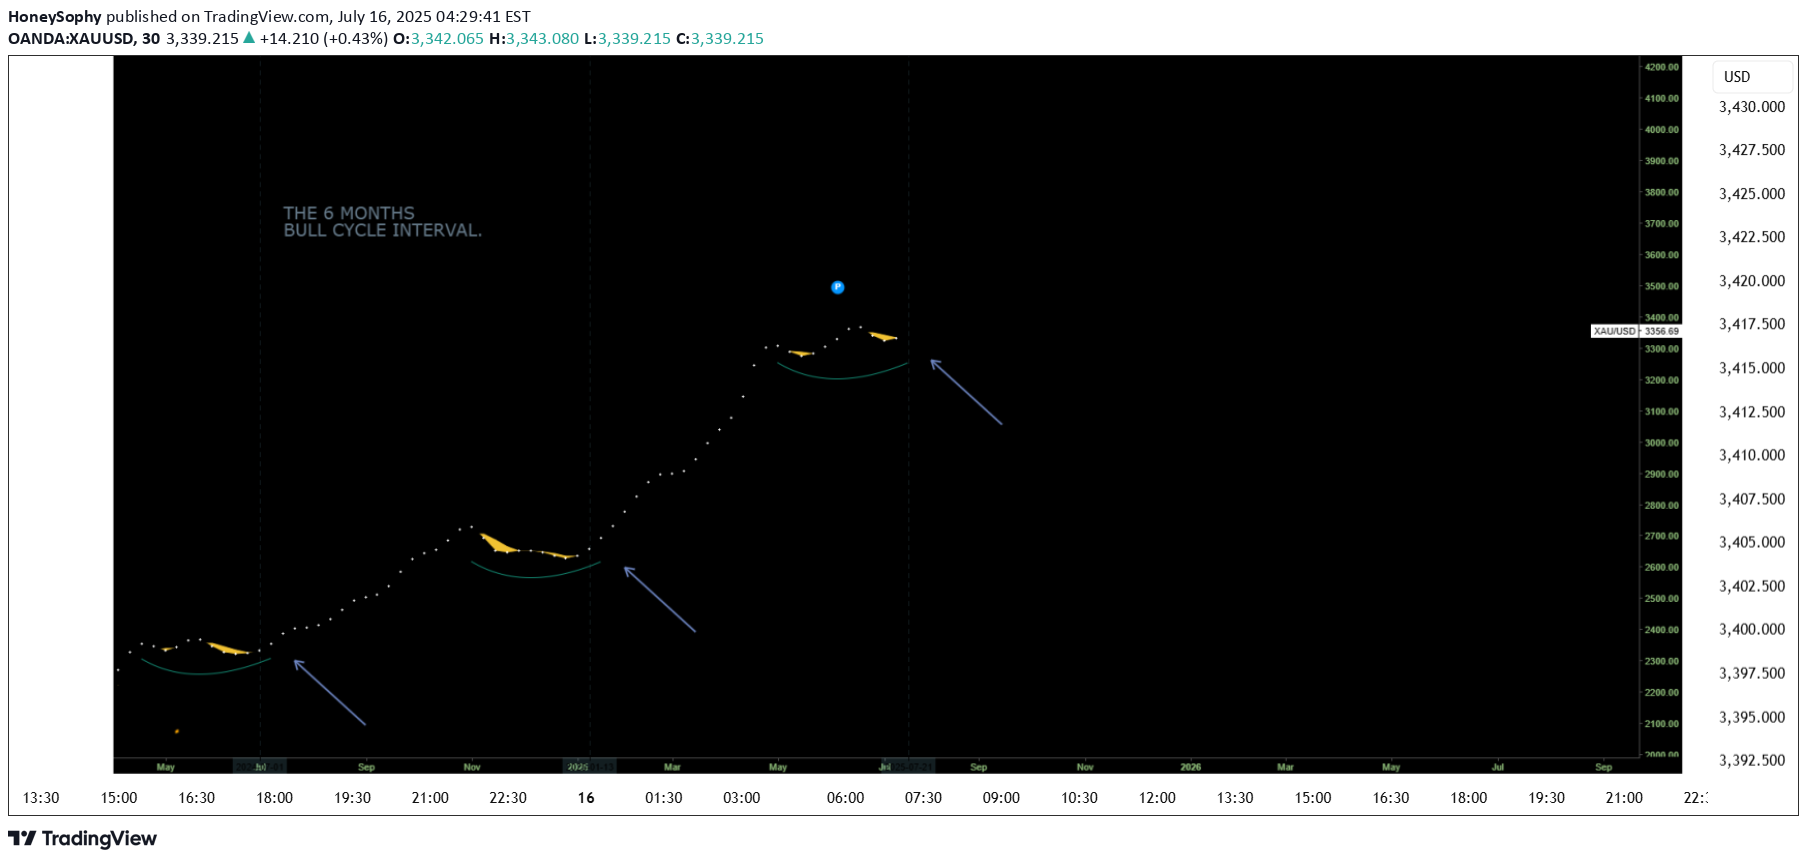
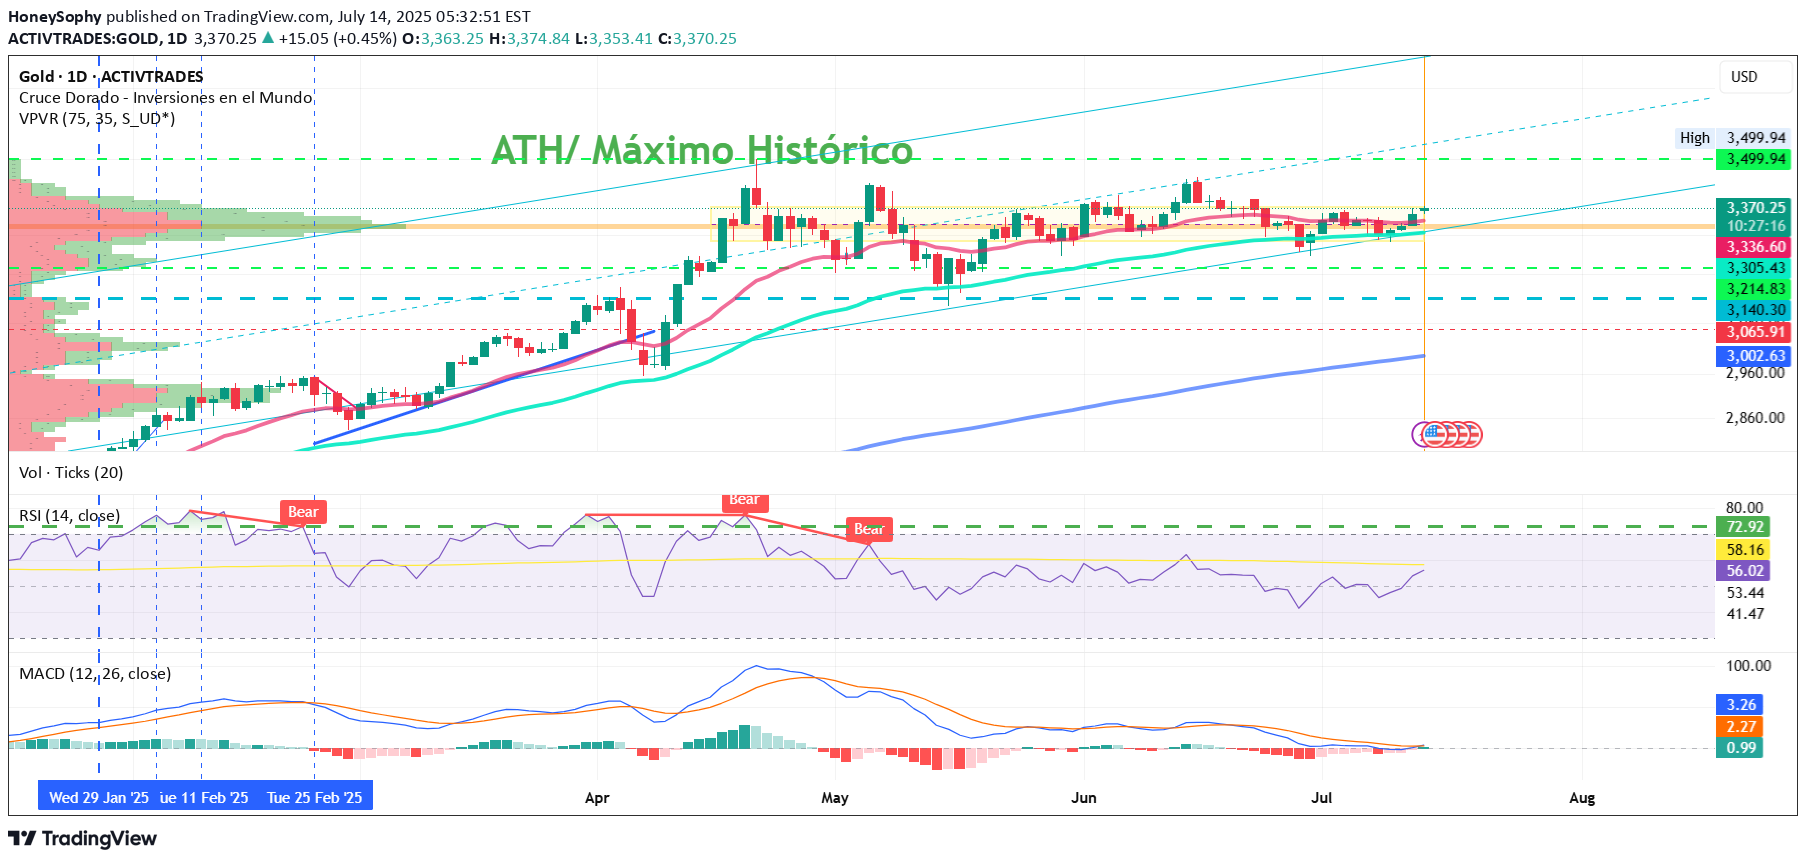
GOLD, has been on a consistent ascend since 2k levels hitting a series of ATH taps week after week. As with any parabolic event -- a trim down is warranted. After hitting its ATH zone at 3500, gold significantly corrected back to 38.2 fib levels at 3100 area. 38.2 fib levels has been acting as a strong support for GOLD for quite a bit and as expected buyers has started to converge and positioned themselves back again for that upside continuation -- long term. After hitting this fib key level gold has been making consistent higher lows on the daily conveying clear intentions on its directional narrative -- to go NORTH. As of this present, July 2025, GOLD has seen renewed elevation in momentum metrics signifying definitive blueprint towards its next upside move. Based on our diagram above. WE have now entered a new bull cycle that only transpires every 6 months. The last cycles happened on July 2024, January 2025, then presently July 2025 which is in progress. This is very special as we dont get to see this bullish setup on a regular basis. Ideal seeding zone is at the current range of 3300-3350. Mid-Long Term Target at 3400Our goal for this week is to achieve a profit of at least 300%. This means that if you have an account of 10k, your profit for this week will exceed 30k. If you don't believe that I can achieve this goal, you can provide me with a demo account. I will then connect it to my main account. You can observe how I accomplished a 300% profit step by step. Click the link below to join us: t.me/+j_WIZ69yPpAzNWRk
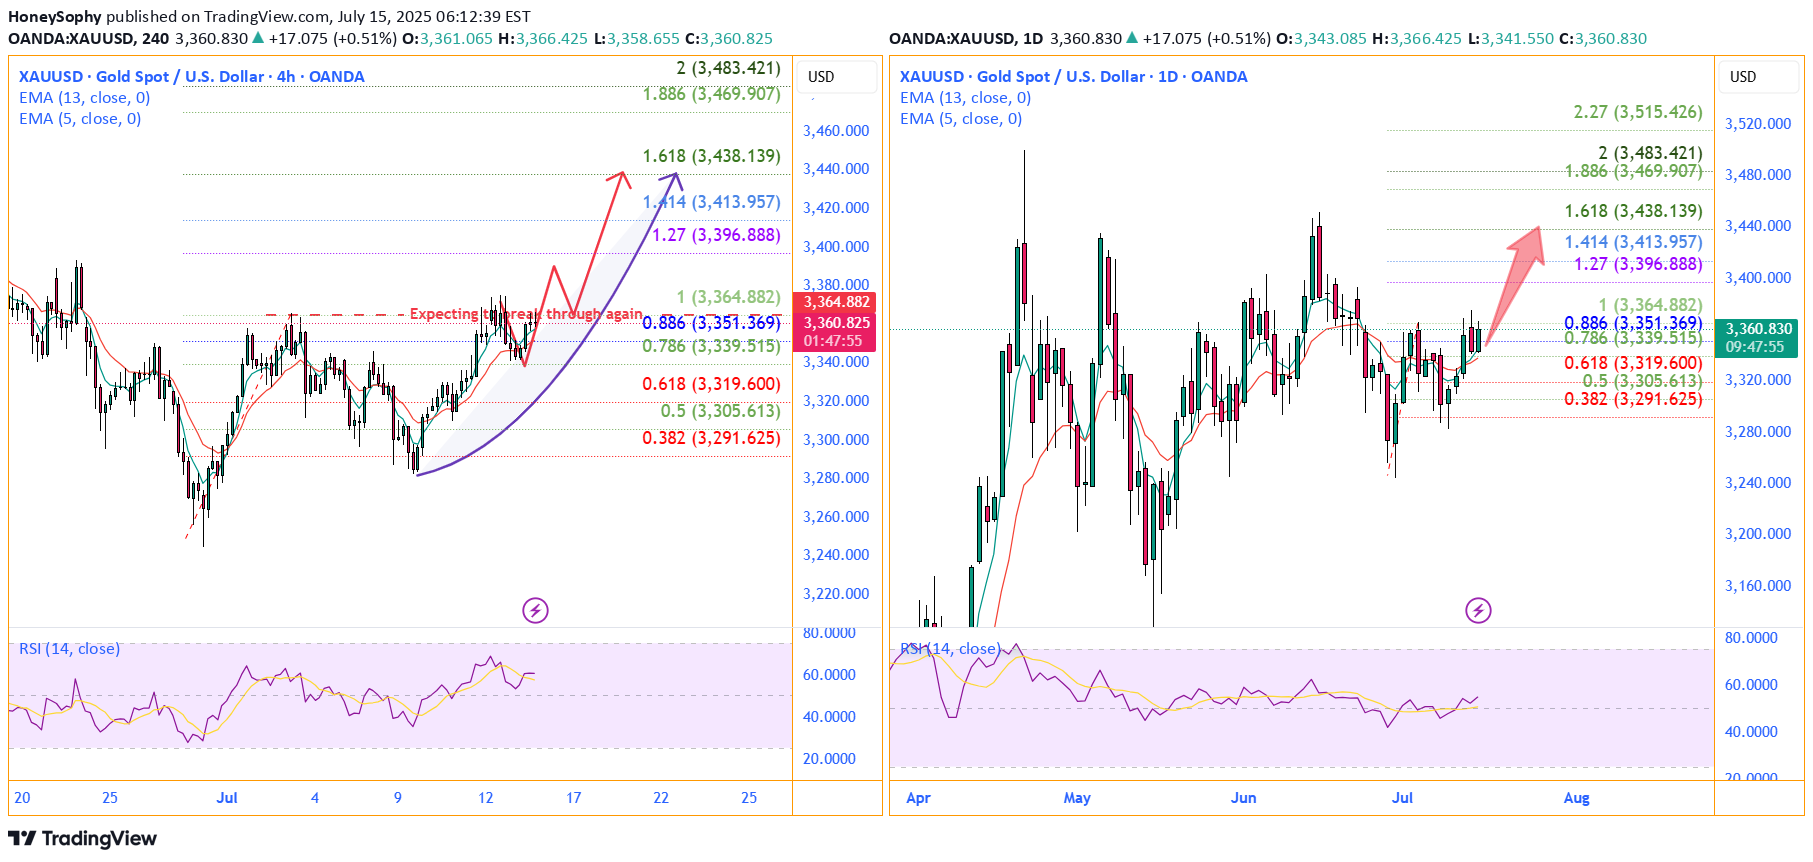
Gold has returned back above EMAs on daily chart. On 4h chart, there is a chance for it to break through last top level to make a new high up to 3438 . Take a good use liquidity of CPI of US today. You could get a great result of that.Our goal for this week is to achieve a profit of at least 300%. This means that if you have an account of 10k, your profit for this week will exceed 30k. If you don't believe that I can achieve this goal, you can provide me with a demo account. I will then connect it to my main account. You can observe how I accomplished a 300% profit step by step. Click the link below to join us: t.me/+X7OWgK6GMTVjZTNk
Gold posted a slight gain during Monday's Asian session, driven by renewed safe-haven demand amid escalating trade tensions between the United States and several key economies, as well as rising geopolitical uncertainty surrounding Russia and Ukraine. The initial uptick in gold was supported by the announcement of 30% tariffs by Donald Trump on Mexico and the European Union, in addition to harsher levies on Japan, South Korea, and Brazil. The prospect of a renewed wave of protectionism has raised concerns over global economic stability, boosting gold's appeal as a safe-haven asset. Added to this is geopolitical tension following reports that Trump is planning to send offensive weapons to Ukraine, potentially escalating the conflict with Russia. These factors have reinforced risk-off sentiment in the markets. However, the strength of the US dollar (DXY +0.1%) and anticipation ahead of the US CPI data, due Tuesday, are capping gold’s upside. Higher-than-expected inflation could reinforce expectations of a tighter monetary policy from the Federal Reserve, which would weigh on precious metals. After reaching an intraday high of $3,361.42 per ounce, the Asian market closed lower, leaving gold at $3,356.66 per ounce, a level at which it has since consolidated ahead of the European open. This behavior reflects a technical pause in the initial bullish momentum, with the current point of control aligning with that same price zone, suggesting a temporary neutralization of buying pressure. The RSI at 54% confirms a lack of strength, while the MACD indicates a potential upward directional shift with a signal line crossover and a modestly green histogram to start the week. Moving average crossovers show the 50 and 100 SMAs supporting the bullish push that began last Wednesday. Gold’s next decisive move may depend on upcoming US inflation data and developments in geopolitical tensions. Silver, meanwhile, stood out with a sharp 1.4% surge to $39.493 per ounce, its highest level since 2011, while platinum and copper delivered mixed performances. This week, gold prices could be driven by the confirmation of elevated US inflation data, which would strengthen the metal's role as a hedge against purchasing power loss, especially if doubts persist regarding the Fed’s policy stance. Added to this are rising geopolitical tensions due to Trump’s potential delivery of offensive weapons to Ukraine, further protectionist measures that could worsen the global trade war, and increased risk aversion should equity markets react negatively. In this context, gold is positioned as one of the main beneficiaries amid growing economic and political uncertainty.
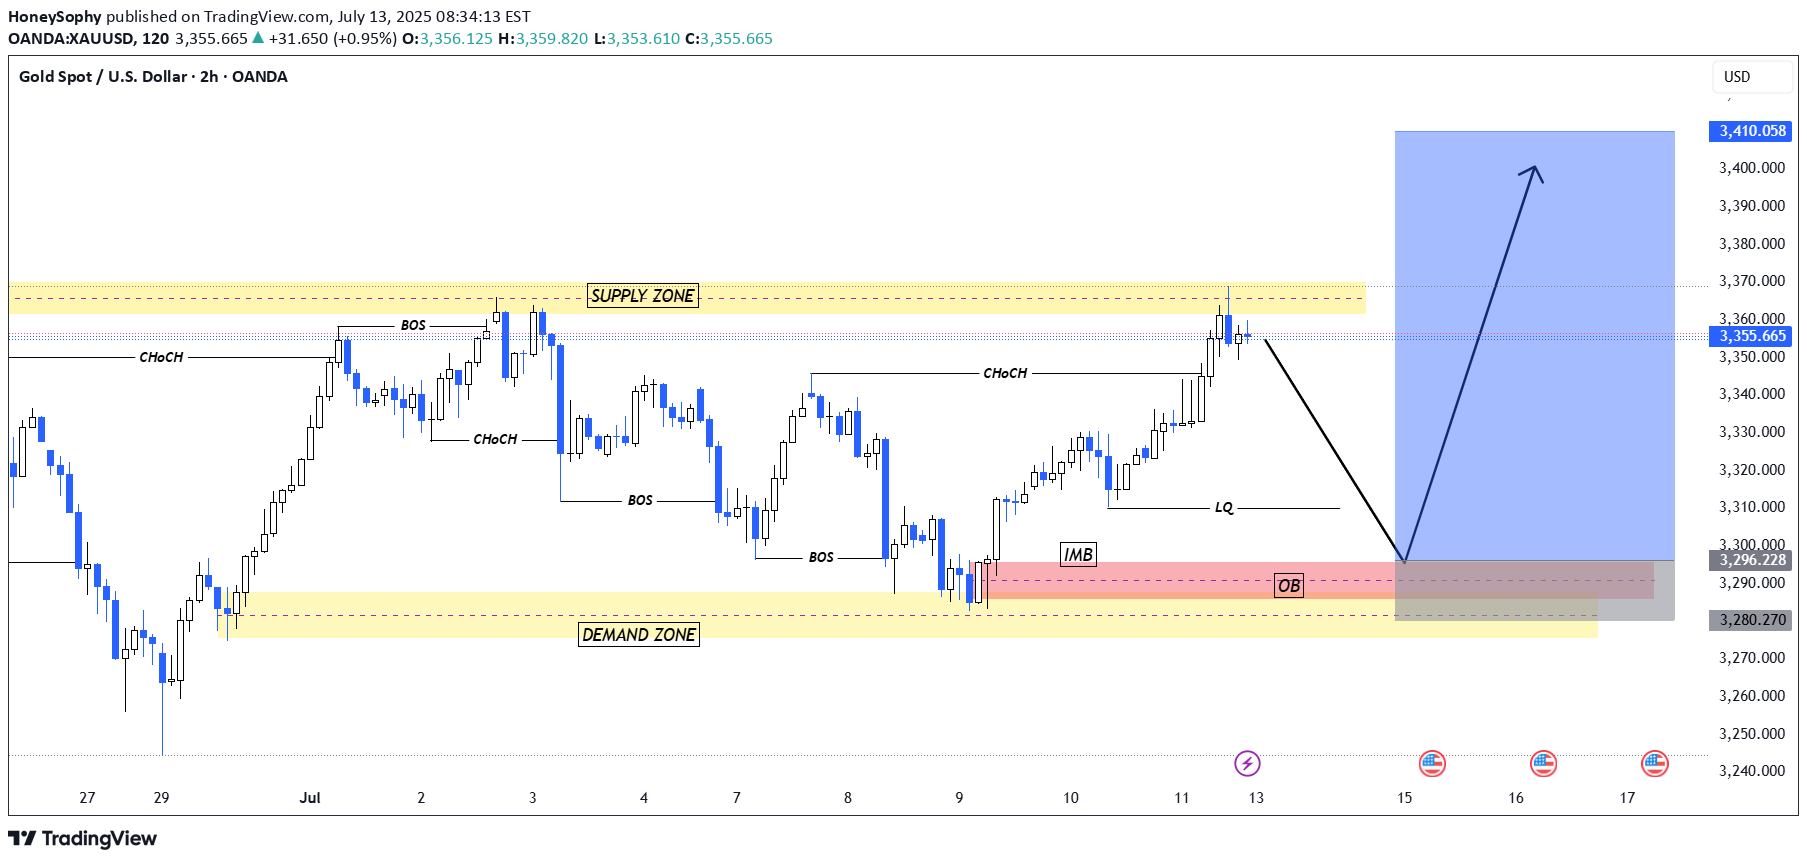
I have a hunch price will drive down to sweep LQ. below and provide bullish opportunity in from the OB identified below.Our goal for this week is to achieve a profit of at least 300%. This means that if you have an account of 10k, your profit for this week will exceed 30k. If you don't believe that I can achieve this goal, you can provide me with a demo account. I will then connect it to my main account. You can observe how I accomplished a 300% profit step by step. Click the link below to join us: t.me/+X7OWgK6GMTVjZTNk
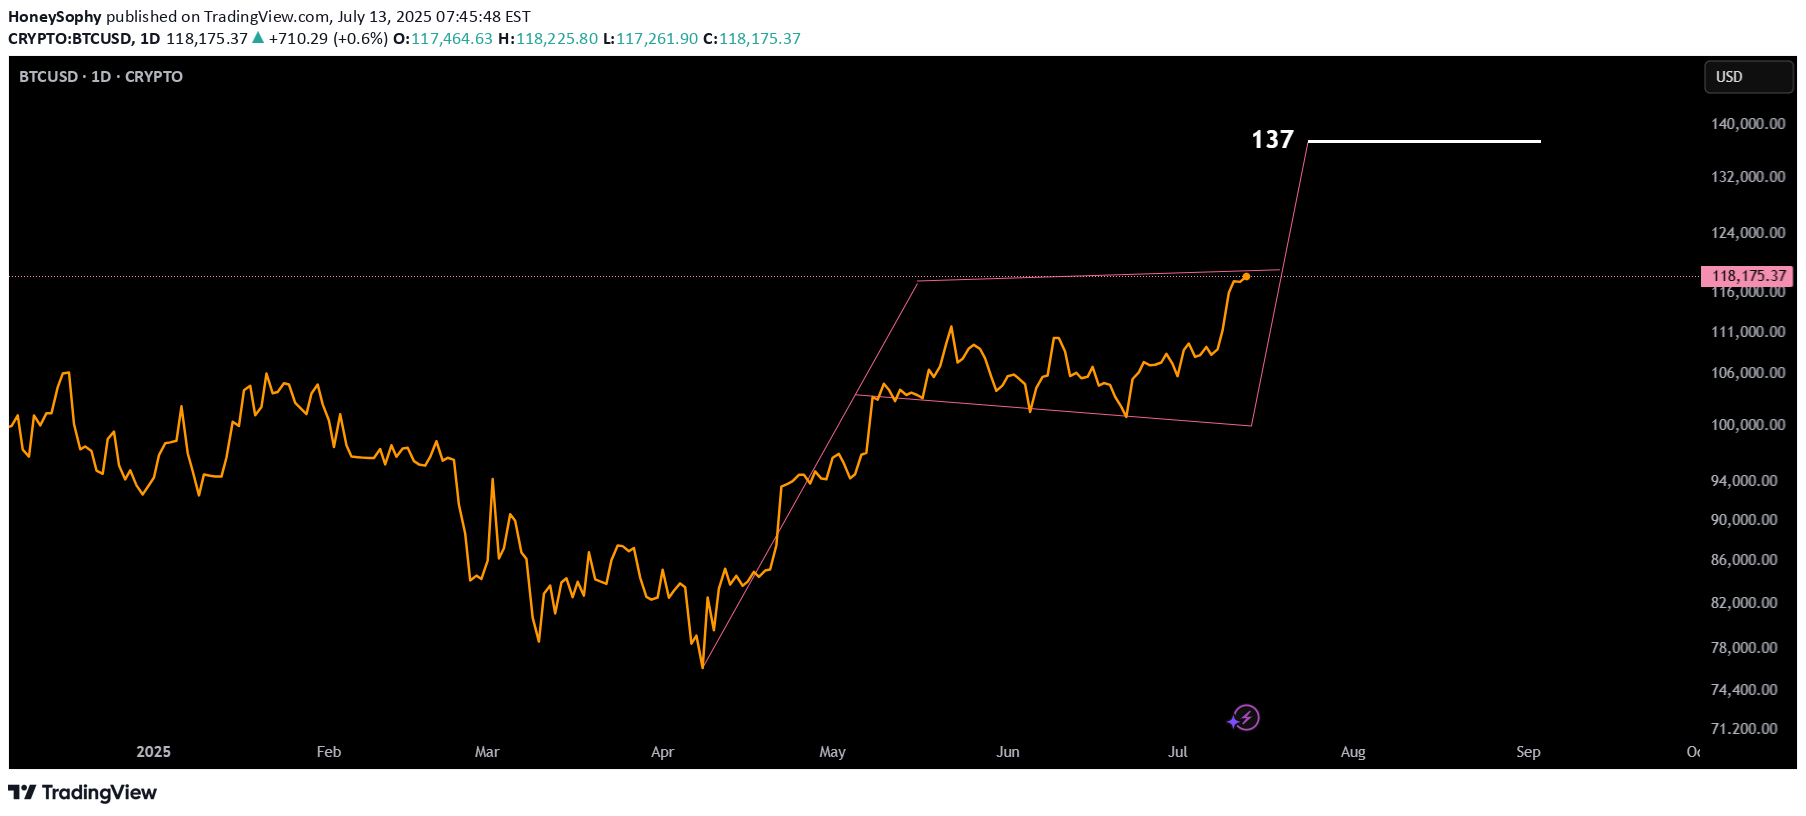
Based on the flag pole height BTC has a current target of 137. This is be so much fun!Our goal for this week is to achieve a profit of at least 300%. This means that if you have an account of 10k, your profit for this week will exceed 30k. If you don't believe that I can achieve this goal, you can provide me with a demo account. I will then connect it to my main account. You can observe how I accomplished a 300% profit step by step. Click the link below to join us: t.me/+X7OWgK6GMTVjZTNk
Gold has successfully broken above its descending trendline, signaling a potential shift in market structure and growing bullish momentum. A pullback toward the broken trendline is now likely, as price may retest the breakout zone. Once the pullback is completed, we anticipate a bullish continuation and a move toward higher levels. As long as price holds above the identified support zone, the bullish outlook remains valid. Will gold resume its rally after the pullback?
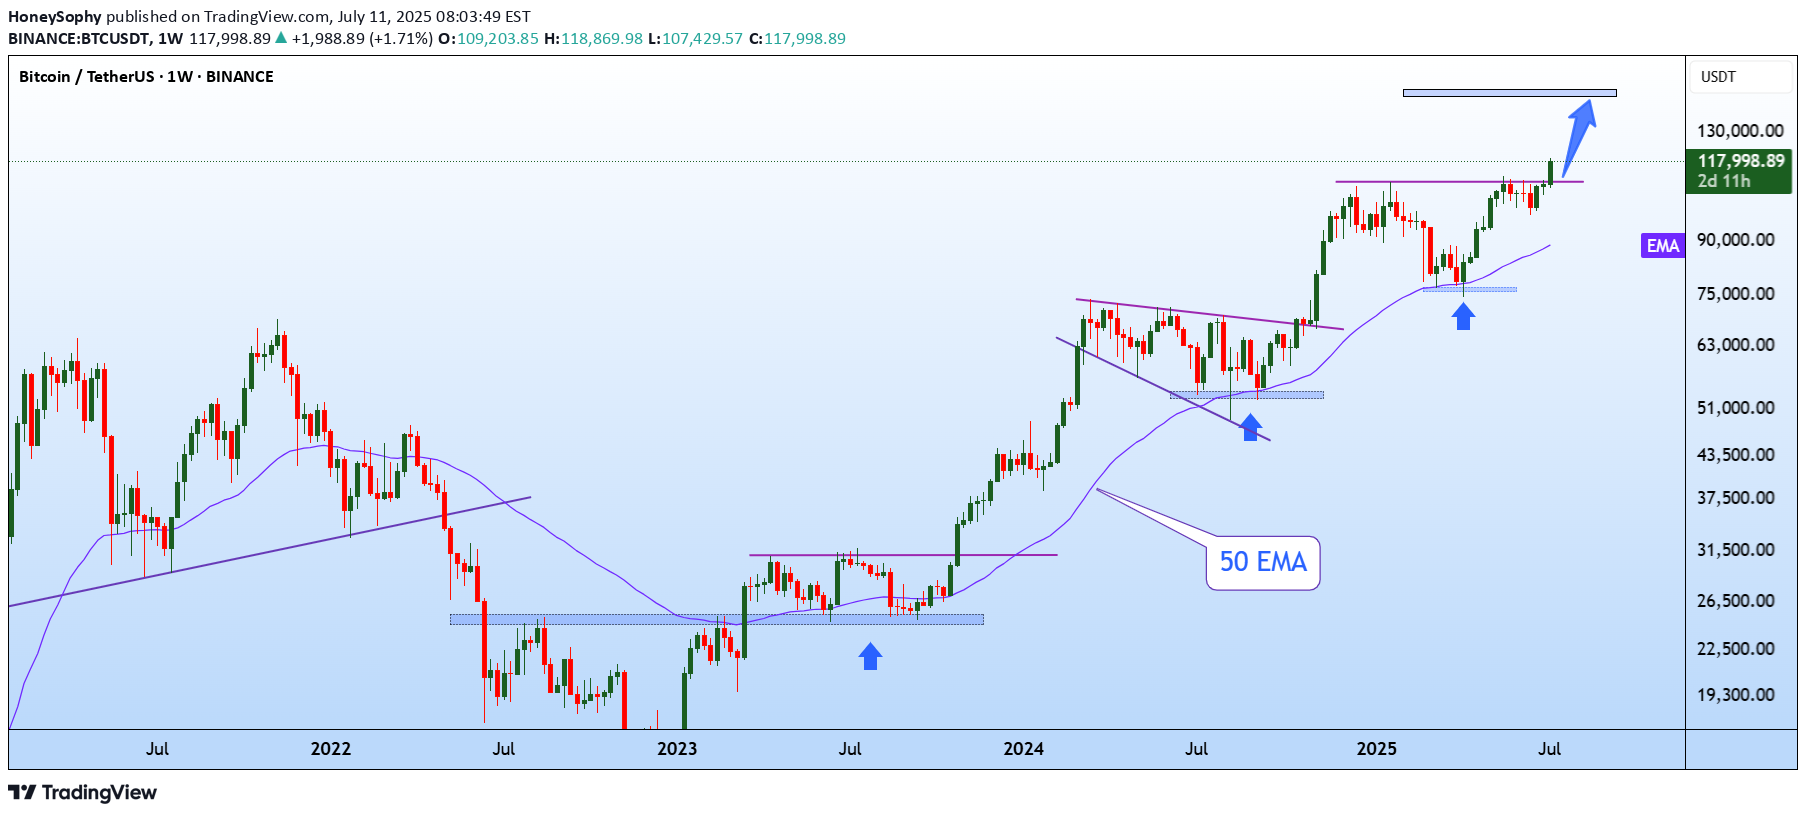
BTCUSDT continues to show exceptional strength and strong bullish momentum. When we look back at the charts from 2023 and 2024, a clear and reliable pattern stands out. Each time Bitcoin touched the 50 EMA on the weekly chart, it triggered a significant rally that led to new all-time highs. That same setup appears to be forming once again. BITCOIN tested the 50-week EMA around the $75,000 level and has since bounced with conviction. The price has reclaimed the $100,000 mark and is now challenging previous all-time high resistance. Historically, a successful bounce from this key moving average has not only signaled recovery but also sparked explosive upside moves. Following this repeating pattern, the current cycle target is positioned at $150,000. A clean breakout above the current resistance zone could act as the trigger that launches Bitcoin into uncharted territory. The technical structure remains bullish, momentum is clearly accelerating, and the overall trend continues to favor the upside. This moment represents a textbook Buy and HODL opportunity. Technical indicators are aligning, market sentiment is turning increasingly optimistic, and all signs suggest that Bitcoin could be preparing for another historic rally. Stay ready for what could be the next big move.Our goal for this week is to achieve a profit of at least 300%. This means that if you have an account of 10k, your profit for this week will exceed 30k. If you don't believe that I can achieve this goal, you can provide me with a demo account. I will then connect it to my main account. You can observe how I accomplished a 300% profit step by step. Click the link below to join us: t.me/+X7OWgK6GMTVjZTNk
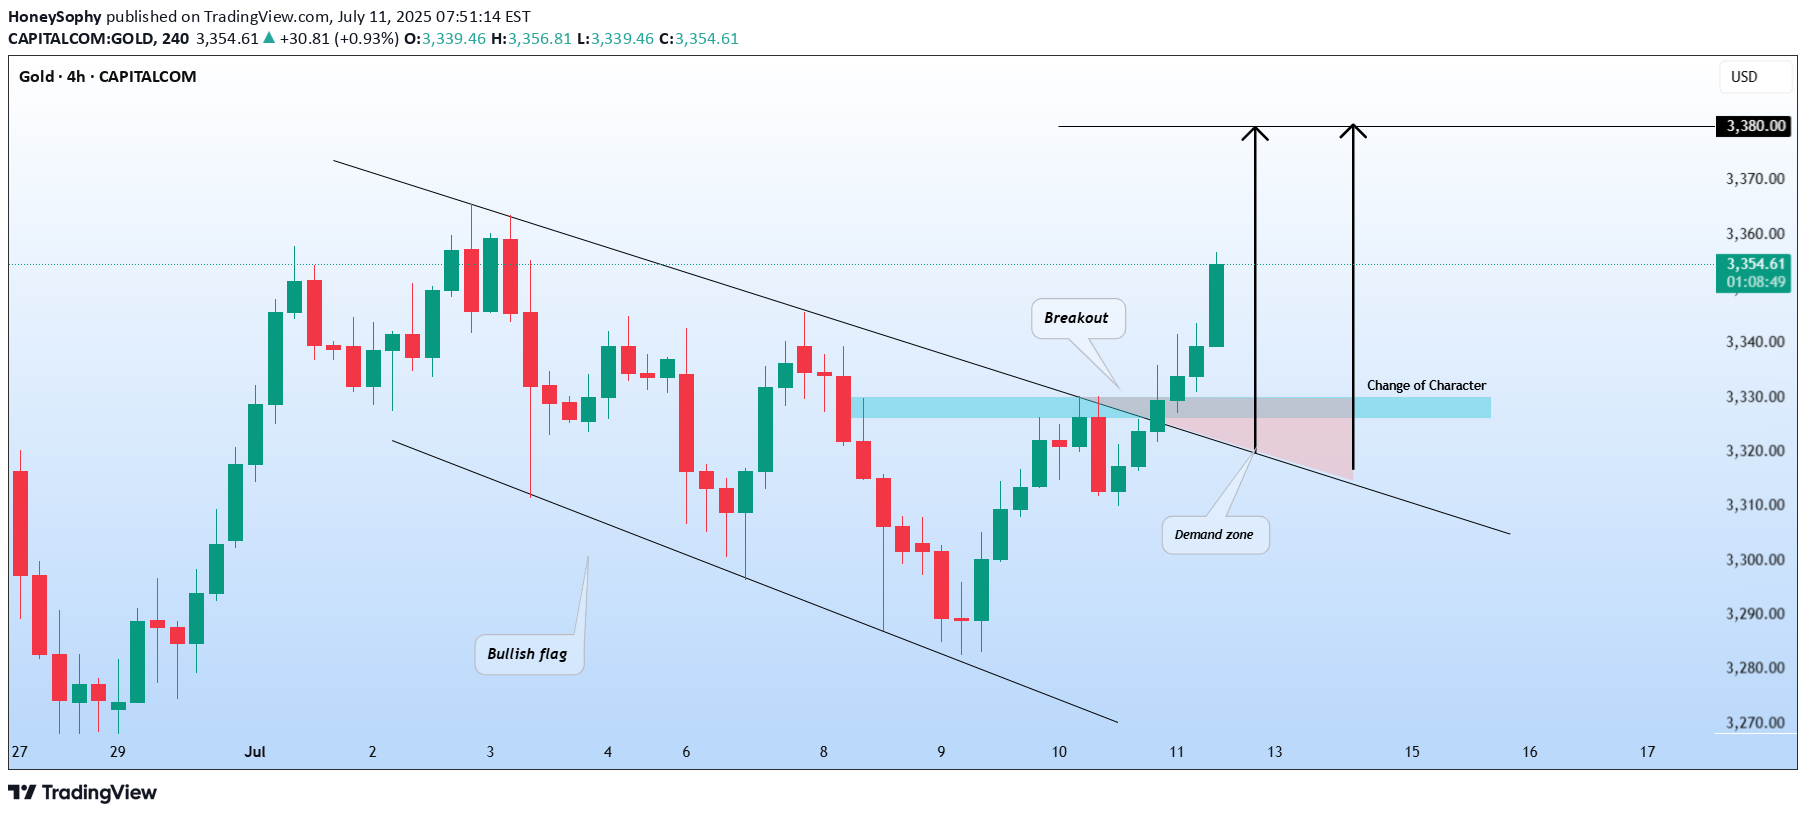
GOLD shows several bullish signals on the 4H chart. Initially, the price surpassed and closed above a resistance line of a bullish flag pattern. Following that, a confirmed Change of Character (CHoCH) took place. The price appears poised for further growth, with the next resistance level at 3380.Our goal for this week is to achieve a profit of at least 300%. This means that if you have an account of 10k, your profit for this week will exceed 30k. If you don't believe that I can achieve this goal, you can provide me with a demo account. I will then connect it to my main account. You can observe how I accomplished a 300% profit step by step. Click the link below to join us: t.me/+X7OWgK6GMTVjZTNk
Disclaimer
Any content and materials included in Sahmeto's website and official communication channels are a compilation of personal opinions and analyses and are not binding. They do not constitute any recommendation for buying, selling, entering or exiting the stock market and cryptocurrency market. Also, all news and analyses included in the website and channels are merely republished information from official and unofficial domestic and foreign sources, and it is obvious that users of the said content are responsible for following up and ensuring the authenticity and accuracy of the materials. Therefore, while disclaiming responsibility, it is declared that the responsibility for any decision-making, action, and potential profit and loss in the capital market and cryptocurrency market lies with the trader.