
Hill_Trading
@t_Hill_Trading

What symbols does the trader recommend buying?
Purchase History
پیام های تریدر
Filter
Hill_Trading

Looking at the chart. price gas retraced to a key level abd i am now looking at a nice long position
Hill_Trading

Looking ay the chart i can see a nice long trade into the upper trend line.
Hill_Trading

Im looking at the chart and see a nice short into the next resistance level
Hill_Trading
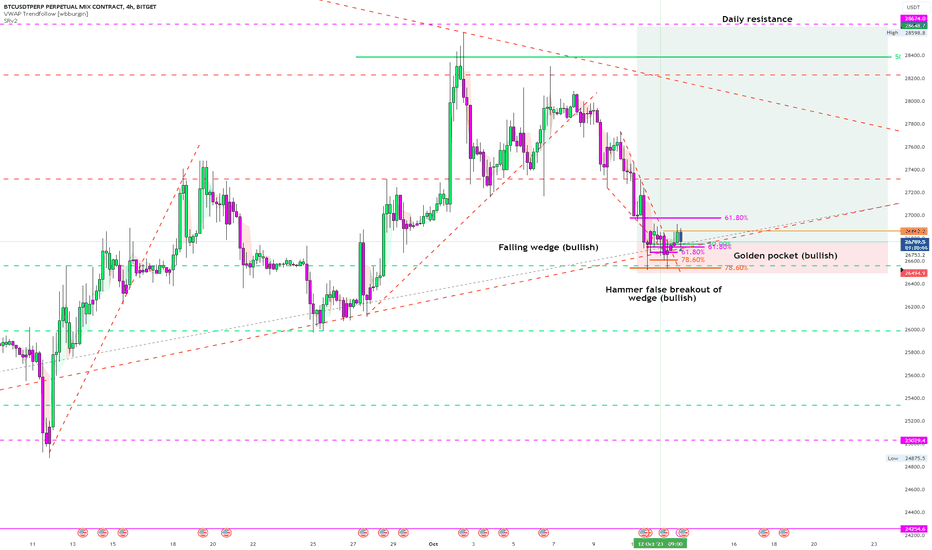
If you look at the chart, there are lots of reasons why i will be taking a long position on bitcoin. We have a falling wedge pattern which also had a false breakout afollowed buy a bullish breakout of the falling wedge patter. I will be looking at the daily resistance for taking profits. Good luck!
Hill_Trading

As we can see from the chart, JASMYUSDT has reached a daily support level. After a big push into support it created an inside bar. The following candle has created a false breakout from this inside bar and this can be a great signal for a trend reversal. I need to wait for the close of this bar to add confirmation to the trade. If this candle closes as a false breakout candle i will be looking to enter a long trade into the 50% and 61.8% area. If the candle closes below the inside bar i will not be taking the trade and looking at a possible short into resistance. Good Luck!
Hill_Trading

Looking at the chart we can see that XMR broke through the daily resistance (purple line). Shortly after it produced a nice inside bar followed by a breakout from the inside bar. This can signal a reversal of the trend. For further conformation it has produced a rising wedge pattern, which is also a reversal pattern. I'm opening a short position looking at the previous lows. Watch price action at significant levels (50% 61.8% fib) Good Luck!
Hill_Trading

XMRUSDT Short (inside bar reversal?) Looking at the chart we can see that XMR broke through the daily resistance (purple line). Shortly after it produced a nice inside bar followed by a breakout from the inside bar. This can signal a reversal of the trend I'm opening a short position looking at the previous lows. Good Luck!
Hill_Trading

As we can see from the chart STORUSDT has reached the daily resistance level (Purple line). Looking at the price action we have a nice pin bar which closed below the daily resistance. These candles are a strong indication of a possible reversal. More conformation is a rising wedge pattern. This is a reversal pattern also, and the top trend line also corresponds with the daily resistance. My bias is still on the short side after getting stopped out for a small loss previously. I will take a short trade on the close of the pin bar and my stop loss will be above the top of this candle. Entering on this candle is an aggressive move. So the safer option would be to wait for the breakout or for price to retrace. This would add more confluence to you trade by doing this. There also could be a possible head and shoulder pattern developing, which could give some traders a good opportunity to trade if this does actually happen. Just something to keep in mind. Also keep in mind the swing fib levels and watch price action at these key levels. They can be used to take part profits along the way, or add into your trade. Good luck!
Hill_Trading

As we can see from the chart STORUSDT has reached the daily resistance level (Purple line). Having already got a rejection from this level, it has now retraced into the 4hr order block and created an inside block candle followed by a false breakout candle. This is a strong reversal pattern. I will be looking for a short from this level into the previous lows. Paying attention to price action at significant levels (50%-61.8% FIB) trend line and previous support. Good luck!
Hill_Trading

Bitcoin has reached the 4 hour resistance and got rejected. It retraced to the resistance order block and has produced a nice longed wick candle. Im shorting into the next resistance level, which is also the dynamic resistance.
Disclaimer
Any content and materials included in Sahmeto's website and official communication channels are a compilation of personal opinions and analyses and are not binding. They do not constitute any recommendation for buying, selling, entering or exiting the stock market and cryptocurrency market. Also, all news and analyses included in the website and channels are merely republished information from official and unofficial domestic and foreign sources, and it is obvious that users of the said content are responsible for following up and ensuring the authenticity and accuracy of the materials. Therefore, while disclaiming responsibility, it is declared that the responsibility for any decision-making, action, and potential profit and loss in the capital market and cryptocurrency market lies with the trader.